


Projections are, in my opinion, the most underrated-overrated part of fantasy baseball analysis. What I mean by that is, you will constantly hear many analysts preaching not to rely on projections during draft season. They are generally right; this isn’t to say your own subjective brain is going to be more accurate than an objective statistical model, but projections have multiple limitations.
For one, the purpose of projections is to estimate a given player’s average outcome. For example, if I were to tell you that Mike Trout was projected to hit 40 home runs in 2022, that doesn’t mean my model would be “wrong” if he ended up hitting 41. Essentially, if we had the power to simulate the season 10,000 times, Trout would have an average of 40 home runs across all simulations.
When you are drafting your fantasy baseball team, you are not necessarily always interested in a player’s average outcome. When you’re in the 20th round, you should be much more concerned about a player’s upside than his average outcome. Drafting solely based on projections will likely leave you with a team full of low-ceiling, safe players.
With all that said, projections have a purpose. I rely on them heavily early in drafts. We can safely use average outcomes to determine whether to draft Fernando Tatis Jr. or Juan Soto in the first round. Additionally, projections will, at the very least, give us a general idea of how to expect a given player to perform. Just because we’re not basing our entire draft strategy off projections doesn’t mean they aren’t a factor.
There are numerous season-long projection systems publicly available online. My personal favorites are THE BAT X and ZiPS. If you don’t love any of these models, you can also make your own! It’s much less impossible than you think. All it takes is knowledge of some statistics-related software, such as R, Python, or even Microsoft Excel. If you don’t have a ton of experience using any of those programs, keep reading!
Introduction to the Packages
Now, let’s get into it. For this tutorial, we will be using R. If you have never worked with R before, you will have to download it onto your computer. If this applies to you, follow the steps using this link. I will say that this tutorial will be more about analyzing baseball data than how to actually create R scripts. So if you are truly a beginner, I recommend looking up a tutorial on YouTube to learn the basics of R.
The best way to work with baseball data from the internet, in my opinion, is Bill Petti’s “baseballr” package. Through this package, you can scrape data from Baseball Savant, Retrosheet, Baseball-Reference, FanGraphs, and more.
For simplicity’s sake, we will be using R to make projections for 2022 using Marcel, the system created by Tom Tango. This was created as an introduction level projection system and thus has many limitations. However, it is one of the few where the formula is publicly available. If you are interested in creating your own formula, I will get into that later.
Gathering the Data
Here’s the functions we will use to scrape data from FanGraphs:
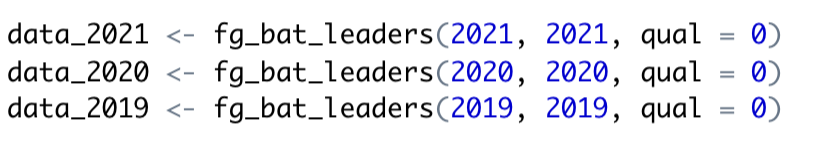
Since Marcel uses the previous three years of projections, we will use 2019-2021. If you want to combine multiple years of data, you can set the first two arguments to be different years. For example “fg_bat_leaders(2019, 2021)” will give you data from 2019-2021. Since we will need to split up the data by year anyway, it was easier to create three separate datasets.
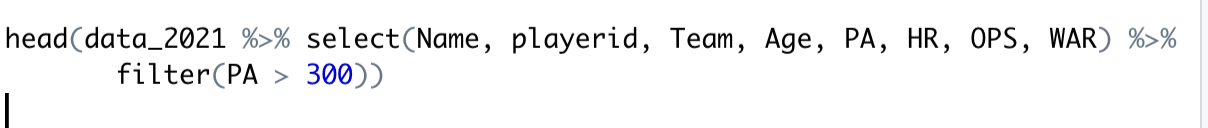
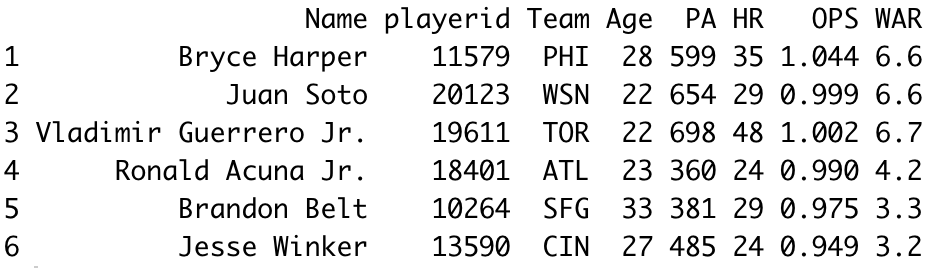
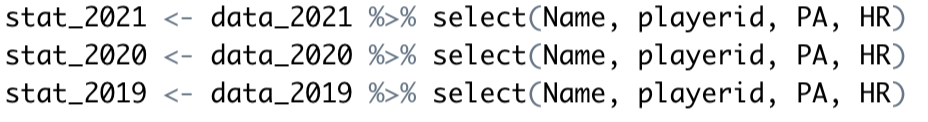
qual = 0″ means I am setting the minimum PA to be 0, since we want to capture all the data. The result of this function will be a data frame saved to the variable “data_n”, where n represents the year. Using the “head()” function, let’s take a look at the first few rows of the dataset from 2021. Using the “select” function, I chose only a handful of stats for visualization purposes, since the actual dataset has more than 200 columns. Using the “filter” function, I made sure the listed players had more than 300 PA.
For this tutorial, we will be using data strictly from FanGraphs. However, as I mentioned earlier, there are plenty of more sources you can scrape data from, and you can read more about those functions on Bill Petti’s github.
Data Crunching
Now let’s get into the fun stuff. We will be following the steps Tom Tango outlined here to create our projections. First, we want to select the columns we want to use for each season: playerid, Age, Plate appearances, and the stat we are looking to project (in this example, we will use home runs).
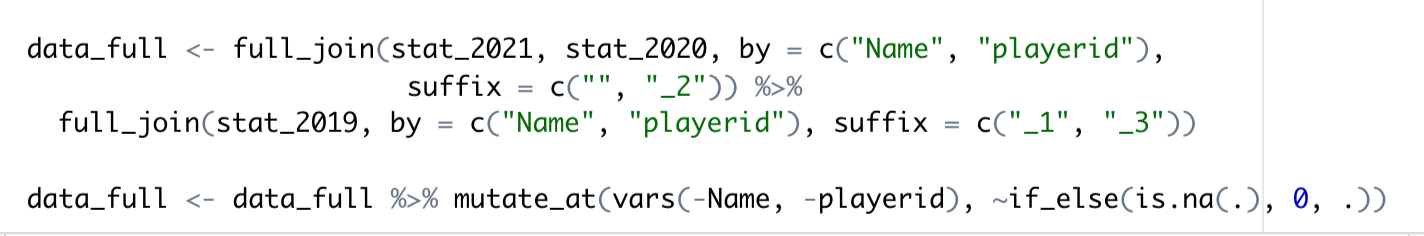
Then, we need to combine the data using a join. A “full_join” will combine all the rows in each data frame. There is also an “inner_join” (which would only combine the players that are contained in both tables) or “right_join”/”left_join” (which takes all the rows in one table and only matching rows from the other). We then utilize the “mutate_all” function to change any “NA” datatype to 0.
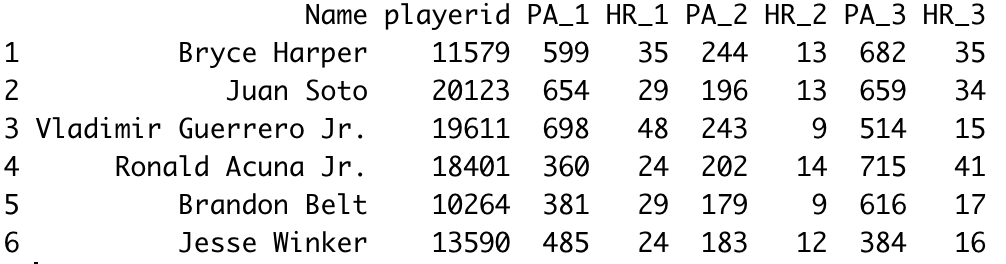
Let’s take a look at what the dataset looks like now.

Step 1: Weight each season on the 3/4/5 (3 representing 2019, 4 from 2020, and 5 from 2021). The “mutate” function allows us to add an extra column.

Step 2: Determine the league average HR/PA for each season and multiply by the number of plate appearances the player had in each season, and then sum them using the 3/4/5 scale. We then prorate it to 1200 PA, as Tom outlines.

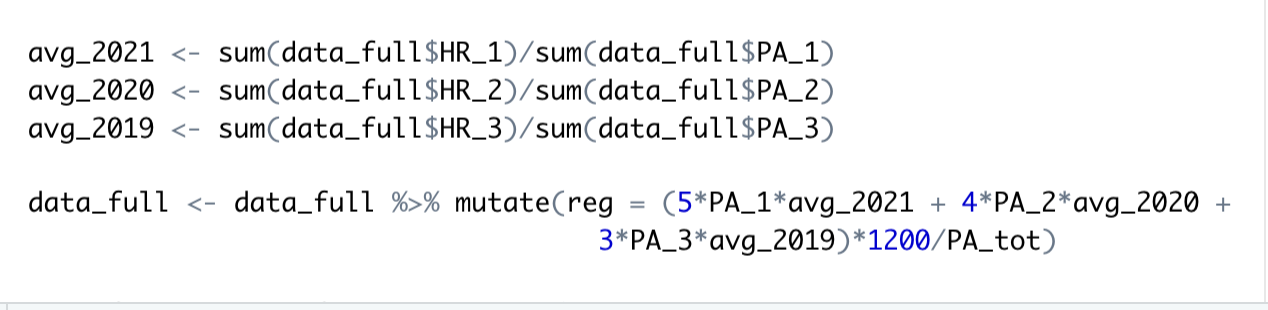
Step 3: Add Step 1 and Step 2. This is pretty simple
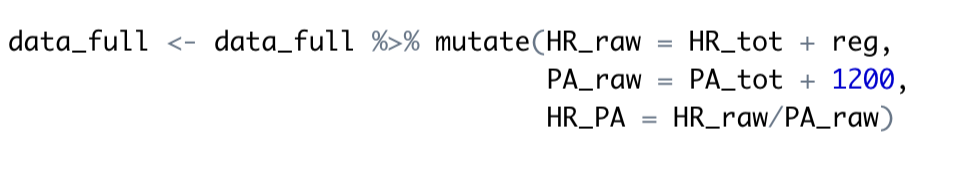
Step 4: Determine the projected plate appearances using Tom’s scale. Then use the information we have (HR/PA) to project home runs.
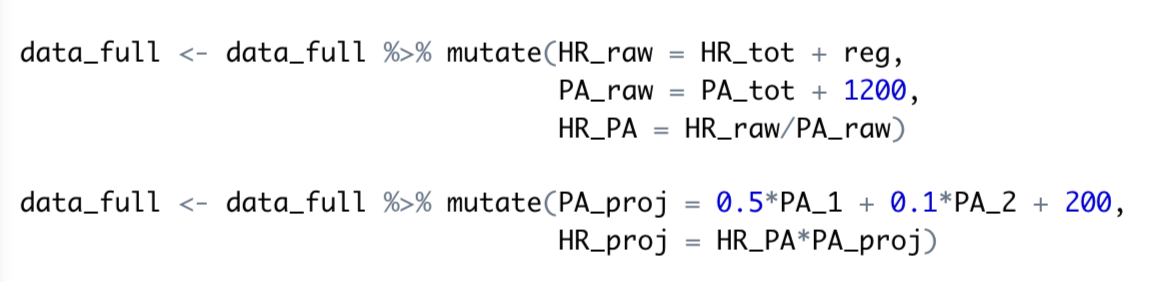
Tom also adds an age adjustment, but we will skip that so we don’t complicate everything further. Now, let’s take a look at what a projection would look like for three players: Juan Soto, José Abreu, and Aaron Judge.

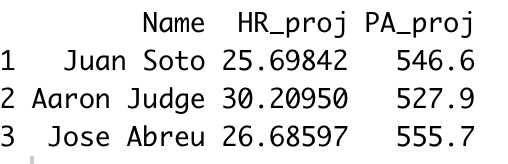
As you can tell, the regression to the mean component is very prevalent here.
Creating Your Own Formula
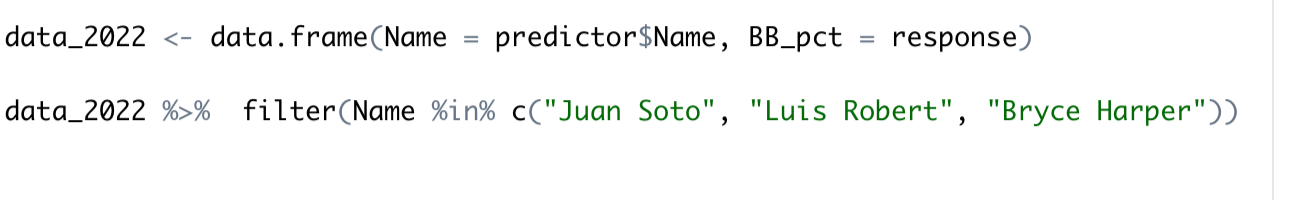
Now, we are going to use linear regression to create our own formula to project walk rate. We will use 2020 data as a predictor and 2021 as a response, then use the formula with 2021 data to create our 2022 projections. This is a flawed process for a number of reasons, but we will continue our theme here of making everything simple. Anyway, the coding process starts out fairly similar.
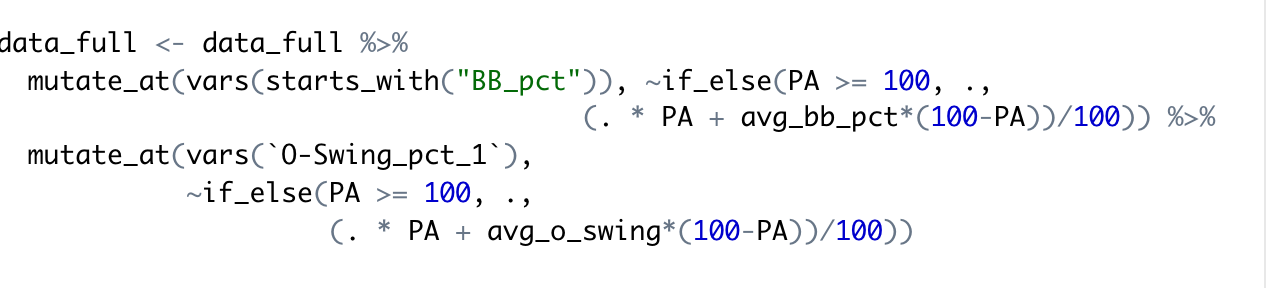
We will use “left_join” this time since we cannot have any NA values in our response variable. Our predictor variables will be BB% from the previous year, as well as O-Swing%.
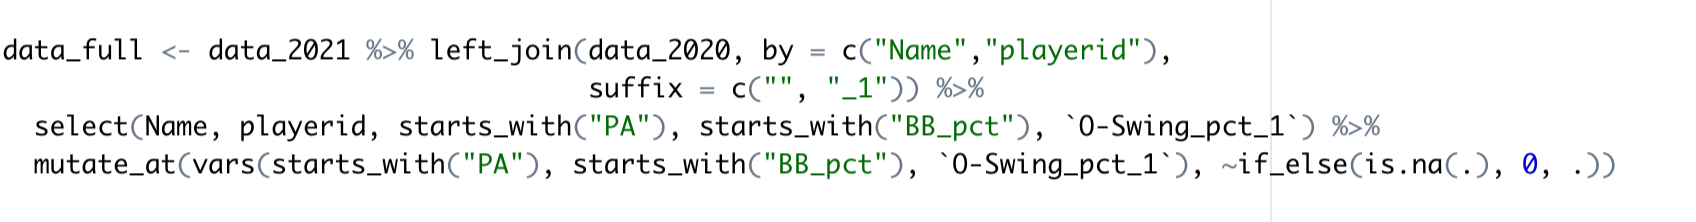
Next, to account for variance in a small sample, we will give every player with under 200 PA, some league-average production. If you are confused by the syntax, the “.” symbol essentially stands for the previous value of the number prior to the function being executed.

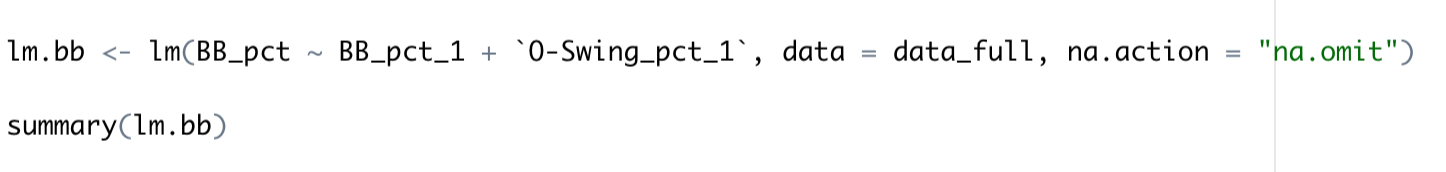
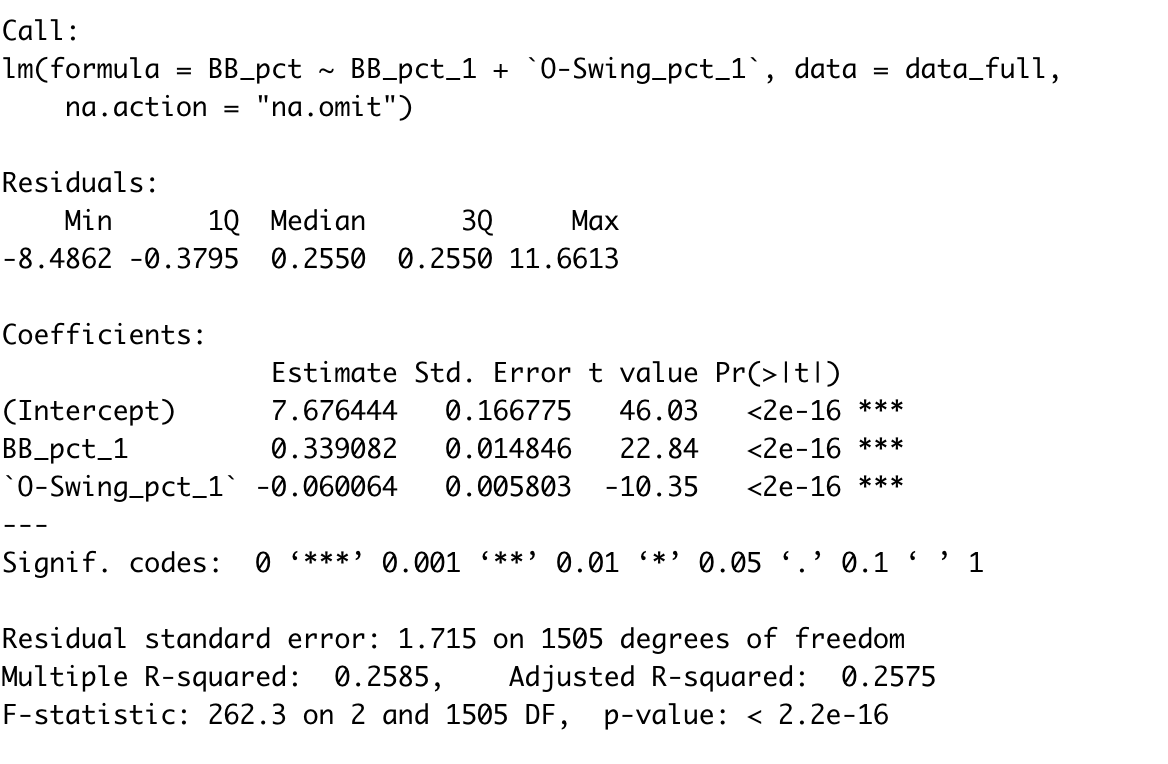
The “lm” function in R takes care of all the legwork in linear regression.
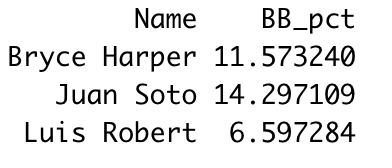
Now, using the “predict” function, we can use the same formula for our 2022 projections.
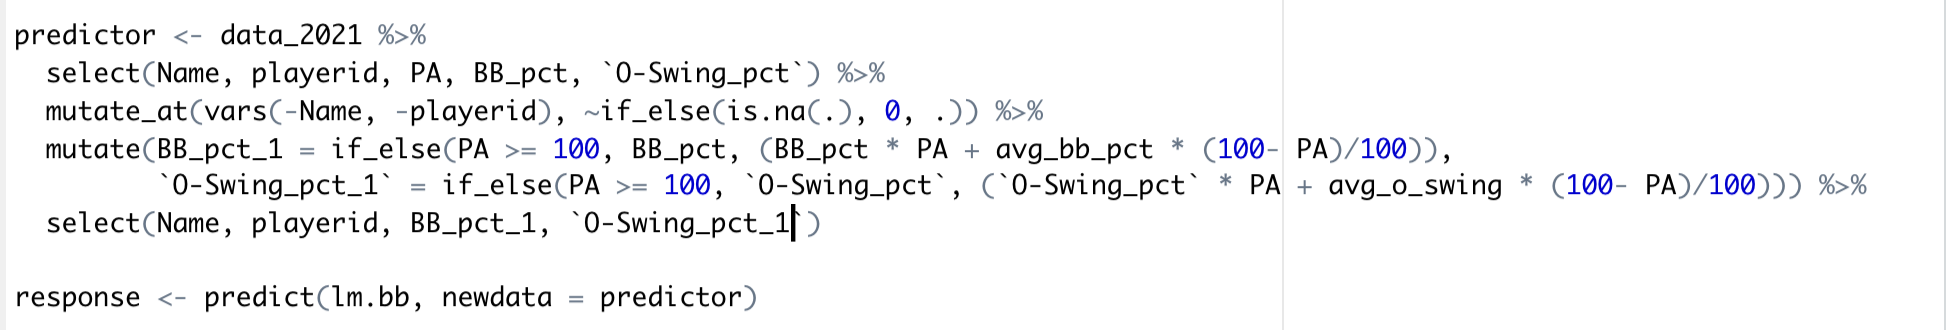
And then we can look at the projections for a few players.
Conclusion
If you have experience with modeling or data science, you’ll probably realize the flaws in the methods I used. Consider this tutorial more of a baseline than an actual method of projections. Personally, I’ve worked on designing my own projections using a much more sophisticated process.
My favorite aspect of R is the variety of model types available for use, such as Generalized Additive Models, Random Forests, and Neural Networks. You can read more about such model types and more here.
R can be one of the most actionable tools in fantasy baseball when used correctly. Full-player projections are difficult and time-consuming, but maybe you can find a niche. Maybe you can build a model to project rookie statistics based on minor league data.
Perhaps you can determine the factors that influence the potential production of a streamer in a given week. These are just a couple of examples of how you can use technology to gain an edge over your league mates.
Soooo… I and many others use linux or mobile OSes. Might want to put the fact that a program only runs on 2 OSes somewhere near the top of a piece like this.
also, re: “Drafting solely based on projections will likely leave you with a team full of low-floor, safe players.” I think you mean “high-floor” players, no?
I actually meant to say “low-ceiling”, but same difference. Thanks for pointing it out!
Nice tutorial Jeremy, was easy to follow along. Thanks for posting!
Thanks for the article we are trying to build Predictive analysis for MLB Players … Can we connect to know your interest to help us on the same ,Please do let me know how can i contact you .. you can reach me out ashok@origami.dev