


Sometimes it feels like we have always been waiting for Francisco Lindor. Maybe it is just because I am a Cleveland fan, but I was anxiously awaiting his debut from the moment he was drafted. Then I was waiting to see just how good the bat could be. Then, after his bat peaked in 2018, I was waiting to see if he could return to those heights – and if he would stay in Cleveland. By the start of this off-season, the Mets seemed like a perfectly logical place for him to land, and yet we waited forever for that deal to happen. Then waited to see if he would sign an extension.
And now, Mets fans, Lindor fans, and fantasy managers alike are waiting to see when Lindor will break out of a slump that really dates back to the start of the 2020 season. Since the opening of the 60 game season, Lindor is posting a .246/.330/.380 line with nine home runs in 349 plate appearances. He’s posted 2.0 fWAR in that time, thanks in large part to his always impressive defense, but his 95 wRC+ is a far cry from the 119 career mark he had going into 2020.
The Teens vs. The ’20’s
When digging into Lindor’s struggles, perhaps the most shocking thing I came across was how many things did not change. From his debut in 2015 through the end of his 2019 season, Lindor had an 8.0% walk rate and a 14.0% strikeout rate. Since the start of 2020, those rates are 10.0% and 14.8%. His average exit velocity for 2015-19 was 89.8. In 2020-21, it dropped all the way to 89.5. Not exactly a smoking gun.
In fact, there is a whole suite of numbers that look awfully similar or have moved only a small amount:
| Stat | 2015-19 | 2020-21 |
| K% | 14.0% | 14.8% |
| BB% | 8.0% | 10.0% |
| Hard Hit Rate | 37.4% | 41.1% |
| EV | 89.8 | 89.5 |
| LA | 11.6 | 12 |
| Pull% | 40.2% | 41.5% |
| FB% | 35.8% | 34.9% |
When a hitter goes into the kind of downturn Lindor has gone into, obvious culprits are more strikeouts, fewer walks, fewer hard-hit balls, lower exit velocity, a big change in launch angle, pulling the ball less (or perhaps more), fewer (or perhaps more) fly balls. But none of that stands out.
So what has changed?
| Stat | 2015-19 | 2020-21 |
| HR/FB% | 14.7% | 10.1% |
| Barrel Rate | 6.3% | 4.7% |
| Swinging Strike Rate | 7.5% | 8.9% |
| Contact Rate | 84.5% | 81.3% |
| BABIP | .300 | .266 |
Despite making a bit more hard contact on a per-swing basis, Lindor has seen his HR/FB rate drop and his barrel rate drop. Some of that might be bad luck – if you have more hard-hit balls and maintain your launch angle, a drop in barrels represents less overlap of the two. If he is hitting the same number of balls in the ideal launch angles and the same number of balls in the ideal exit velocities, it’s a bit surprising he isn’t hitting the same number in the combination of the two.
Maybe he is maintaining his exit velocity overall, but getting a lower EV on fly balls and line drives – the batted balls that can turn into home runs? Well, in 2015-2019, his EV on balls in the air was 92.9. In 2020-21, it is 92.8.
What’s the Problem?
The problem appears to be with BABIP and HR/FB rate. While his contact rate is down a bit, his contact quality looks a lot like the earlier part of his career (though not like his 2018 peak) and his walk and strikeout rates look good.
Before throwing up our hands and saying it’s just bad luck, maybe we can find some patterns by breaking away from seasonal data and looking at some rolling charts. For example, a graph of his 50-batted-balls hard-hit rate may show us a decline we didn’t see in the seasonal data:
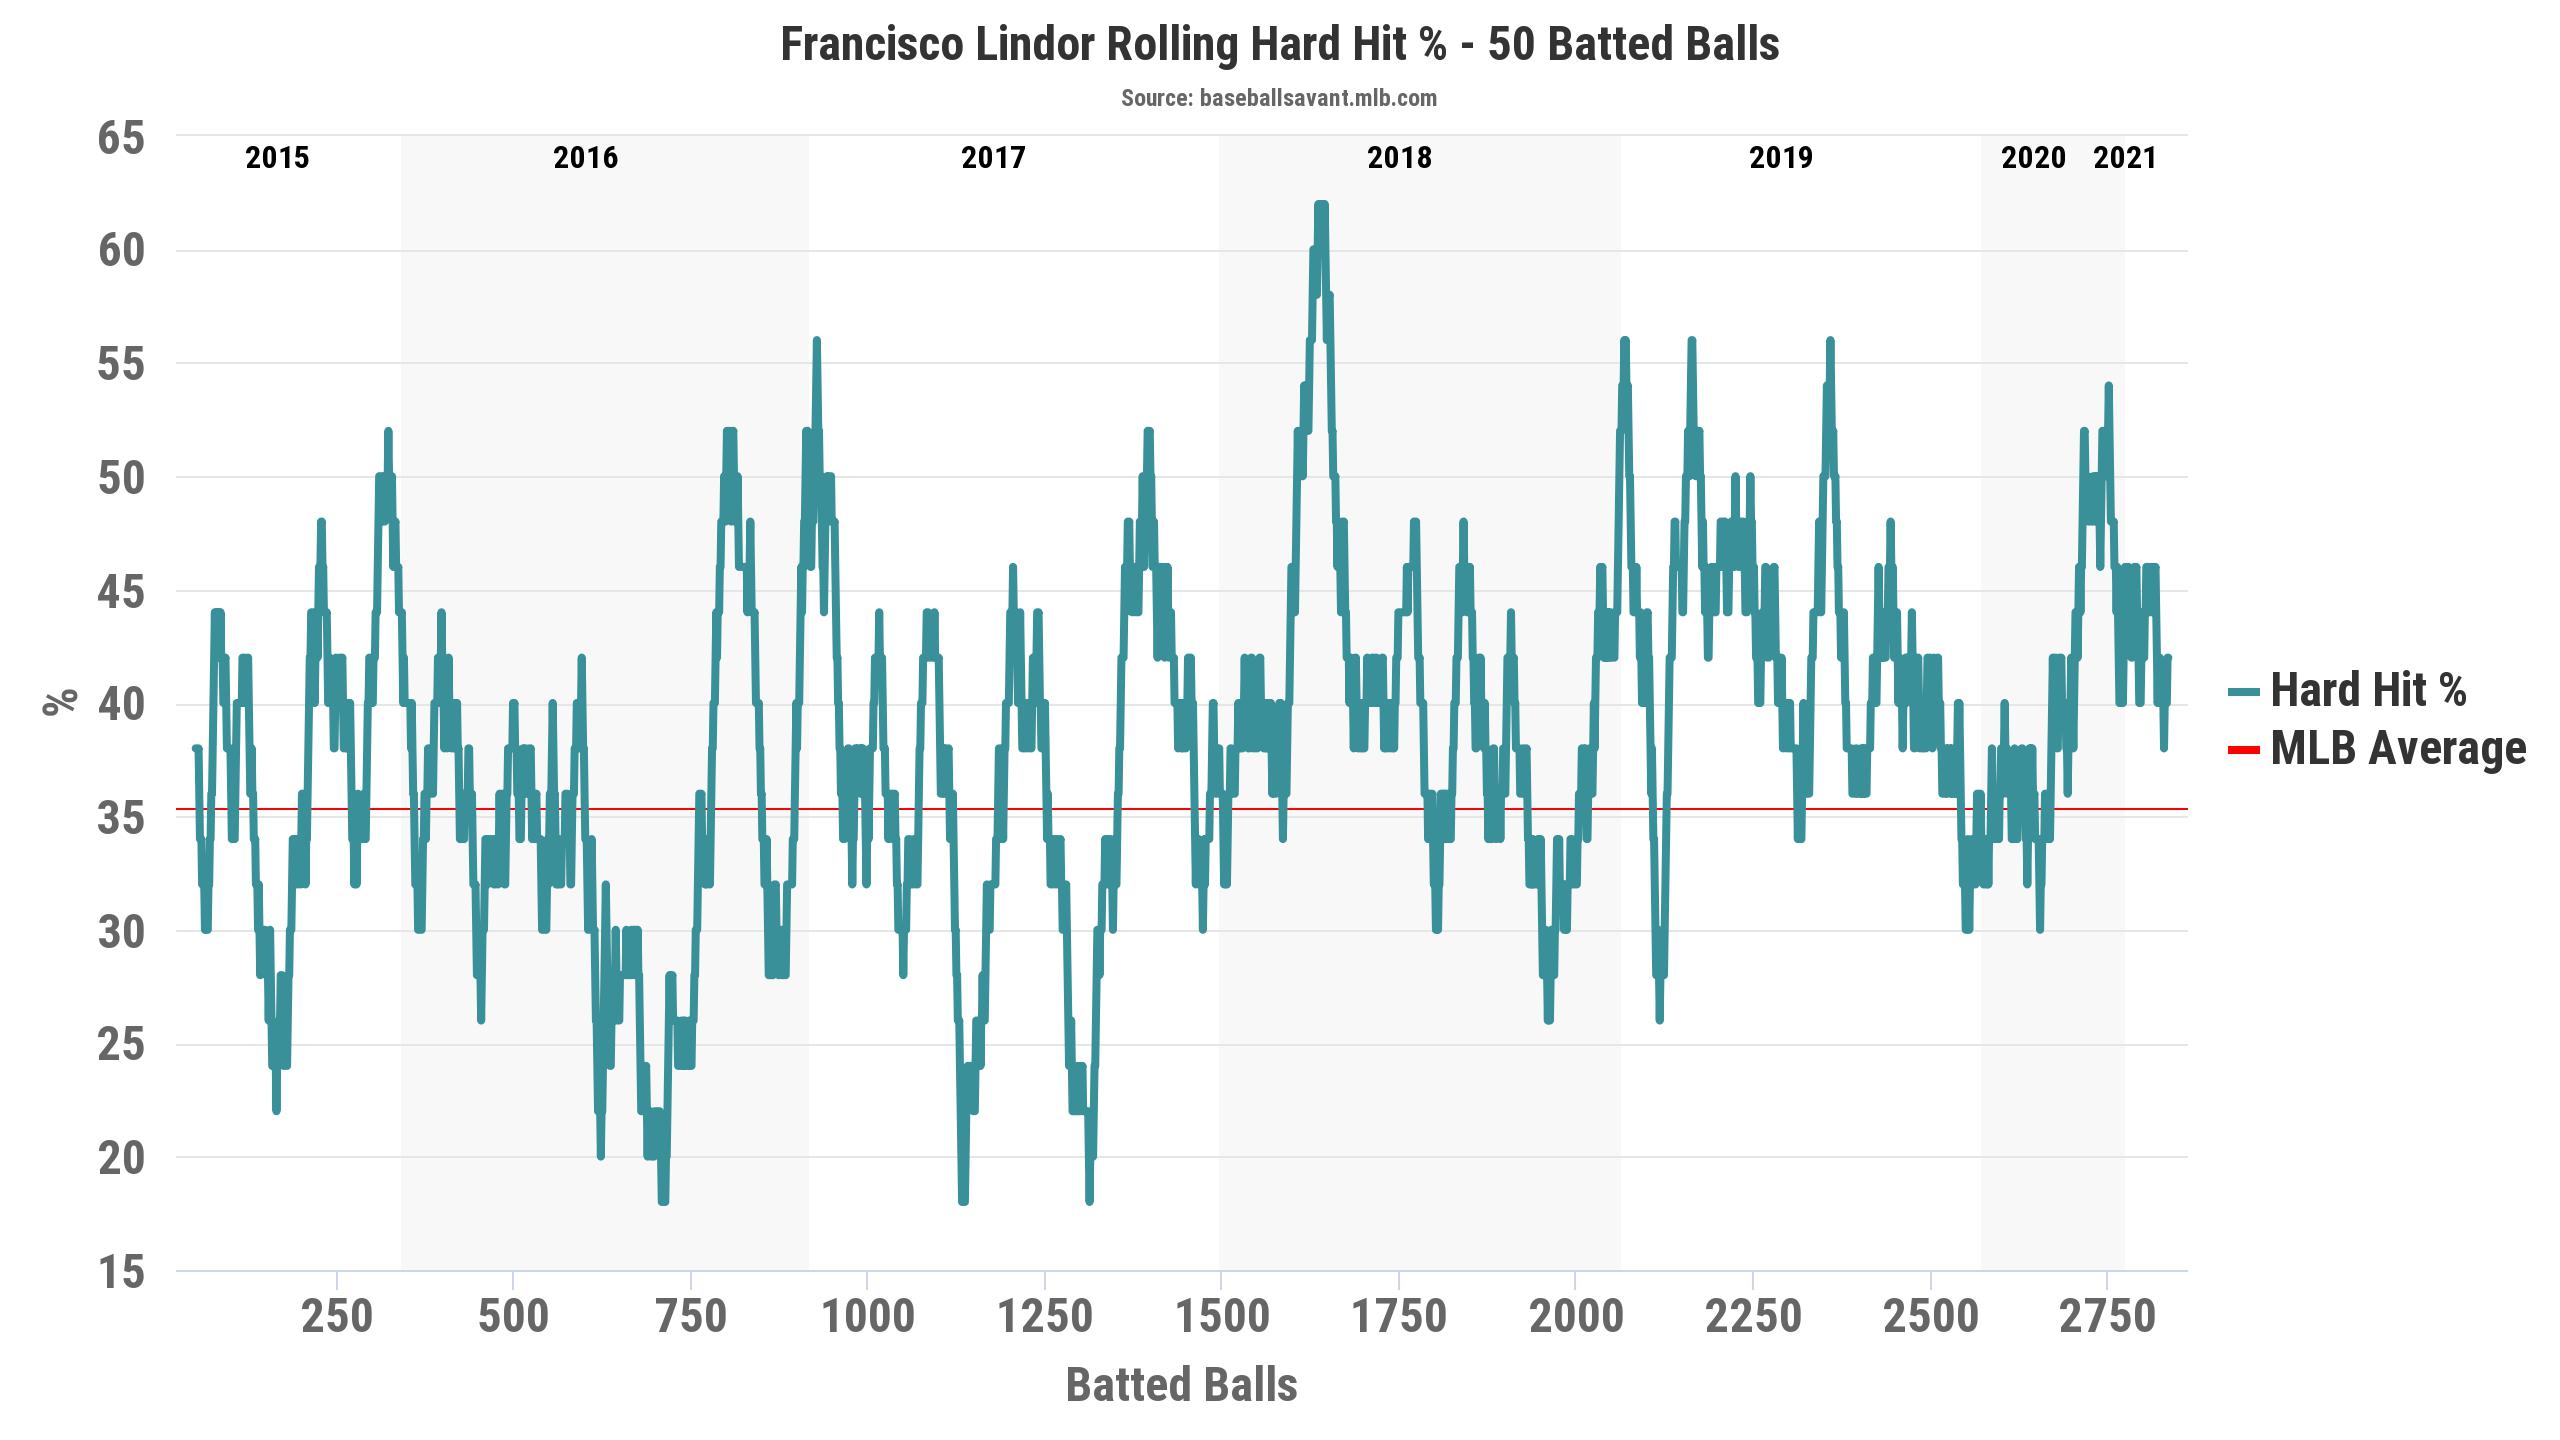
Data and visual from Baseball Savant
Nope – in fact, there is a pretty steady upward trend, particularly if you can get yourself to ignore the outlier spike in early 2018.
Maybe a rolling sweet spot graph will show us that his launch angle is steady on average but not PA-to-PA:
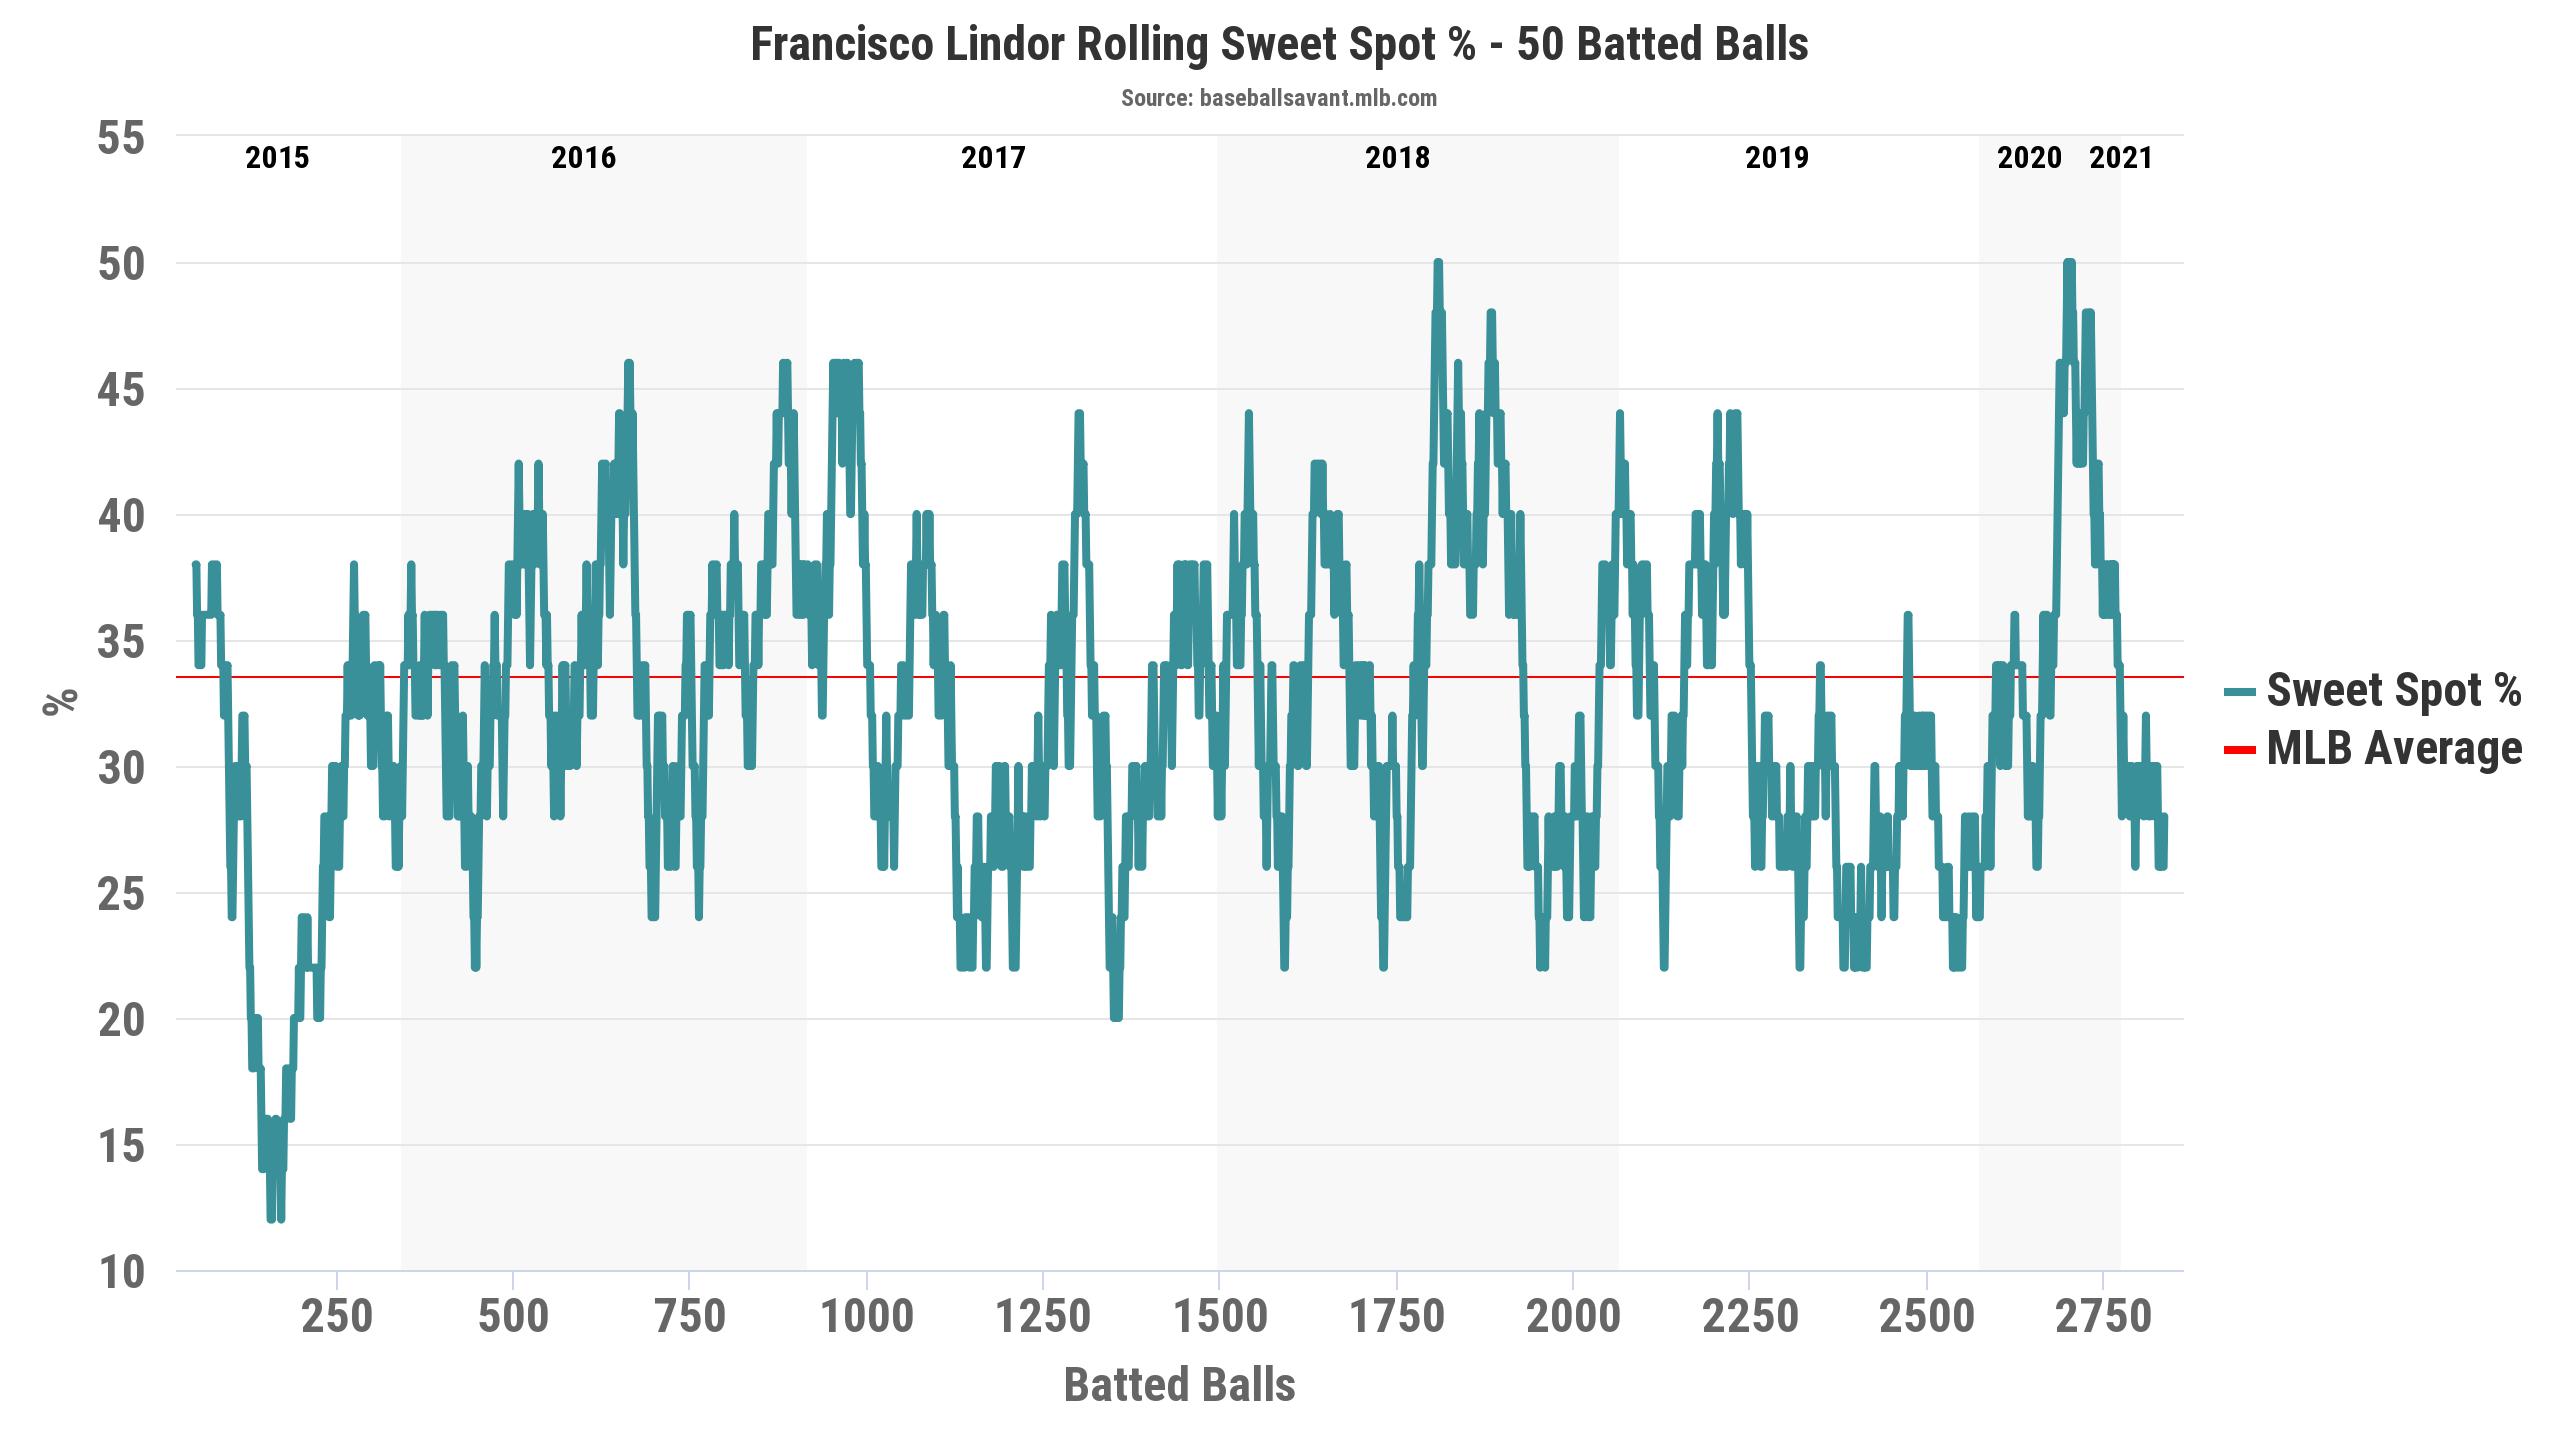
Data and visual from Baseball Savant
Nope. In fact, while he is in a bit of a trough right now, his peak in early 2020 is nearly the height of his career and his dip in early 2020 is not nearly as low as his previous lows.
So maybe his xwOBA will tell us something – barrels are down despite the hard hits and sweet spots, so perhaps there is a clear downward trend in xwOBA?
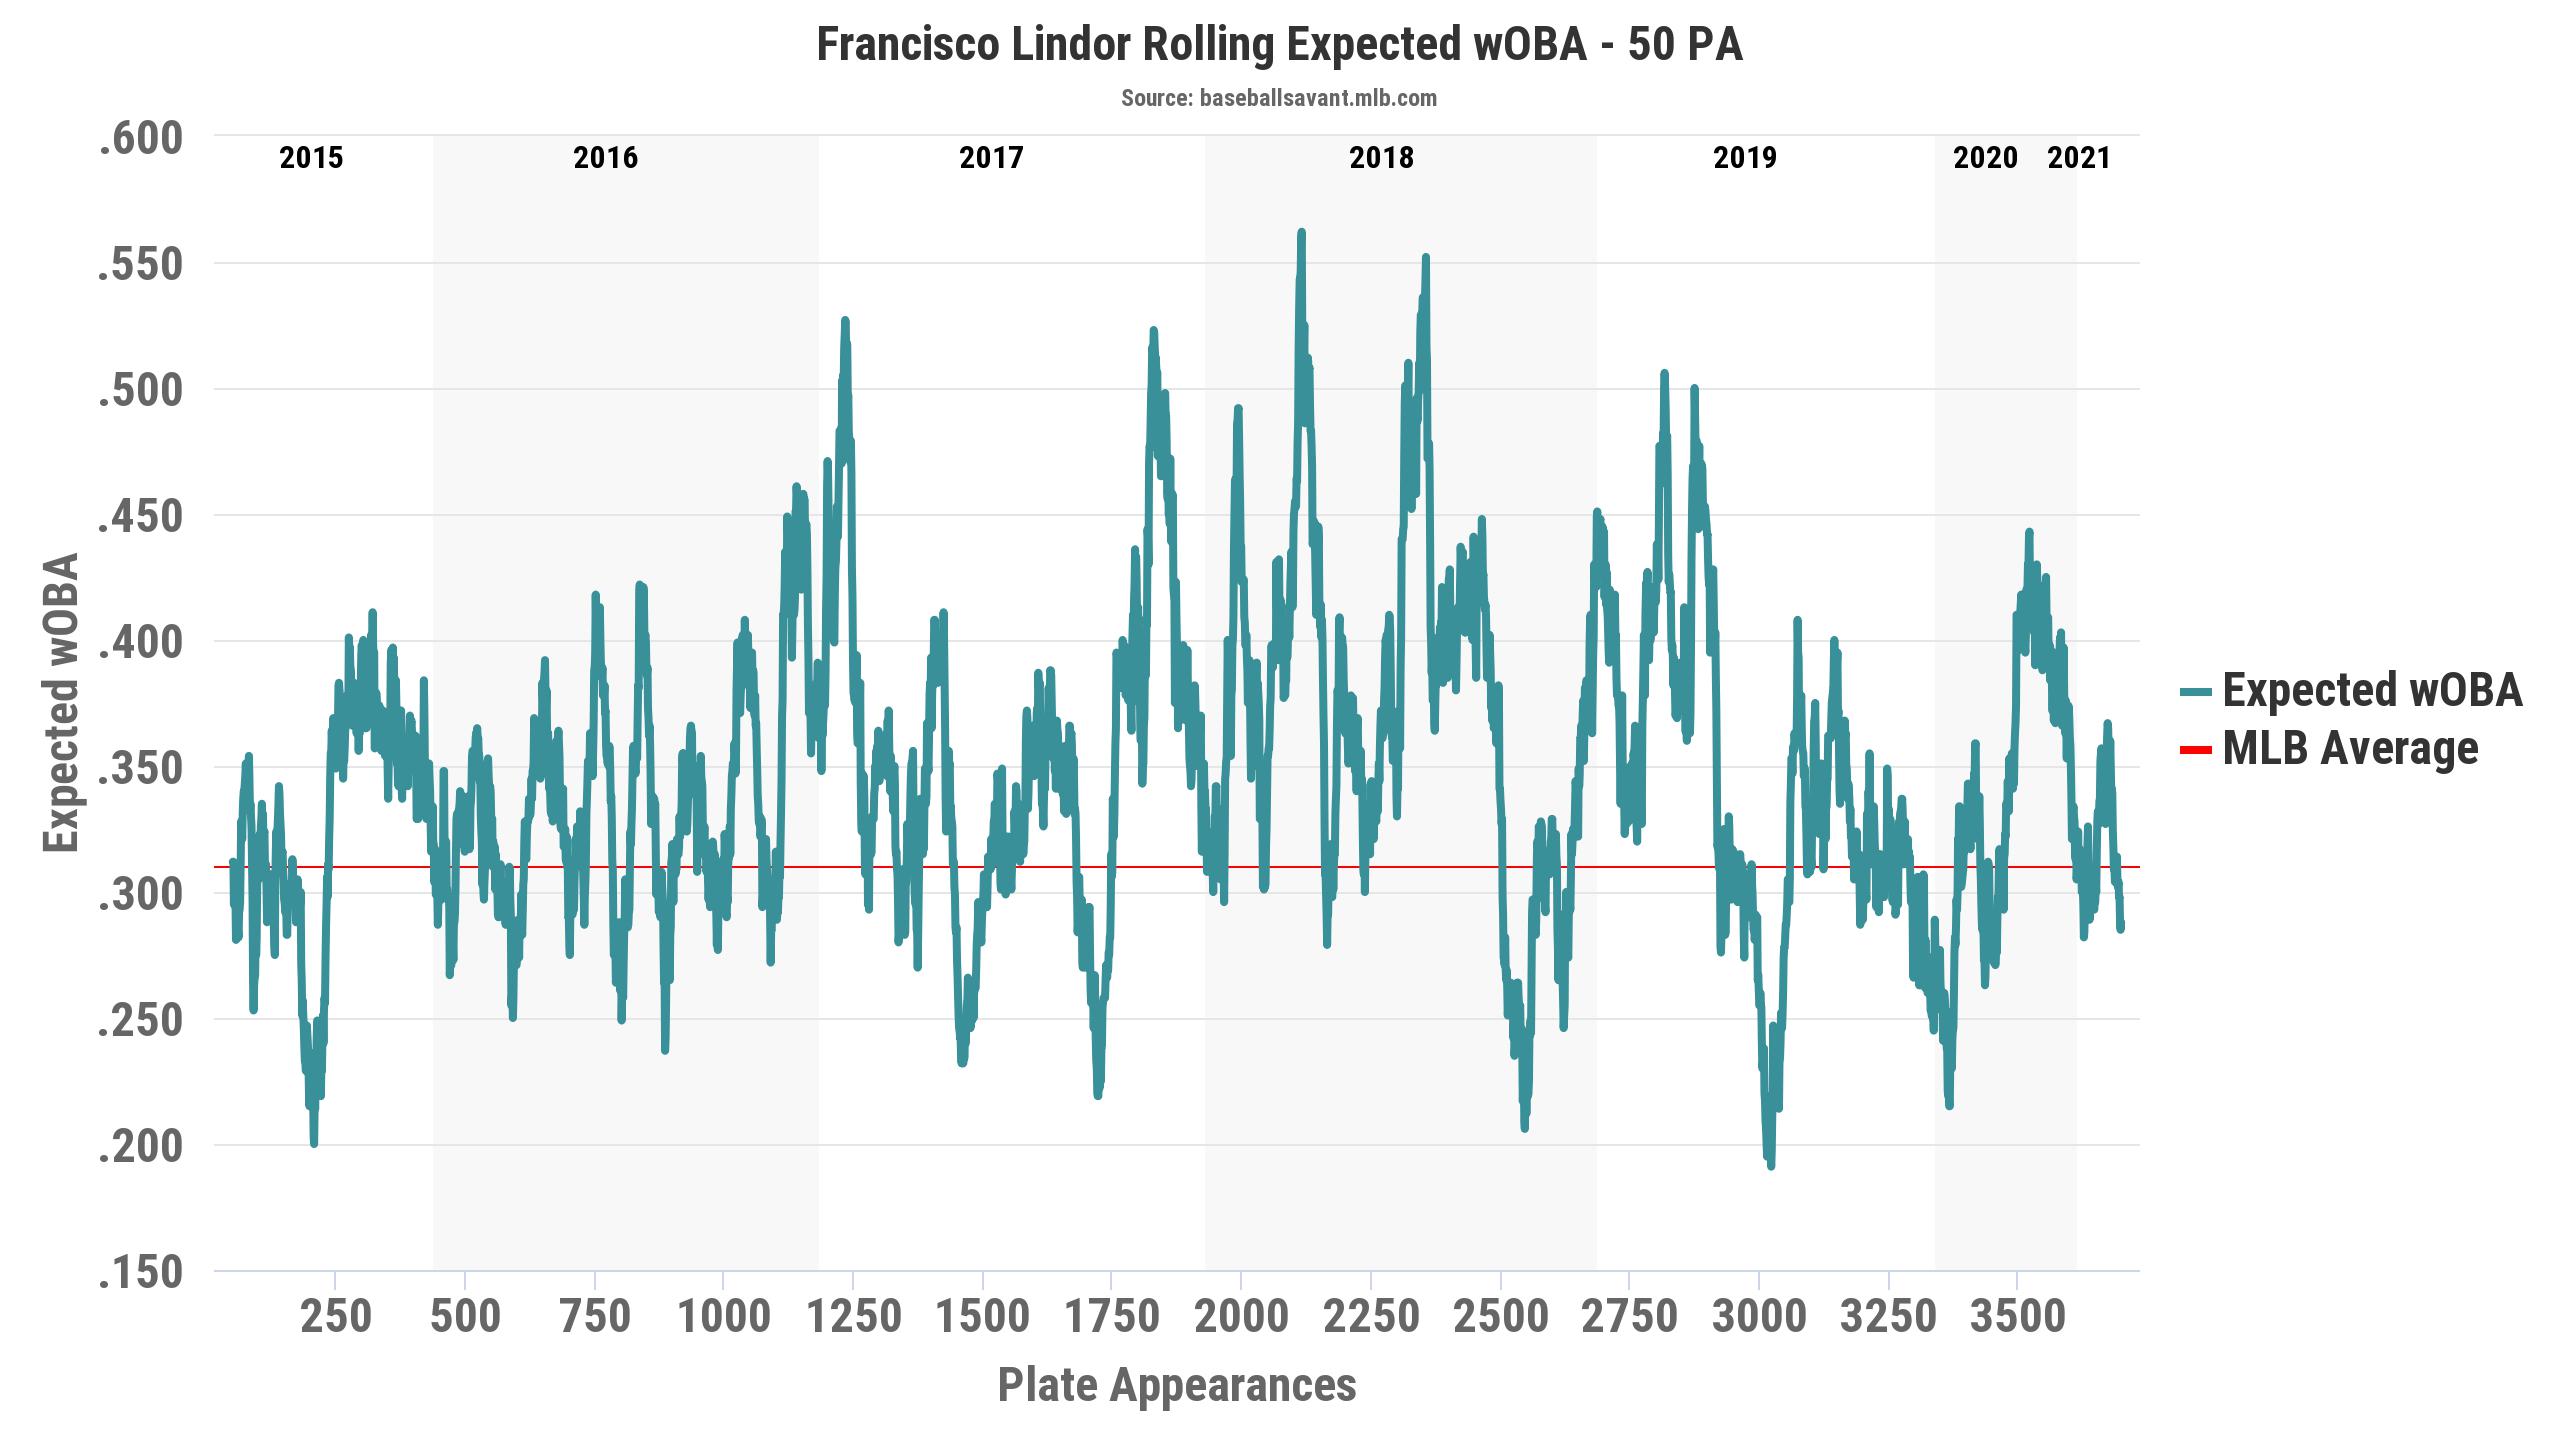
Data and visual from Baseball Savant
We’re starting to get somewhere, perhaps. There is certainly a downward trend since 2018, but 2018 stands out as a peak. 2020-21 looks quite a bit like 2016, most of 2017, and 2019 – the high isn’t as high and the low isn’t as low, but if you dropped that portion of the graph into any other, it would fit. Given how much Lindor has struggled, I expected to find a clear outlier here, with 2020-21 representing a big dip vs. the rest of the graph. But that is not what we are seeing.
What if we look at expected slugging?
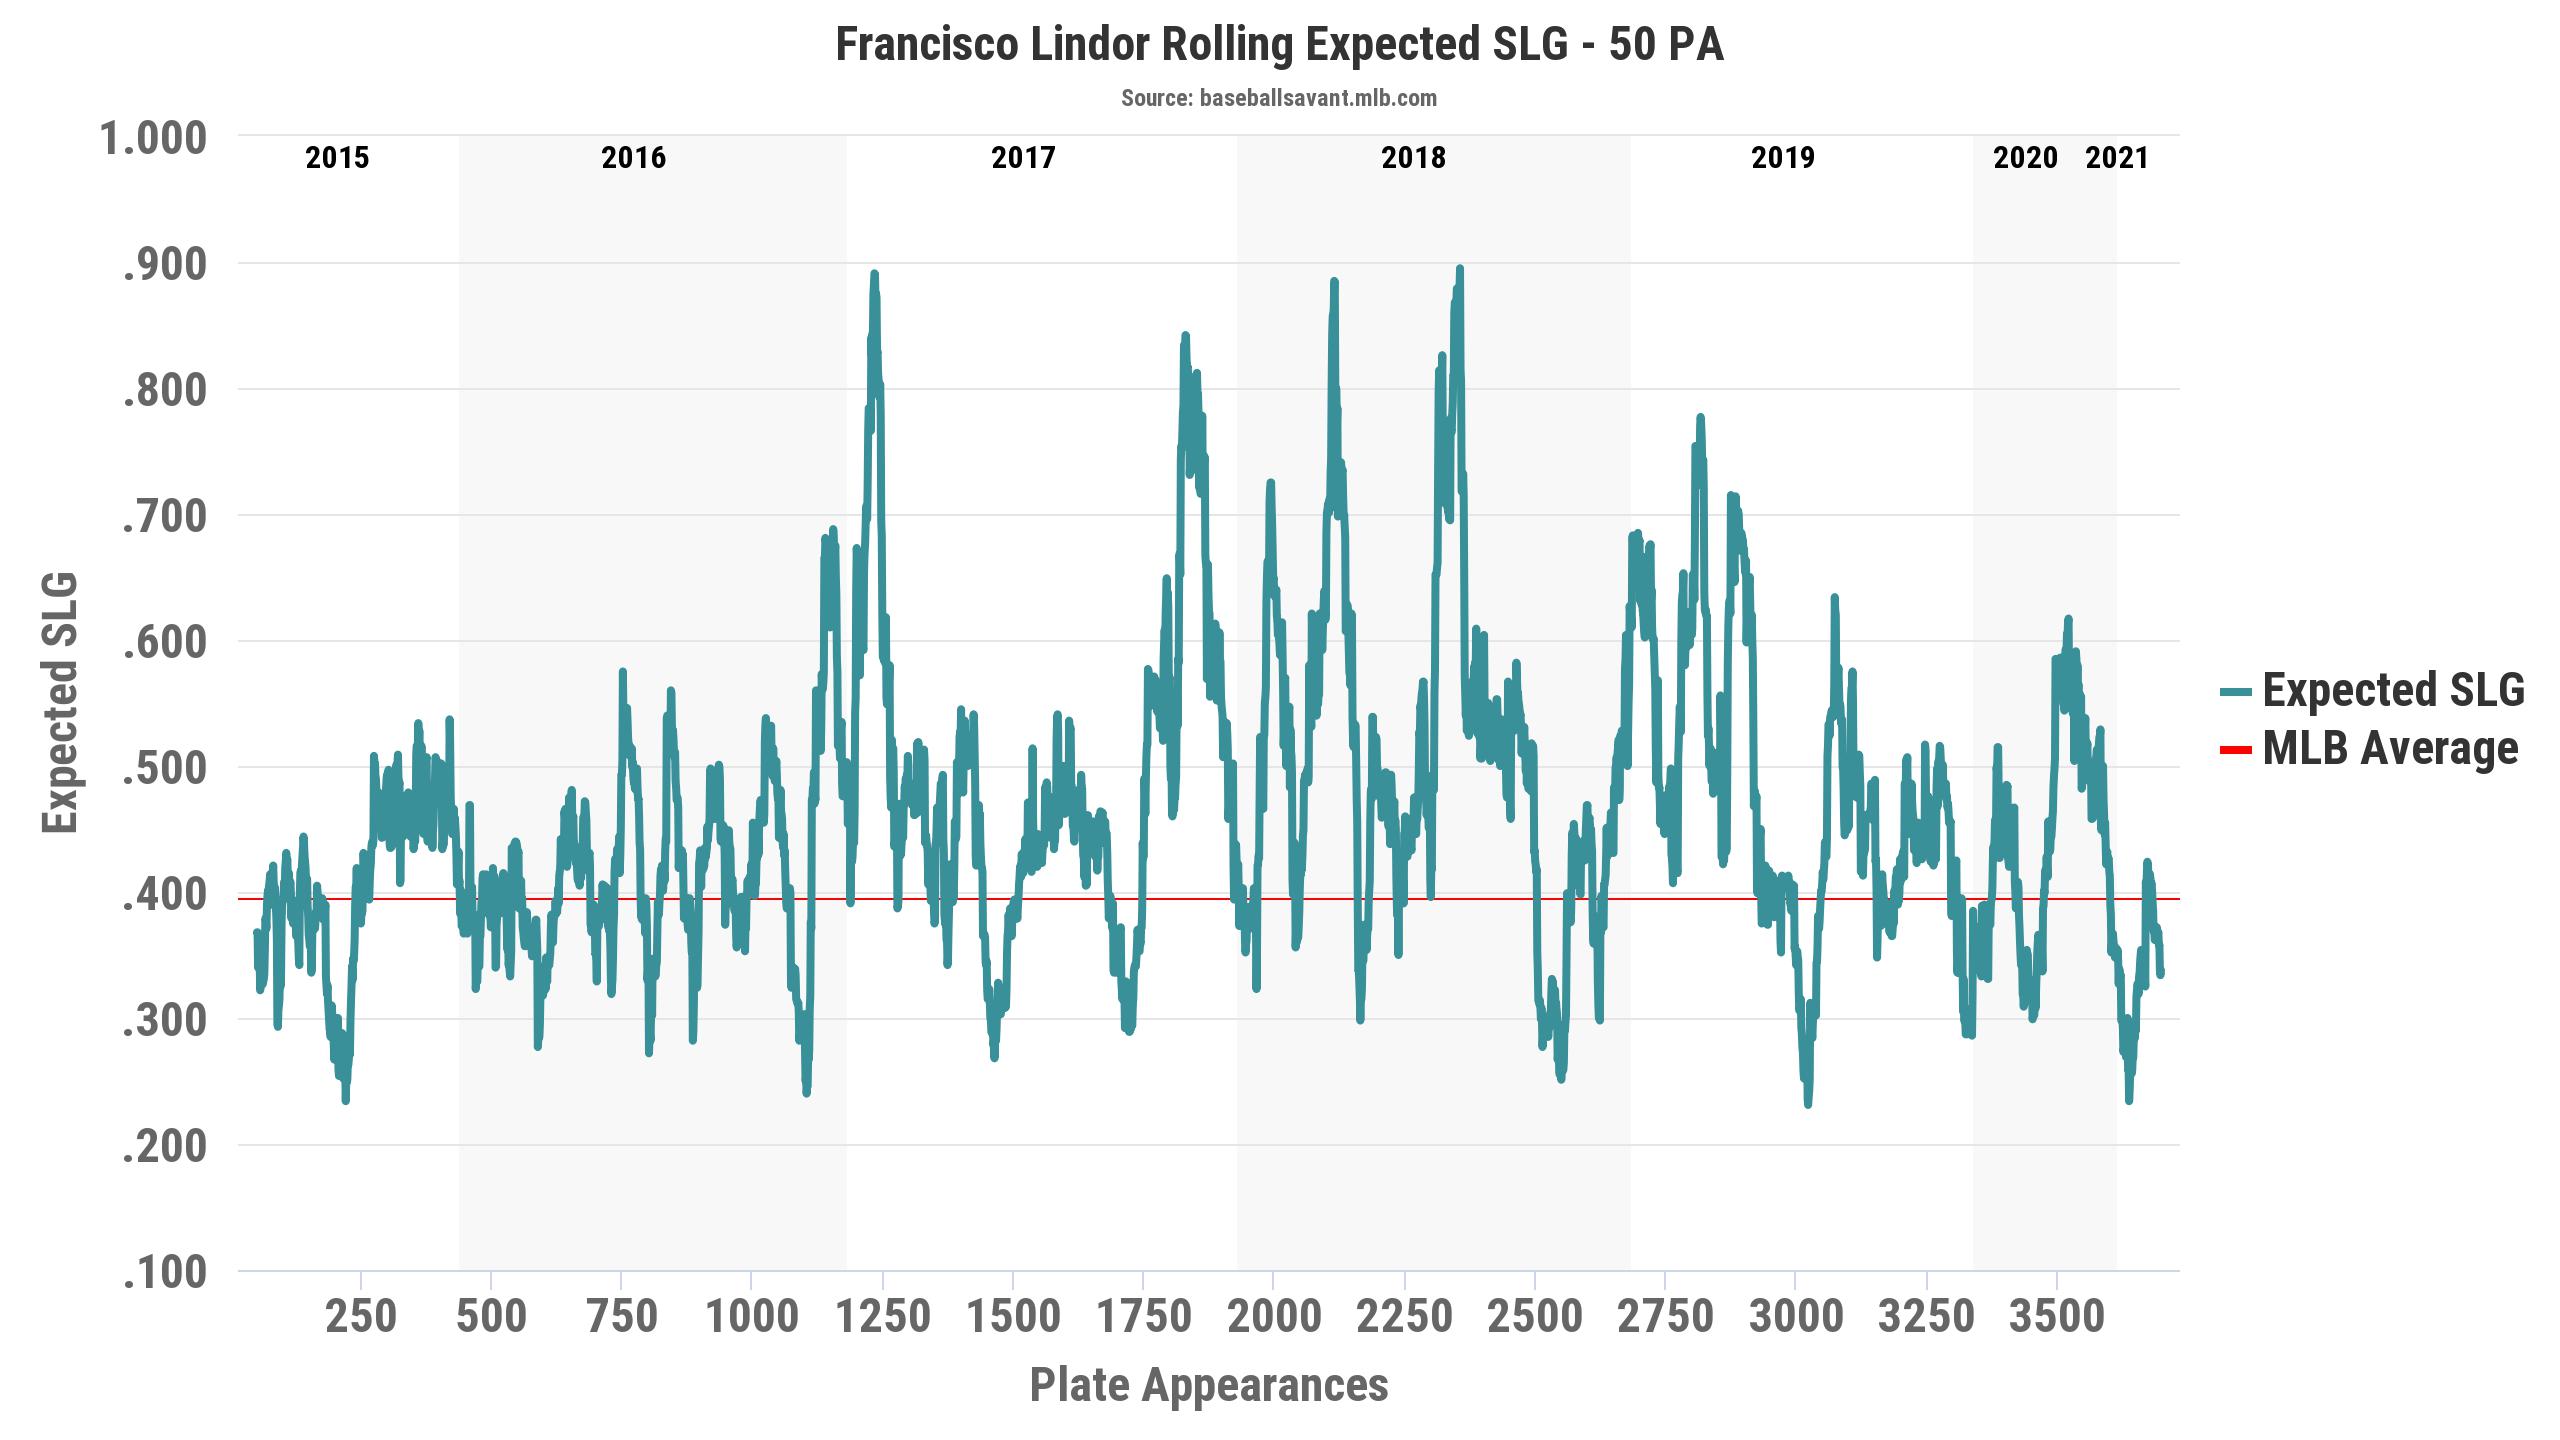
Data and visual from Baseball Savant
This comes across a little stronger than the xwOBA graph – you can see a set of peaks from 2017 through 2018 and into early 2019 that stand out. And it’s mostly what appears to be about 500 plate appearances from late 2017 to the middle of 2018, where he strung together three of those peaks in short order. Before that run, his expected slugging was much lower and after that run, it has trended back down.
We know from above that his walk rate has been increasing, and that combined with the two previous graphs gives us a bit of a clearer picture. Lindor had a power surge around the 2018 season that has not carried over, but he has increased his walk rate, allowing his xwOBA to stay in a similar range to where it was earlier in his career.
What to Expect
Lindor is definitely in a prolonged slump right now, but the good thing is his batted ball quality looks an awful lot like other stretches of his career. This dip looks worse because it happens to straddle one short season and the first month of another season – both cases where any performance, good or bad, will stand out. One more graph to illustrate this:
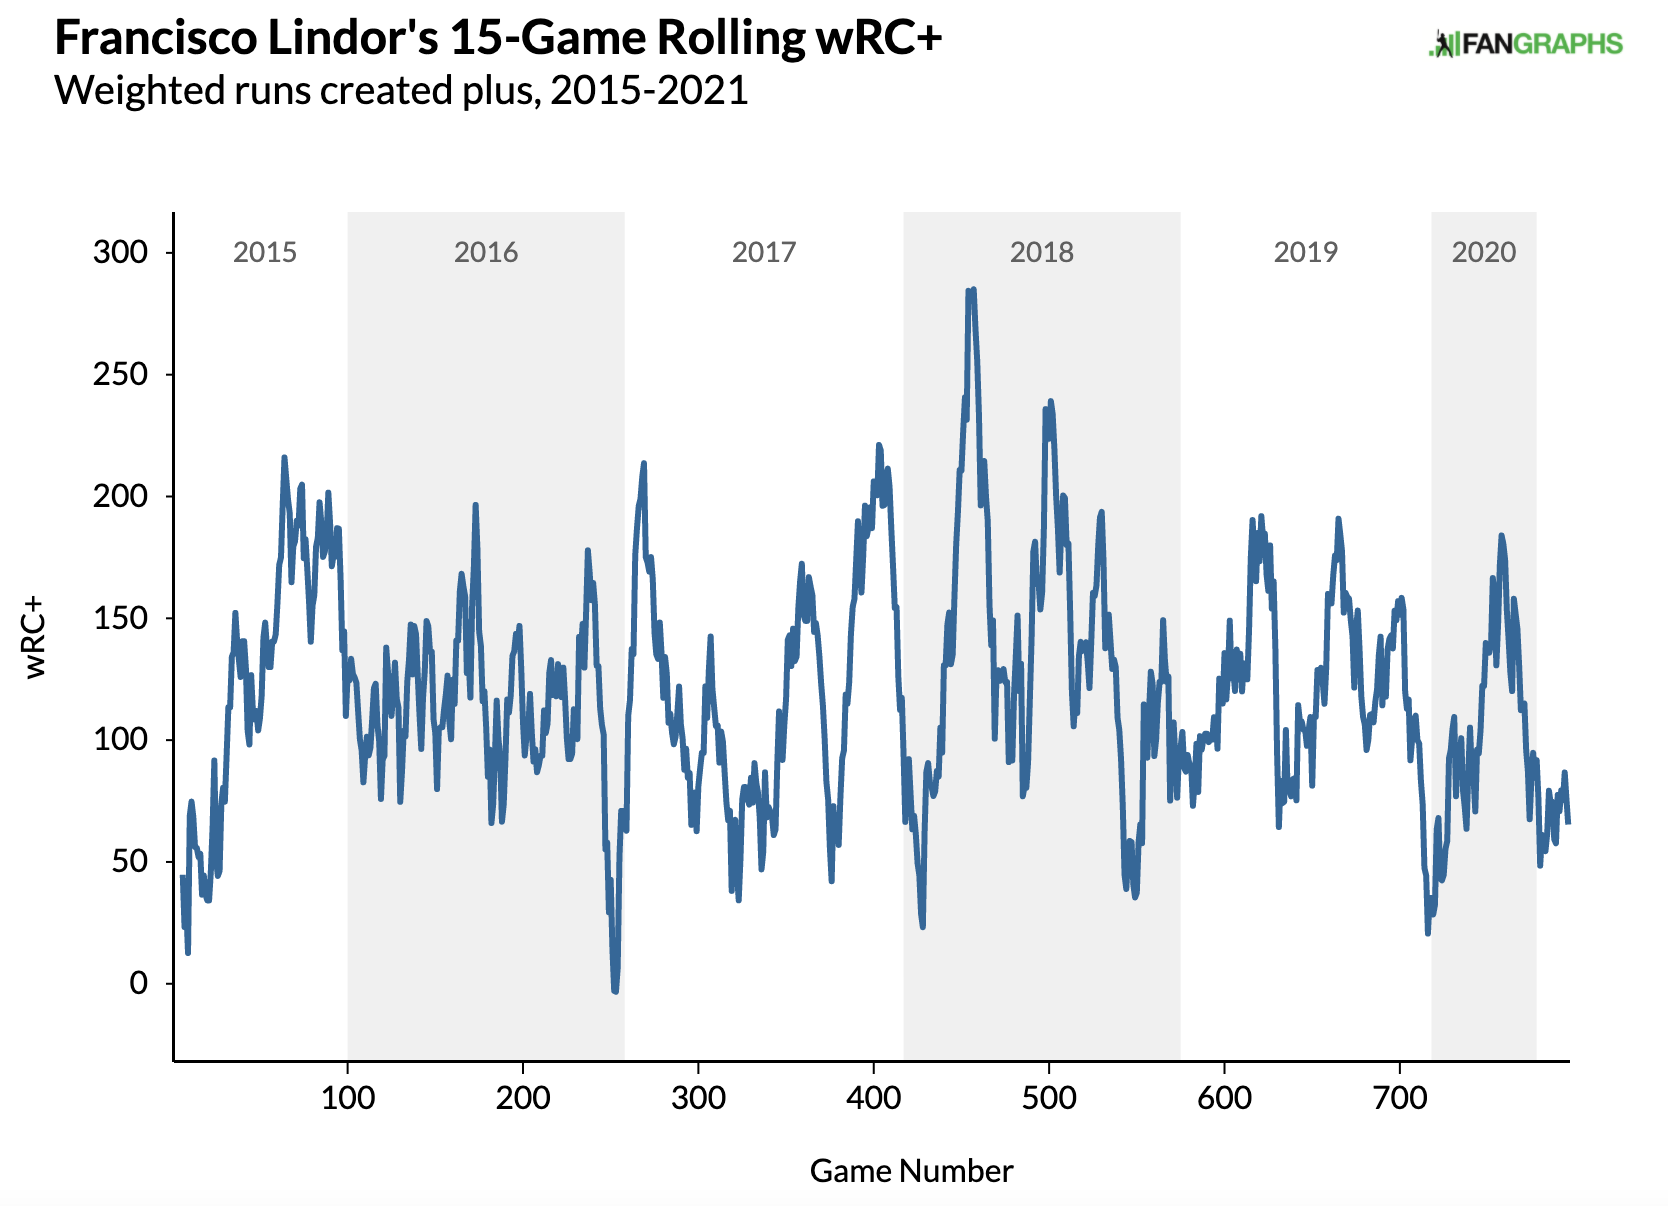
Data and visual from FanGraphs
Look at the low points in late 2019 and early 2020 – neither are as low as 15 game samples in 2016 or 2018. In fact, even if you ignore the ugly start to his career, those two drops are the 3rd and 5th worst 15 game stretches of his career. It may not seem comforting to hear, “Don’t worry, he has been this bad before” but…don’t worry, he has been this bad before.
In fact, I think there are some real positives right now. Lindor seemed to get overly aggressive in 2019 and 2020, with career-high swing and chase rates, well above where he was in his breakout 2018 season. This year he has brought those rates back down, showing a level of patience that has been missing from his game. That is leading to the increase in walks.
We noted above that over 2020-21 his contact rate suffered, but that was almost entirely in 2020 – this year his contact rates are back up, perhaps in part because he is being more patient.
His 52nd percentile hard-hit rate is exactly the same percentile as his 2017 season when he posted a 116 wRC+.
I think if he maintains the patient approach, the barrels will come, as will the hits and the HR. The BABIP will increase and the HR/FB rate will increase, as well. As that happens, his performance will improve, likely dramatically.
The caveat to this is that I think 2018 is gone forever. I don’t think what we saw that year was Lindor establishing a new baseline, but a career year. I think he is capable of hitting peaks like he did in 2018, but I don’t think it is fair to expect him to put together another season where he strings them together over and over like the did that year. His 2017 and 2019 seem like better bets for him moving forward. The return to that form is coming.
We just have to be patient and wait.
Photo By Dustin Bradford/Icon Sportswire | Adapted by Doug Carlin (@Bdougals on Twitter)
Well, maybe. But how about taking a look at Lindor’s career performance against National League clubs, which are now his primary opposition? Against NL opposition, Lindor has 520 AB, .271 BA, 18 HR, 63 RBI, 80 runs, 14 SB (small computational errors possible). These stats of course include his three peak years. Why would anyone (and by “anyone,” I mean the Mets) expect him to do any better than that going forward? And are those numbers–even assuming that Lindor can achieve them again, year after year–worth even a third of his annual salary? This has a real chance of being the worst contract in baseball history.
Is there something specific about NL opposition vs. AL opposition that you think makes these stats significant and predictive? Different than, say, odd numbered days of the month vs. even numbered days?