(Photo by Juan DeLeon/Icon Sportswire)
Welcome back, everyone. First, I’d like to give a huge shout-out to Stephen Honovich for filling in last week! Thanks again Stephen, awesome job.
Last week I was road-tripping down the California coast and I really must say….global warming is definitely real, y’all. It never used to get that hot on the coast…
Anyways, I know what you’re here for. Without further ado, here are the newly updated rankings:
| Rank |
Name |
Prev |
Change |
Score |
IP |
ERA |
PD Score |
xK% |
K% |
xK%-K% |
BB% |
xSLG |
SLG-xSLG |
| 1 |
Chris Sale |
2 |
+1 |
104.6% |
122.0 |
2.36 |
105.9% |
33.0% |
36.8% |
-3.8% |
6.3% |
0.311 |
-0.013 |
| 2 |
Jacob deGrom |
3 |
+1 |
103.1% |
115.1 |
1.79 |
104.0% |
31.3% |
31.2% |
0.1% |
6.4% |
0.319 |
-0.022 |
| 3 |
Max Scherzer |
1 |
-2 |
102.6% |
127.2 |
2.33 |
107.6% |
33.8% |
35.4% |
-1.6% |
6.4% |
0.349 |
-0.016 |
| 4 |
Trevor Bauer |
5 |
+1 |
96.7% |
129.1 |
2.30 |
92.6% |
28.2% |
31.8% |
-3.7% |
7.8% |
0.328 |
-0.028 |
| 5 |
Justin Verlander |
7 |
+2 |
96.7% |
131.2 |
2.05 |
90.6% |
26.6% |
31.6% |
-5.1% |
4.7% |
0.315 |
-0.001 |
| 6 |
Patrick Corbin |
4 |
-2 |
96.0% |
116.1 |
3.09 |
100.7% |
30.9% |
31.3% |
-0.4% |
7.3% |
0.391 |
-0.058 |
| 7 |
Charlie Morton |
6 |
-1 |
95.8% |
108.0 |
2.83 |
91.5% |
28.3% |
31.5% |
-3.3% |
9.6% |
0.332 |
-0.005 |
| 8 |
Aaron Nola |
8 |
0 |
95.1% |
123.0 |
2.27 |
87.8% |
24.9% |
26.4% |
-1.5% |
7.1% |
0.317 |
-0.034 |
| 9 |
Lance McCullers Jr. |
14 |
+5 |
93.5% |
108.1 |
3.41 |
93.6% |
28.9% |
27.1% |
1.8% |
8.7% |
0.377 |
-0.033 |
| 10 |
Blake Snell |
9 |
-1 |
93.4% |
116.0 |
2.09 |
92.3% |
29.2% |
28.8% |
0.4% |
9.6% |
0.370 |
-0.048 |
| 11 |
Gerrit Cole |
13 |
+2 |
92.5% |
122.2 |
2.57 |
92.7% |
28.7% |
35.3% |
-6.6% |
8.6% |
0.385 |
-0.066 |
| 12 |
James Paxton |
12 |
0 |
92.1% |
118.2 |
3.49 |
93.6% |
27.7% |
32.4% |
-4.8% |
6.9% |
0.396 |
-0.036 |
| 13 |
Jon Gray |
11 |
-2 |
92.0% |
92.0 |
5.77 |
91.1% |
28.8% |
28.9% |
-0.1% |
7.0% |
0.380 |
0.075 |
| 14 |
Luis Severino |
10 |
-4 |
91.1% |
123.1 |
2.12 |
90.0% |
26.1% |
29.8% |
-3.8% |
6.5% |
0.386 |
-0.091 |
| 15 |
Carlos Carrasco |
15 |
0 |
90.1% |
96.2 |
4.28 |
94.7% |
27.5% |
25.9% |
1.6% |
5.5% |
0.430 |
-0.026 |
| 16 |
Tyler Anderson |
22 |
+6 |
89.3% |
107.2 |
3.76 |
83.9% |
24.7% |
23.0% |
1.7% |
8.3% |
0.369 |
0.046 |
| 17 |
Eduardo Rodriguez |
25 |
+8 |
88.4% |
99.1 |
3.62 |
83.8% |
23.6% |
24.7% |
-1.2% |
7.5% |
0.380 |
-0.010 |
| 18 |
Kyle Gibson |
28 |
+10 |
88.2% |
107.2 |
3.59 |
86.4% |
25.3% |
23.2% |
2.1% |
10.2% |
0.400 |
-0.035 |
| 19 |
Jose Berrios |
16 |
-3 |
88.1% |
121.1 |
3.41 |
85.8% |
23.9% |
25.3% |
-1.5% |
5.4% |
0.397 |
-0.024 |
| 20 |
Tyler Skaggs |
20 |
0 |
88.0% |
92.0 |
2.64 |
85.6% |
24.5% |
26.4% |
-1.9% |
7.1% |
0.397 |
-0.029 |
| 21 |
Mike Clevinger |
23 |
+2 |
87.3% |
116.0 |
3.34 |
84.8% |
24.4% |
23.3% |
1.1% |
8.3% |
0.401 |
-0.037 |
| 22 |
Sean Newcomb |
17 |
-5 |
87.1% |
99.1 |
3.44 |
76.9% |
22.3% |
23.0% |
-0.7% |
11.8% |
0.351 |
-0.006 |
| 23 |
Alex Wood |
24 |
1 |
86.8% |
99.2 |
3.88 |
87.1% |
23.2% |
21.5% |
1.7% |
4.4% |
0.423 |
-0.030 |
| 24 |
Mike Foltynewicz |
18 |
-6 |
86.4% |
95.0 |
2.37 |
78.1% |
23.1% |
29.4% |
-6.4% |
10.3% |
0.369 |
-0.053 |
| 25 |
CC Sabathia |
19 |
-6 |
86.3% |
94.1 |
3.34 |
80.8% |
22.1% |
18.4% |
3.7% |
6.6% |
0.388 |
0.028 |
| 26 |
Luis Castillo |
26 |
0 |
86.3% |
98.1 |
5.58 |
94.9% |
29.0% |
22.0% |
7.0% |
8.2% |
0.482 |
-0.013 |
| 27 |
Corey Kluber |
27 |
0 |
86.0% |
126.1 |
2.49 |
82.2% |
22.4% |
25.6% |
-3.3% |
3.1% |
0.401 |
-0.055 |
| 28 |
Andrew Heaney |
[UR] |
[N/A] |
85.9% |
96.0 |
3.84 |
86.5% |
25.3% |
24.1% |
1.2% |
7.3% |
0.431 |
-0.040 |
| 29 |
Zack Wheeler |
31 |
+2 |
85.6% |
99.2 |
4.42 |
82.5% |
23.0% |
23.1% |
-0.2% |
8.9% |
0.408 |
-0.048 |
| 30 |
Jameson Taillon |
33 |
+3 |
85.5% |
100.0 |
4.05 |
78.7% |
21.2% |
22.2% |
-1.0% |
6.7% |
0.385 |
0.006 |
| 31 |
Matt Boyd |
[UR] |
[N/A] |
84.9% |
98.1 |
4.76 |
76.0% |
21.5% |
21.1% |
0.4% |
8.7% |
0.375 |
0.000 |
| 32 |
Dylan Bundy |
29 |
-3 |
84.6% |
99.1 |
4.08 |
93.2% |
27.0% |
26.3% |
0.7% |
7.2% |
0.493 |
-0.042 |
| 33 |
Dallas Keuchel |
39 |
+6 |
83.3% |
116.1 |
3.95 |
73.6% |
18.7% |
17.8% |
0.9% |
6.4% |
0.380 |
0.023 |
| 34 |
Zack Greinke |
35 |
+1 |
83.3% |
114.0 |
3.39 |
86.6% |
23.9% |
25.0% |
-1.2% |
4.9% |
0.467 |
-0.052 |
| 35 |
Miles Mikolas |
36 |
+1 |
83.1% |
115.1 |
2.65 |
75.1% |
17.5% |
17.6% |
-0.1% |
3.9% |
0.393 |
-0.070 |
| 36 |
J.A. Happ |
34 |
-2 |
82.9% |
105.1 |
4.44 |
76.7% |
21.3% |
26.3% |
-5.0% |
7.8% |
0.406 |
-0.018 |
| 37 |
Cole Hamels |
37 |
0 |
82.7% |
103.0 |
4.28 |
88.8% |
25.8% |
23.5% |
2.3% |
8.7% |
0.489 |
-0.019 |
| 38 |
German Marquez |
40 |
+2 |
82.7% |
97.0 |
4.92 |
74.5% |
21.3% |
23.0% |
-1.7% |
8.2% |
0.394 |
0.060 |
| 39 |
Michael Fulmer |
48 |
+9 |
82.7% |
107.1 |
4.11 |
82.0% |
22.2% |
20.4% |
1.8% |
8.1% |
0.444 |
-0.049 |
| 40 |
Zack Godley |
51 |
+11 |
82.6% |
98.1 |
4.85 |
83.0% |
25.0% |
22.3% |
2.7% |
11.5% |
0.452 |
-0.035 |
| 41 |
Julio Teheran |
54 |
+13 |
82.5% |
99.1 |
4.26 |
82.2% |
24.6% |
22.2% |
2.4% |
11.6% |
0.448 |
-0.031 |
| 42 |
Gio Gonzalez |
38 |
-4 |
82.2% |
95.2 |
3.76 |
75.7% |
21.8% |
21.5% |
0.3% |
11.2% |
0.408 |
-0.010 |
| 43 |
Kevin Gausman |
43 |
0 |
81.9% |
107.1 |
4.11 |
84.5% |
24.1% |
20.8% |
3.3% |
5.7% |
0.471 |
-0.006 |
| 44 |
Kyle Freeland |
46 |
+2 |
81.5% |
110.1 |
3.18 |
73.1% |
19.1% |
19.4% |
-0.4% |
8.2% |
0.401 |
-0.021 |
| 45 |
Tyler Mahle |
45 |
0 |
81.3% |
98.1 |
3.66 |
79.1% |
22.5% |
22.9% |
-0.5% |
9.7% |
0.444 |
-0.002 |
| 46 |
Rick Porcello |
42 |
-4 |
81.1% |
118.0 |
3.58 |
73.2% |
18.3% |
22.7% |
-4.4% |
5.4% |
0.406 |
-0.033 |
| 47 |
Marco Gonzales |
50 |
+3 |
81.1% |
106.1 |
3.64 |
78.4% |
19.8% |
21.6% |
-1.9% |
5.1% |
0.442 |
-0.038 |
| 48 |
Jake Odorizzi |
52 |
+4 |
80.9% |
96.2 |
4.28 |
81.6% |
23.4% |
24.2% |
-0.9% |
10.5% |
0.465 |
-0.008 |
| 49 |
Junior Guerra |
[UR] |
[N/A] |
80.3% |
93.2 |
2.79 |
74.2% |
20.8% |
23.5% |
-2.7% |
9.4% |
0.424 |
-0.062 |
| 50 |
Clayton Richard |
41 |
-9 |
79.9% |
118.0 |
4.50 |
74.9% |
20.3% |
17.7% |
2.6% |
8.4% |
0.434 |
-0.035 |
| 51 |
Tyson Ross |
49 |
-2 |
79.7% |
102.0 |
4.41 |
75.3% |
20.5% |
21.2% |
-0.7% |
9.2% |
0.439 |
-0.026 |
| 52 |
Jose Urena |
53 |
+1 |
79.7% |
104.2 |
4.13 |
72.9% |
18.3% |
19.9% |
-1.7% |
5.6% |
0.423 |
-0.031 |
| 53 |
Jake Arrieta |
55 |
+2 |
79.6% |
96.0 |
3.47 |
67.9% |
15.9% |
17.3% |
-1.5% |
7.5% |
0.392 |
-0.015 |
| 54 |
Jhoulys Chacin |
56 |
+2 |
78.9% |
109.2 |
3.78 |
71.5% |
20.1% |
18.4% |
1.7% |
10.1% |
0.424 |
-0.065 |
| 55 |
Luke Weaver |
59 |
+4 |
78.1% |
97.0 |
4.92 |
73.3% |
20.6% |
21.2% |
-0.7% |
8.1% |
0.447 |
-0.036 |
| 56 |
Kyle Hendricks |
68 |
+12 |
77.9% |
105.1 |
3.93 |
75.1% |
20.0% |
18.4% |
1.6% |
7.1% |
0.462 |
-0.052 |
| 57 |
Steven Matz |
58 |
+1 |
77.9% |
89.2 |
3.31 |
63.8% |
18.4% |
21.4% |
-3.0% |
9.3% |
0.387 |
0.014 |
| 58 |
Sean Manaea |
60 |
+2 |
77.3% |
117.2 |
3.44 |
77.7% |
20.1% |
17.2% |
2.9% |
4.8% |
0.488 |
-0.115 |
| 59 |
David Price |
61 |
+2 |
77.2% |
101.1 |
4.44 |
71.8% |
18.6% |
23.8% |
-5.3% |
8.0% |
0.449 |
-0.009 |
| 60 |
Jose Quintana |
62 |
+2 |
76.8% |
97.2 |
3.96 |
68.5% |
18.1% |
20.8% |
-2.7% |
10.7% |
0.433 |
-0.015 |
| 61 |
James Shields |
71 |
+10 |
76.5% |
118.2 |
4.47 |
74.8% |
20.8% |
16.9% |
3.9% |
9.0% |
0.479 |
-0.088 |
| 62 |
Derek Holland |
77 |
+15 |
76.1% |
95.0 |
4.17 |
74.4% |
21.2% |
22.6% |
-1.5% |
9.2% |
0.481 |
-0.043 |
| 63 |
Chase Anderson |
66 |
+3 |
76.1% |
99.1 |
3.81 |
71.2% |
19.0% |
19.2% |
-0.2% |
9.5% |
0.460 |
-0.067 |
| 64 |
Tanner Roark |
57 |
-7 |
75.9% |
109.1 |
4.61 |
71.3% |
18.8% |
19.8% |
-1.1% |
8.7% |
0.463 |
-0.043 |
| 65 |
Chad Bettis |
65 |
0 |
75.7% |
95.1 |
5.10 |
71.0% |
19.4% |
16.9% |
2.5% |
9.3% |
0.464 |
-0.010 |
| 66 |
Jakob Junis |
69 |
+3 |
75.6% |
101.2 |
5.13 |
75.5% |
19.8% |
20.9% |
-1.2% |
6.4% |
0.495 |
-0.008 |
| 67 |
Reynaldo Lopez |
67 |
0 |
74.6% |
105.0 |
3.77 |
67.3% |
18.4% |
16.6% |
1.8% |
10.4% |
0.454 |
-0.065 |
| 68 |
Danny Duffy |
76 |
+8 |
74.5% |
106.2 |
4.89 |
75.9% |
21.6% |
20.0% |
1.6% |
10.6% |
0.513 |
-0.066 |
| 69 |
Felix Hernandez |
70 |
+1 |
74.4% |
105.1 |
5.13 |
70.8% |
18.0% |
18.8% |
-0.8% |
7.8% |
0.480 |
-0.039 |
| 70 |
Mike Fiers |
64 |
-6 |
74.2% |
98.2 |
3.65 |
71.8% |
18.5% |
17.8% |
0.7% |
5.1% |
0.490 |
-0.035 |
| 71 |
Trevor Williams |
73 |
+2 |
73.5% |
94.0 |
4.60 |
67.0% |
16.8% |
17.3% |
-0.5% |
8.1% |
0.466 |
-0.052 |
| 72 |
Jon Lester |
75 |
+3 |
73.3% |
106.1 |
2.45 |
68.8% |
18.7% |
18.6% |
0.1% |
8.7% |
0.481 |
-0.121 |
| 73 |
Ivan Nova |
74 |
+1 |
72.3% |
98.0 |
4.50 |
74.0% |
19.4% |
18.2% |
1.2% |
4.1% |
0.529 |
-0.029 |
| 74 |
Mike Minor |
78 |
+4 |
72.2% |
96.2 |
4.56 |
75.0% |
20.3% |
19.4% |
0.8% |
5.5% |
0.537 |
-0.060 |
| 75 |
Sal Romano |
79 |
+4 |
70.3% |
102.1 |
5.28 |
64.9% |
16.2% |
16.4% |
-0.2% |
8.9% |
0.495 |
-0.020 |
| 76 |
Chris Stratton |
82 |
+6 |
70.3% |
96.2 |
4.93 |
67.8% |
17.9% |
17.6% |
0.3% |
8.7% |
0.515 |
-0.062 |
| 77 |
Ian Kennedy |
81 |
+4 |
69.9% |
94.2 |
5.13 |
69.1% |
17.4% |
20.9% |
-3.5% |
8.2% |
0.529 |
-0.044 |
| 78 |
Mike Leake |
83 |
+5 |
69.7% |
115.2 |
4.36 |
70.5% |
16.5% |
14.5% |
2.0% |
5.5% |
0.540 |
-0.083 |
| 79 |
Andrew Cashner |
86 |
+7 |
69.5% |
100.2 |
4.56 |
62.8% |
15.7% |
18.3% |
-2.6% |
9.7% |
0.492 |
-0.003 |
| 80 |
Lucas Giolito |
84 |
+4 |
68.6% |
97.0 |
6.59 |
62.9% |
17.5% |
12.9% |
4.6% |
12.9% |
0.505 |
-0.040 |
| 81 |
Jason Hammel |
80 |
-1 |
67.9% |
102.1 |
6.16 |
72.6% |
18.0% |
14.0% |
4.0% |
6.6% |
0.579 |
-0.085 |
| 82 |
Bartolo Colon |
88 |
+6 |
63.8% |
95.2 |
4.80 |
61.1% |
11.8% |
13.3% |
-1.5% |
3.8% |
0.557 |
-0.048 |
|
For Reference (content continues below):
- “PD Score” is short for plate discipline score, a combined metric of strikeout ability weighted as: 3 points O-Swing%, 3 points Contact%, 3 points SwStr%, 1 point F-Strike%.
- “Score” is a combined metric weighted equally between PD Score and xSLG.
- For both luck indication columns (xK%-K% and SLG-xSLG) positive numbers indicate bad luck so far (likely to regress positively) while negative numbers indicate good luck so far (likely to regress negatively). A higher SLG value is bad for pitchers, and I wanted it to be easy to remember: Positive Numbers = Good Outlook.
- IP, ERA, K%, BB%, and SLG are not included in the calculations, these are only included in the table for reference.
- For any newcomers, to understand the concepts behind these numbers I would recommend reading my introduction piece.
- Data is current through July 10, 2018
Two weeks ago, I wrote that the trio of Scherzer, Sale and DeGrom had clearly separated themselves from the pack, and formed their own ultra-elite tier at the top of this year’s rankings. Their places have switched around a bit within that group, with Sale currently leading. But overall that tier is still holding up, and there is still a sizable dropoff to the 4th ranked pitcher.
Otherwise in the top ten, there haven’t been many huge changes, with the exception of…
Lance McCullers Jr. (SP, Houston Astros)
McCullers was a big mover in the rankings the past two weeks, jumping a total of seven spots since my last update. His last four starts have been simply phenomenal, posting a Contact% of just 61%, and a Swinging Strike rate over 18 in those four starts. It doesn’t get a whole lot better than that. On the flip side, two of those starts were against the Royals, who as of Wednesday rate as the worst offense in MLB, so a few grains of salt are required. But dominating bad teams is exactly what good pitchers are supposed to do.
Everyone knows by now, McCullers has an amazing curveball. For his career, it’s by far his best pitch. But this year? Actually his changeup is the better-performing pitch, pretty much any way you look at it – whiff rate, wRC+ allowed, or pitch value.
Another thing you may not know about McCullers is that for his career, he has demonstrated a significant reverse platoon split, i.e. he had been better vs. lefties than righties. This year though, he has closed the gap in his platoon splits noticeably. It’s a small sample to be trusting platoon splits, but I think the success can at least partially be explained by better location on his changeup. In 2017, here were all of his changeup locations:
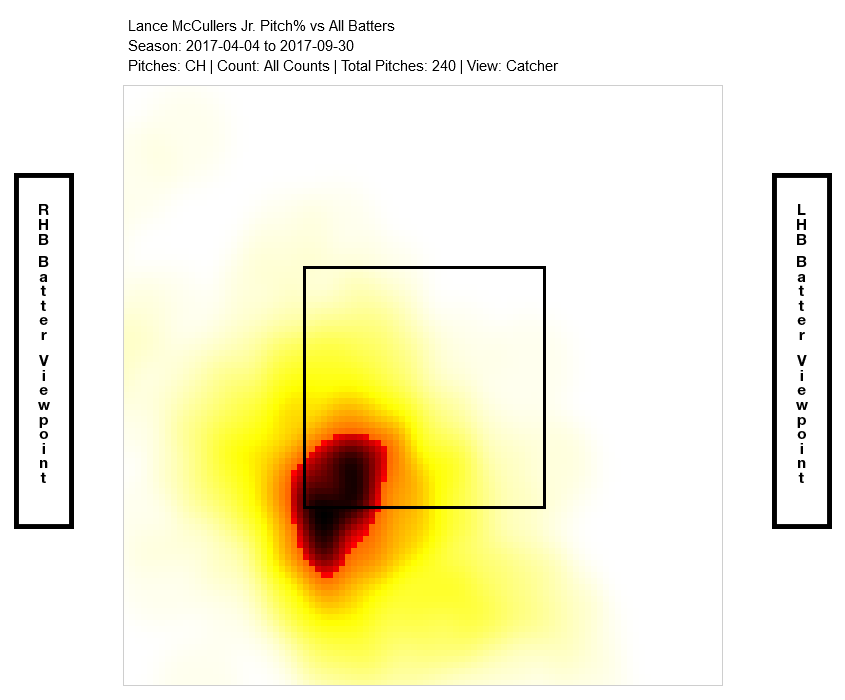
As you can see, all his changeup were basically thrown to the same location. For lefties, that would be low & away, which is perfect. But this chart includes the righties as well – and he is throwing to the exact same place for them. Low & inside is simply a more hittable location, and batters had little reason to look anyplace else. This could help explain why McCullers allowed an wRC+ of 195 on the changeup last year – it’s just too predictable being thrown in the same location every time.
Now here are his changeups this year:
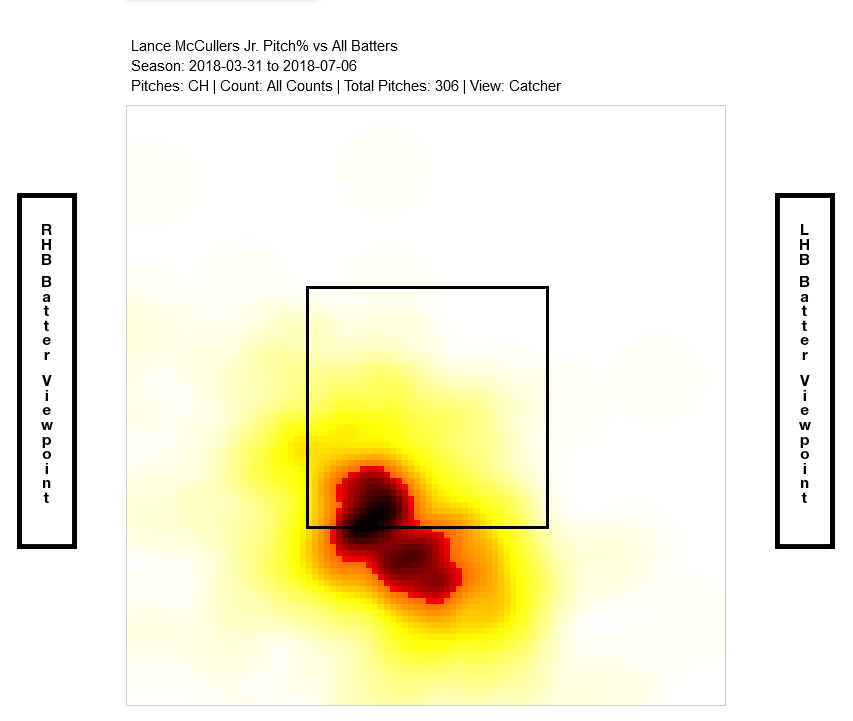
As you can see, this season his changeups are dispersed across a much wider area at the bottom of the zone, not just one corner. That indicates he’s becoming more comfortable throwing the changeup to righties, and keeping them guessing on the location much better than last year. The movement readings on his changeup are very similar to last year, so the location seems likely to be a big factor in the huge disparity between results from year to year.
Another thing you might notice is his increasing usage of that changeup. At this point in the season he’s thrown 10 fewer IP than last season, but has already thrown 66 more changeups. The emergence of his changeup as a real weapon this year, thanks to better location and increased usage, seems like the big story so far. His changeup now rates as top 5 in MLB in terms of pitch value (both overall and per 100 thrown) and is allowing an wRC+ of just nine. As always with McCullers, the talent isn’t really the question so much as his health, which always needs to be considered as part of his overall value. But it’s hard not to love how he’s pitching right now.
[Game Update] – the above was written prior to McCullers start on Wednesday. As is tradition, as soon as I start praising someone, they go and throw a clunker. Yesterday’s game was fairly bad but as long as he’s not injured or anything, it doesn’t change much. Bad starts happen.
Kyle Gibson (SP, Minnesota Twins)
Like McCullers, Gibson has shot up the rankings recently thanks in part to some weakness in his schedule. In particular, his completely dominant game vs. Baltimore on July 7th is responsible for a lot of his movement. The Orioles are currently the second worst offense in MLB, barely better than the Royals. In that game the Orioles only made contact with 55% of his pitches, which is really outstanding even against a bad team.
That all being said, Gibson has certainly been a different and much more valuable pitcher this year than previously. The past two years, his full-season ERAs were over five, so he really wasn’t on a lot of radars coming into 2018, and no one would have expected to see him on any top 20 list. He actually did pitch quite well towards the end of 2017, but those numbers disappear in his full-season line. This came as the result of some adjustments to his slider he made late in the season, which Nick covered in his Fangraphs profile for Gibson this year. This year, the slider has continued its success, with a contact rate under 50, which is really excellent. It’s also allowing an wRC+ of just 22 (compared to 98 last year). So it seems that adjustment he made to his slider late last year has definitely stuck.
This brings me to an interesting phenomenon when it comes to plate discipline metrics. In my very first piece, I looked at several pitchers entire careers trying to find guys who could consistently beat the metrics. One pattern that emerged in that exercise was the fact that the pitchers we think of having “good stuff”, like Clayton Kershaw, were the only guys who showed that ability consistently. And I think this is related to the ability to kick it up a notch when a strikeout is most needed, which is another way of saying they have a dominant “out pitch” (or several, in Kershaw’s case). Again, just a reminder for context, even Kershaw only beats the metrics by about 4-5% – that’s why I use that as the “margin of error” when talking about expected strikeout rates.
To tie this idea back to Gibson, let’s look at his career numbers:
| Season |
xK% |
K% |
xK%-K% |
| 2013 |
18.15% |
12.20% |
5.95% |
| 2014 |
18.90% |
14.10% |
4.80% |
| 2015 |
21.00% |
17.70% |
3.30% |
| 2016 |
21.25% |
15.90% |
5.35% |
| 2017 |
21.50% |
17.50% |
4.00% |
| 2018 |
25.10% |
23.20% |
1.90% |
|
In five previous seasons before he developed the slider into the weapon it is today, he under-performed his K rate every single year, often quite substantially. This year he has not only increased his actual strikeout rate by six percent, he’s also much closer to his plate-discipline-expected strikeout rate than ever before. This seems to fit the idea that possessing a bonafide out pitch can at least partially explain why some pitchers are better at beating the metrics than others.
Moving on, here are the metrics for the non-qualified SP (10 IP minimum). Scroll past the table for more analysis.
| Name |
Team |
Score |
IP |
ERA |
PD Score |
xK% |
K% |
xK%-K% |
xSLG |
SLG-xSLG |
| Matt Strahm |
Padres |
104.8% |
13.1 |
1.35 |
103.1% |
31.1% |
35.3% |
-4.2% |
0.290 |
-0.061 |
| Freddy Peralta |
Brewers |
100.3% |
33.2 |
2.14 |
95.2% |
30.4% |
36.2% |
-5.9% |
0.298 |
-0.084 |
| Noah Syndergaard |
Mets |
98.8% |
64.2 |
3.06 |
99.1% |
30.6% |
28.3% |
2.3% |
0.343 |
0.021 |
| Ryne Stanek |
Rays |
97.9% |
16.2 |
1.08 |
101.9% |
33.8% |
32.8% |
1.0% |
0.374 |
-0.216 |
| Shohei Ohtani |
Angels |
96.9% |
49.1 |
3.10 |
99.1% |
34.0% |
30.5% |
3.5% |
0.368 |
-0.048 |
| Jonathan Loaisiga |
Yankees |
95.4% |
18.0 |
3.00 |
92.0% |
26.4% |
28.4% |
-2.1% |
0.342 |
-0.009 |
| Domingo German |
Yankees |
95.3% |
59.1 |
5.46 |
100.2% |
30.9% |
26.4% |
4.5% |
0.397 |
0.066 |
| Felix Pena |
Angels |
94.9% |
19.2 |
2.75 |
95.8% |
28.6% |
30.1% |
-1.6% |
0.373 |
-0.057 |
| Yefry Ramirez |
Orioles |
93.3% |
13.1 |
5.40 |
96.4% |
30.2% |
23.0% |
7.2% |
0.399 |
0.035 |
| Kenta Maeda |
Dodgers |
93.0% |
79.2 |
3.28 |
93.4% |
28.4% |
28.6% |
-0.2% |
0.383 |
-0.020 |
| Ross Stripling |
Dodgers |
92.8% |
74.0 |
2.55 |
84.9% |
23.3% |
29.1% |
-5.9% |
0.329 |
0.070 |
| Max Fried |
Braves |
91.9% |
14.2 |
3.07 |
83.7% |
27.8% |
29.5% |
-1.8% |
0.333 |
-0.006 |
| Jack Flaherty |
Cardinals |
90.4% |
70.0 |
3.34 |
85.5% |
26.7% |
28.4% |
-1.8% |
0.364 |
0.000 |
| Masahiro Tanaka |
Yankees |
90.0% |
77.0 |
4.68 |
98.0% |
28.9% |
24.7% |
4.2% |
0.453 |
-0.005 |
| Robbie Ray |
Diamondbacks |
89.1% |
43.0 |
5.23 |
94.3% |
29.5% |
34.4% |
-4.9% |
0.440 |
0.032 |
| Trevor Cahill |
Athletics |
89.1% |
48.2 |
2.77 |
92.2% |
28.5% |
25.0% |
3.5% |
0.427 |
-0.074 |
| Carlos Martinez |
Cardinals |
89.0% |
85.2 |
3.05 |
77.2% |
21.3% |
22.0% |
-0.8% |
0.328 |
-0.022 |
| Walker Buehler |
Dodgers |
88.8% |
51.1 |
2.63 |
72.4% |
19.1% |
26.7% |
-7.6% |
0.298 |
-0.025 |
| John Gant |
Cardinals |
88.6% |
33.1 |
4.32 |
84.0% |
24.7% |
21.4% |
3.3% |
0.379 |
-0.054 |
| Vince Velasquez |
Phillies |
88.0% |
88.1 |
4.69 |
82.4% |
25.1% |
28.5% |
-3.5% |
0.376 |
0.049 |
| Joe Musgrove |
Pirates |
87.9% |
45.1 |
3.77 |
82.6% |
21.6% |
22.6% |
-1.0% |
0.378 |
0.025 |
| Jordan Montgomery |
Yankees |
87.5% |
27.1 |
3.62 |
79.9% |
21.5% |
19.8% |
1.7% |
0.366 |
-0.010 |
| Johnny Cueto |
Giants |
87.2% |
37.0 |
1.95 |
76.8% |
21.8% |
19.7% |
2.1% |
0.349 |
-0.041 |
| Hyun-Jin Ryu |
Dodgers |
87.1% |
29.2 |
2.12 |
79.3% |
24.8% |
31.3% |
-6.5% |
0.367 |
-0.059 |
| Clayton Kershaw |
Dodgers |
86.1% |
69.0 |
2.61 |
81.5% |
22.5% |
25.5% |
-3.0% |
0.396 |
-0.037 |
| Zach Eflin |
Phillies |
85.7% |
68.2 |
3.15 |
79.5% |
22.1% |
24.0% |
-1.9% |
0.387 |
-0.011 |
| Nick Pivetta |
Phillies |
85.6% |
88.2 |
4.67 |
84.9% |
24.9% |
27.4% |
-2.6% |
0.425 |
0.006 |
| Wilmer Font |
Rays |
84.5% |
21.0 |
1.71 |
70.7% |
20.5% |
22.0% |
-1.6% |
0.345 |
-0.075 |
| Garrett Richards |
Angels |
84.3% |
76.1 |
3.66 |
81.9% |
25.1% |
26.9% |
-1.8% |
0.422 |
-0.040 |
| Shane Bieber |
Indians |
84.3% |
36.1 |
3.47 |
85.3% |
24.4% |
23.1% |
1.3% |
0.445 |
0.014 |
| Mike Montgomery |
Cubs |
84.2% |
45.2 |
2.76 |
79.1% |
21.4% |
17.0% |
4.4% |
0.405 |
-0.090 |
| Austin Bibens-Dirkx |
Rangers |
84.1% |
34.0 |
3.71 |
82.2% |
21.2% |
17.9% |
3.3% |
0.427 |
-0.019 |
| Seth Lugo |
Mets |
83.9% |
23.0 |
3.52 |
77.3% |
21.6% |
26.5% |
-4.9% |
0.397 |
0.007 |
| Chris Archer |
Rays |
83.7% |
79.2 |
4.41 |
86.8% |
26.1% |
23.3% |
2.8% |
0.462 |
-0.042 |
| Stephen Strasburg |
Nationals |
83.5% |
80.2 |
3.46 |
85.1% |
24.5% |
29.1% |
-4.6% |
0.454 |
-0.055 |
| Ryan Borucki |
Blue Jays |
83.5% |
20.0 |
2.25 |
75.1% |
19.0% |
19.8% |
-0.9% |
0.388 |
-0.068 |
| Lance Lynn |
Twins |
83.4% |
86.1 |
5.21 |
77.4% |
22.2% |
21.5% |
0.6% |
0.404 |
0.003 |
| Caleb Smith |
Marlins |
83.3% |
77.1 |
4.19 |
82.9% |
24.3% |
27.0% |
-2.7% |
0.442 |
-0.054 |
| Anibal Sanchez |
Braves |
83.3% |
56.2 |
2.86 |
74.9% |
19.6% |
23.8% |
-4.2% |
0.389 |
-0.021 |
| Nathan Eovaldi |
Rays |
83.2% |
48.1 |
3.35 |
81.1% |
20.3% |
24.3% |
-4.0% |
0.432 |
-0.045 |
| Sam Gaviglio |
Blue Jays |
83.1% |
47.2 |
3.97 |
81.0% |
21.9% |
22.3% |
-0.4% |
0.432 |
0.005 |
| Madison Bumgarner |
Giants |
83.1% |
43.2 |
3.09 |
75.9% |
19.6% |
19.6% |
0.0% |
0.398 |
-0.018 |
| Nick Kingham |
Pirates |
82.9% |
44.1 |
4.26 |
86.7% |
25.6% |
22.2% |
3.4% |
0.473 |
-0.039 |
| Yu Darvish |
Cubs |
82.7% |
40.0 |
4.95 |
78.2% |
24.1% |
27.2% |
-3.2% |
0.418 |
0.007 |
| Jordan Zimmermann |
Tigers |
82.7% |
56.1 |
3.51 |
81.0% |
21.4% |
24.8% |
-3.5% |
0.437 |
-0.057 |
| Dereck Rodriguez |
Giants |
82.4% |
40.1 |
3.12 |
73.0% |
19.3% |
17.8% |
1.5% |
0.388 |
0.018 |
| Paul Blackburn |
Athletics |
81.9% |
27.2 |
7.16 |
73.5% |
18.0% |
16.0% |
2.0% |
0.398 |
0.052 |
| Brent Suter |
Brewers |
81.2% |
86.2 |
4.67 |
79.6% |
21.2% |
19.9% |
1.3% |
0.448 |
-0.009 |
| Fernando Romero |
Twins |
81.0% |
51.1 |
4.38 |
79.0% |
22.8% |
19.6% |
3.2% |
0.446 |
-0.037 |
| Sonny Gray |
Yankees |
81.0% |
84.2 |
5.85 |
76.6% |
22.2% |
20.0% |
2.2% |
0.431 |
0.017 |
| Edwin Jackson |
Athletics |
80.9% |
18.1 |
2.45 |
70.7% |
18.3% |
21.6% |
-3.3% |
0.393 |
-0.055 |
| Caleb Ferguson |
Dodgers |
80.8% |
10.2 |
7.59 |
78.9% |
26.7% |
25.0% |
1.7% |
0.449 |
-0.049 |
| Brad Keller |
Royals |
80.5% |
38.1 |
2.82 |
69.0% |
18.2% |
13.9% |
4.3% |
0.387 |
-0.096 |
| Nick Tropeano |
Angels |
79.8% |
54.0 |
4.83 |
83.7% |
25.5% |
19.6% |
5.9% |
0.494 |
-0.019 |
| Michael Soroka |
Braves |
79.8% |
25.2 |
3.51 |
78.7% |
22.0% |
18.6% |
3.4% |
0.461 |
-0.048 |
| Joey Lucchesi |
Padres |
79.7% |
63.1 |
3.27 |
75.7% |
22.7% |
25.0% |
-2.4% |
0.442 |
-0.051 |
| Marcus Stroman |
Blue Jays |
79.1% |
61.0 |
5.90 |
74.7% |
21.2% |
17.8% |
3.4% |
0.443 |
-0.032 |
| Jordan Lyles |
Padres |
78.8% |
47.0 |
4.79 |
72.6% |
17.9% |
19.9% |
-2.1% |
0.433 |
0.051 |
| Chris Bassitt |
Athletics |
78.8% |
27.0 |
3.00 |
64.2% |
14.8% |
20.0% |
-5.2% |
0.377 |
-0.078 |
| Yonny Chirinos |
Rays |
78.3% |
22.2 |
4.37 |
75.9% |
20.1% |
21.0% |
-0.9% |
0.462 |
-0.043 |
| Blaine Hardy |
Tigers |
78.1% |
43.2 |
3.71 |
70.1% |
17.1% |
16.6% |
0.5% |
0.426 |
0.005 |
| Jason Vargas |
Mets |
77.9% |
37.2 |
8.60 |
82.2% |
22.9% |
17.8% |
5.1% |
0.509 |
0.104 |
| Aaron Sanchez |
Blue Jays |
77.9% |
79.2 |
4.52 |
76.6% |
22.5% |
18.7% |
3.8% |
0.472 |
-0.085 |
| Wei-Yin Chen |
Marlins |
77.9% |
66.0 |
6.14 |
68.9% |
17.2% |
16.5% |
0.7% |
0.421 |
0.071 |
| Matt Andriese |
Rays |
77.9% |
11.1 |
3.18 |
75.0% |
19.7% |
19.2% |
0.5% |
0.462 |
-0.121 |
| Francisco Liriano |
Tigers |
77.7% |
76.0 |
4.74 |
81.6% |
24.4% |
18.7% |
5.7% |
0.508 |
-0.093 |
| Tyler Chatwood |
Cubs |
77.6% |
79.0 |
5.01 |
67.1% |
19.5% |
20.0% |
-0.5% |
0.413 |
-0.054 |
| Ryan Yarbrough |
Rays |
77.5% |
23.2 |
5.32 |
68.3% |
16.8% |
19.4% |
-2.7% |
0.422 |
-0.003 |
| Wade LeBlanc |
Mariners |
77.3% |
71.1 |
3.15 |
77.9% |
19.0% |
17.9% |
1.1% |
0.489 |
-0.088 |
| Carlos Rodon |
White Sox |
77.2% |
35.2 |
4.29 |
69.3% |
18.1% |
18.2% |
-0.1% |
0.433 |
-0.018 |
| Trevor Richards |
Marlins |
77.0% |
56.2 |
5.24 |
70.4% |
18.4% |
20.8% |
-2.5% |
0.442 |
-0.006 |
| Pablo Lopez |
Marlins |
76.6% |
17.0 |
6.35 |
85.0% |
20.6% |
19.4% |
1.2% |
0.545 |
-0.083 |
| Hector Velazquez |
Red Sox |
76.6% |
13.2 |
2.63 |
86.6% |
22.2% |
21.1% |
1.1% |
0.556 |
-0.084 |
| Jeremy Hellickson |
Nationals |
76.4% |
57.0 |
3.47 |
72.9% |
18.9% |
18.8% |
0.1% |
0.468 |
-0.059 |
| Michael Wacha |
Cardinals |
76.3% |
84.1 |
3.20 |
72.9% |
21.0% |
20.0% |
0.9% |
0.468 |
-0.124 |
| Jaime Barria |
Angels |
76.2% |
61.0 |
3.39 |
81.7% |
23.3% |
18.7% |
4.6% |
0.529 |
-0.105 |
| Marco Estrada |
Blue Jays |
75.4% |
89.2 |
4.72 |
75.8% |
20.6% |
18.6% |
2.0% |
0.500 |
-0.004 |
| Eric Lauer |
Padres |
75.2% |
75.2 |
4.40 |
67.5% |
18.0% |
18.7% |
-0.7% |
0.448 |
0.027 |
| Anthony DeSclafani |
Reds |
74.9% |
40.2 |
4.43 |
68.2% |
17.4% |
19.1% |
-1.7% |
0.456 |
0.021 |
| Clay Buchholz |
Diamondbacks |
74.9% |
38.2 |
2.56 |
74.6% |
18.9% |
20.3% |
-1.4% |
0.499 |
-0.126 |
| Andrew Suarez |
Giants |
74.8% |
84.0 |
3.75 |
66.5% |
16.2% |
22.5% |
-6.3% |
0.446 |
-0.030 |
| Luis Perdomo |
Padres |
74.4% |
26.2 |
7.09 |
64.0% |
16.9% |
14.8% |
2.1% |
0.435 |
0.047 |
| Matt Harvey |
– – – |
74.2% |
80.1 |
4.37 |
66.6% |
17.3% |
17.9% |
-0.6% |
0.455 |
-0.029 |
| Frankie Montas |
Athletics |
74.1% |
48.1 |
3.35 |
64.7% |
16.5% |
14.6% |
1.9% |
0.443 |
-0.029 |
| Matt Moore |
Rangers |
74.1% |
55.0 |
8.02 |
75.2% |
20.1% |
14.7% |
5.4% |
0.513 |
0.056 |
| Andrew Triggs |
Athletics |
73.0% |
41.1 |
5.23 |
75.9% |
21.4% |
23.6% |
-2.3% |
0.533 |
-0.120 |
| Adam Wainwright |
Cardinals |
72.9% |
18.0 |
4.00 |
55.9% |
14.0% |
17.1% |
-3.1% |
0.400 |
0.035 |
| David Hess |
Orioles |
72.7% |
47.0 |
5.94 |
69.3% |
16.7% |
12.4% |
4.3% |
0.492 |
0.016 |
| Steven Wright |
Red Sox |
72.7% |
24.0 |
4.13 |
67.0% |
19.0% |
16.8% |
2.2% |
0.478 |
-0.122 |
| Brandon McCarthy |
Braves |
72.6% |
78.2 |
4.92 |
65.9% |
15.7% |
19.2% |
-3.5% |
0.471 |
0.027 |
| Zach Davies |
Brewers |
72.3% |
43.0 |
5.23 |
69.1% |
18.7% |
16.3% |
2.4% |
0.497 |
-0.003 |
| Brandon Woodruff |
Brewers |
72.2% |
15.2 |
6.32 |
65.8% |
19.2% |
18.1% |
1.1% |
0.476 |
-0.083 |
| Drew Pomeranz |
Red Sox |
72.1% |
37.0 |
6.81 |
65.2% |
16.7% |
20.8% |
-4.2% |
0.473 |
0.070 |
| Dylan Covey |
White Sox |
72.1% |
55.1 |
5.69 |
63.4% |
16.2% |
16.9% |
-0.7% |
0.462 |
-0.056 |
| Dan Straily |
Marlins |
71.6% |
65.1 |
4.55 |
74.9% |
21.3% |
18.7% |
2.6% |
0.544 |
-0.105 |
| Jeff Samardzija |
Giants |
71.0% |
40.2 |
6.42 |
69.2% |
18.0% |
15.3% |
2.7% |
0.514 |
-0.079 |
| Jaime Garcia |
Blue Jays |
71.0% |
61.1 |
6.16 |
68.1% |
19.0% |
19.9% |
-1.0% |
0.508 |
0.004 |
| Ty Blach |
Giants |
70.9% |
60.2 |
4.90 |
60.7% |
14.7% |
11.1% |
3.6% |
0.460 |
-0.047 |
| Rich Hill |
Dodgers |
70.7% |
54.1 |
4.64 |
68.9% |
17.4% |
24.4% |
-7.1% |
0.517 |
-0.045 |
| Jake Faria |
Rays |
70.4% |
47.2 |
5.48 |
68.1% |
19.0% |
18.2% |
0.7% |
0.516 |
-0.093 |
| Dillon Peters |
Marlins |
70.0% |
24.2 |
5.84 |
62.0% |
16.3% |
14.4% |
1.9% |
0.480 |
-0.011 |
| Jefry Rodriguez |
Nationals |
69.7% |
14.0 |
9.64 |
77.6% |
20.0% |
18.8% |
1.2% |
0.588 |
0.055 |
| Elieser Hernandez |
Marlins |
69.6% |
22.0 |
4.50 |
71.6% |
21.2% |
18.7% |
2.5% |
0.549 |
0.011 |
| Corey Oswalt |
Mets |
69.6% |
12.2 |
7.82 |
64.0% |
13.5% |
18.2% |
-4.8% |
0.499 |
-0.030 |
| Chad Kuhl |
Pirates |
69.0% |
85.0 |
4.55 |
69.8% |
20.5% |
21.7% |
-1.2% |
0.546 |
-0.083 |
| Eric Skoglund |
Royals |
68.8% |
49.2 |
6.70 |
70.3% |
17.3% |
18.0% |
-0.7% |
0.551 |
-0.021 |
| Daniel Mengden |
Athletics |
68.8% |
90.2 |
4.47 |
68.5% |
16.7% |
14.5% |
2.2% |
0.540 |
-0.097 |
| Alex Cobb |
Orioles |
68.7% |
86.1 |
6.67 |
64.9% |
15.5% |
15.2% |
0.3% |
0.516 |
0.036 |
| Matt Wisler |
Braves |
68.7% |
17.1 |
3.63 |
73.6% |
20.7% |
18.6% |
2.1% |
0.575 |
-0.160 |
| Adam Plutko |
Indians |
68.2% |
34.2 |
4.67 |
71.6% |
17.3% |
16.9% |
0.4% |
0.568 |
-0.034 |
| Brandon Finnegan |
Reds |
68.0% |
20.2 |
7.40 |
63.0% |
16.0% |
13.6% |
2.4% |
0.513 |
0.040 |
| Yovani Gallardo |
Rangers |
67.9% |
28.0 |
6.75 |
59.7% |
13.2% |
15.0% |
-1.8% |
0.493 |
-0.011 |
| Erick Fedde |
Nationals |
67.4% |
28.0 |
5.79 |
68.7% |
17.9% |
15.7% |
2.2% |
0.559 |
-0.009 |
| Ben Lively |
Phillies |
67.2% |
23.2 |
6.85 |
62.8% |
17.9% |
19.1% |
-1.3% |
0.522 |
0.023 |
| Kendall Graveman |
Athletics |
67.0% |
34.1 |
7.60 |
67.6% |
17.1% |
17.1% |
0.0% |
0.557 |
-0.015 |
| John Lamb |
Angels |
66.7% |
10.0 |
7.20 |
72.3% |
17.8% |
22.0% |
-4.3% |
0.593 |
0.124 |
| Doug Fister |
Rangers |
66.4% |
66.0 |
4.50 |
55.9% |
11.8% |
13.8% |
-2.0% |
0.487 |
-0.031 |
| Brian Johnson |
Red Sox |
66.0% |
14.2 |
2.45 |
53.4% |
11.7% |
14.1% |
-2.4% |
0.476 |
-0.069 |
| Brett Anderson |
Athletics |
66.0% |
20.1 |
5.75 |
63.5% |
16.4% |
11.8% |
4.6% |
0.544 |
-0.038 |
| Shelby Miller |
Diamondbacks |
65.3% |
14.0 |
9.00 |
67.5% |
17.6% |
26.9% |
-9.3% |
0.579 |
0.044 |
| Antonio Senzatela |
Rockies |
65.2% |
13.0 |
4.15 |
58.2% |
13.9% |
11.8% |
2.1% |
0.519 |
-0.215 |
| Daniel Gossett |
Athletics |
64.9% |
24.1 |
5.18 |
66.2% |
15.5% |
11.8% |
3.7% |
0.576 |
-0.081 |
| Joe Biagini |
Blue Jays |
64.9% |
18.2 |
7.71 |
65.9% |
16.7% |
14.4% |
2.3% |
0.574 |
-0.080 |
| Steven Brault |
Pirates |
63.8% |
26.0 |
5.54 |
69.2% |
20.0% |
13.4% |
6.6% |
0.611 |
-0.213 |
| Taijuan Walker |
Diamondbacks |
62.7% |
13.0 |
3.46 |
57.6% |
15.1% |
16.1% |
-1.1% |
0.548 |
-0.156 |
| Homer Bailey |
Reds |
62.1% |
62.0 |
6.68 |
64.2% |
15.8% |
13.0% |
2.8% |
0.600 |
-0.036 |
| Hector Santiago |
White Sox |
61.1% |
32.1 |
6.12 |
62.0% |
16.5% |
15.9% |
0.6% |
0.598 |
-0.027 |
| Jarlin Garcia |
Marlins |
61.0% |
33.0 |
3.55 |
65.1% |
18.0% |
16.7% |
1.3% |
0.620 |
-0.222 |
| Bryan Mitchell |
Padres |
59.3% |
32.0 |
6.47 |
47.1% |
11.8% |
10.4% |
1.4% |
0.523 |
-0.027 |
| Ryan Carpenter |
Tigers |
57.4% |
12.0 |
6.75 |
58.5% |
14.9% |
10.7% |
4.2% |
0.624 |
-0.047 |
| Matt Koch |
Diamondbacks |
56.9% |
69.2 |
4.52 |
60.7% |
13.5% |
12.1% |
1.4% |
0.646 |
-0.140 |
| Miguel Gonzalez |
White Sox |
56.8% |
12.1 |
12.41 |
66.3% |
15.5% |
7.6% |
7.9% |
0.684 |
0.099 |
| Josh Tomlin |
Indians |
55.9% |
30.0 |
8.10 |
73.8% |
19.1% |
12.9% |
6.2% |
0.746 |
-0.019 |
| Martin Perez |
Rangers |
55.1% |
22.1 |
9.67 |
51.8% |
11.6% |
10.9% |
0.6% |
0.610 |
0.060 |
| Carson Fulmer |
White Sox |
55.0% |
31.0 |
8.13 |
56.5% |
14.6% |
16.6% |
-2.1% |
0.643 |
-0.139 |
| Chris Tillman |
Orioles |
51.6% |
26.2 |
10.46 |
49.4% |
11.9% |
9.5% |
2.4% |
0.641 |
0.011 |
|
Matt Strahm (P, San Diego Padres)
Strahm has been high on this list ever since I started splitting out the non-qualified SP to a separate table, but I have been hesitant to write about him so far. The reason for his high ranking is due to his small sample size and peculiar role. Basically he is a reliever, but has “opened” a handful of starts, which is a new phenomenon in MLB this year. For the uninitiated, an “opener” is a reliever who pitches the first couple innings of the game, typically in lieu of a 5th starter. Technically that still counts as “starting” those games, even if he only pitches 2-3 innings. Strahm has also changed roles a couple times, bouncing back between opening and a more typical middle relief role. He’s pitched over 30 innings total, but only 13 as a “starter”. The table above only includes his innings as a starter, but over his complete body of work, he grades out much, much lower. For whatever reason he has been much more effective in that “opener” role (FIP as a reliever = 5). So that is certainly one reason to pump the brakes a bit upon seeing that score of 104.
Even if we were to discard his work as a reliever and focus on those 13 starting innings (which we shouldn’t) I still wonder how the “opener” role affects the mindset of a pitcher compared to a regular starter. If a guy in this role knows he only has to pitch a couple innings, are they still in the reliever mindset of throwing the ball as hard as possible? A score of 104 for a reliever wouldn’t be that special, because relievers just have better strikeout stuff thanks to their limited workload (I adjust the score thresholds for relievers by 10 points). So it’s likely that if the Padres did decide to stretch him out and make him a full starter, those numbers wouldn’t translate directly; we wouldn’t expect him to continue pitching that well.
Secondly, the whole “opener” thing just seems to be bad for fantasy baseball. Being guaranteed to pitch less than five innings means wins and quality starts are impossible, and these are still very important in fantasy. This is even worse than a middle reliever – at least those guys have a chance at nabbing a win or save here or there. Really all he can do for your team is help with ratios and strikeouts. On the “bright” side the last time he opened was a couple weeks ago now, having moved back to a normal bullpen role. In either role, he’s probably not someone you want on your fantasy team, despite the high score here.
Note – basically the same logic applies to Ryne Stanek, who has taken the “opener” role from Sergio Romo in Tampa.
Freddy Peralta (SP, Milwaukee Brewers)
Here is a bit more straightforward one. Peralta has worked his way to the top of the non-qualified rankings in more typical fashion; there are no role shenanigans here. Peralta is a 22-year-old Rookie who has pitched six starts in the data, plus one Wednesday that was not included. There are is a lot to like in the data for those six starts. For one, he has consistently missed bats. Even the worst of those six starts was above average in that regard, and his PD metrics look fantastic overall. Yes, he is over-performing his K rate a bit, but even if that were to drop the full amount, 30% would still be excellent. He has also done very well in managing contact – his xSLG near .300 is in the neighborhood of the league leaders.
There is unfortunately one big problem with Freddy Peralta, and that is right now he seems like a two pitch guy. He basically uses his fastball 80 percent of the time, with the curveball making up the other 20%. He does technically have a changeup, but only throws it 3% of the time, which doesn’t really count. Two-pitch guys tend to have bad platoon splits, and hence can be a dicey proposition for starting pitchers. It’s not uncommon for these guys to end up in the bullpen. Even with his dominant numbers so far, he does show those concerning platoon splits. His FIP against lefties is three times higher than against righties (3 vs 1). He’s also managed to put up a .215 BABIP so far, which has to regress. Going forward I see him as a great streamer pick vs. right-handed lineups, but likely not much more than that.
[Game Update] The above was written prior to Wednesday’s game. Yesterday he was knocked around a bit by the Marlins, including giving up a HR to a lefty, while failing to miss bats at all compared to the previous six starts. It looks like the shine is starting to wear off already.
Clayton Kershaw (SP, Los Angeles Dodgers)
This is looking like the year where Kershaw finally gives up his mantle as the best pitcher on the planet. At least, if he keeps pitching like he has so far, he won’t be anywhere near the league leaders at the end of the season. Part of it could certainly be the injuries he’s dealt with – his velocity right now is the worst in his career. He’s been able to hold things together somehow, posting an ERA of just 2.6. But as a Kershaw owner myself, I am very concerned. His plate discipline metrics are way, way down. For the past four years, his swinging strike rate has never dipped below 14%. This year it is just 10.9%, hardly even above average. His contact management hasn’t been elite either – the xSLG mark of .400 is only a bit above average as well. Basically he has not been Clayton Kershaw this year.
Of course it’s very possible that he recovers from his injuries and he starts pitching like Clayton Kershaw again. But I’m not super hopeful at the moment. Since he returned from injury, he’s compiled four starts and they just aren’t very encouraging. They were against fairly weak teams (3 of the 4) but he didn’t dominate those bad teams at all. Some of the lines he produced were good, but even against the Padres he only managed a swinging strike rate of 9%.
On the flip side, he is Clayton Kershaw. If anyone is capable of turning things around, it’s him. I absolutely wouldn’t write him off yet. But there’s no denying I see a selling opportunity here, if any of your league-mates assume he is 100% based on that ERA.


Oh, sweet Mother Mary. Now I’m supposed to pick Luis Castillo back off the waiver wire??!! Is he good or is he not good??!!!
那噶事是否为