


When I first introduced the stat “Wins Below Replacement Ownership,” I only considered ownership performance from the year 2000 through 2019. If you aren’t familiar, WBRO measures how many wins a team’s ownership refrained from purchasing in a given season. The calculation (described here) is based on payroll as a percentage of revenue and $/WAR. All of the data can be found in this publicly viewable Google sheet. You can also hear more about the stat in my appearance on the podcast Effectively Wild. In this article, I’ll look at the 2020 and 2021 seasons. I’ll explain how I approached analyzing the shortened 2020 season and I’ll offer some thoughts about how the stat could be improved with future updates.
League-wide Trends
Before turning to WBRO, let’s take a look at how 2020 and 2021 compare with league-wide trends over the past two decades. Below are two graphs that showcase the relationship of league-average payroll and revenue over the years. The first shows each figure individually on rolling chart, while the second displays payroll as a percentage of revenue. Together, they paint a simple picture. League spending has not kept pace with league revenues.
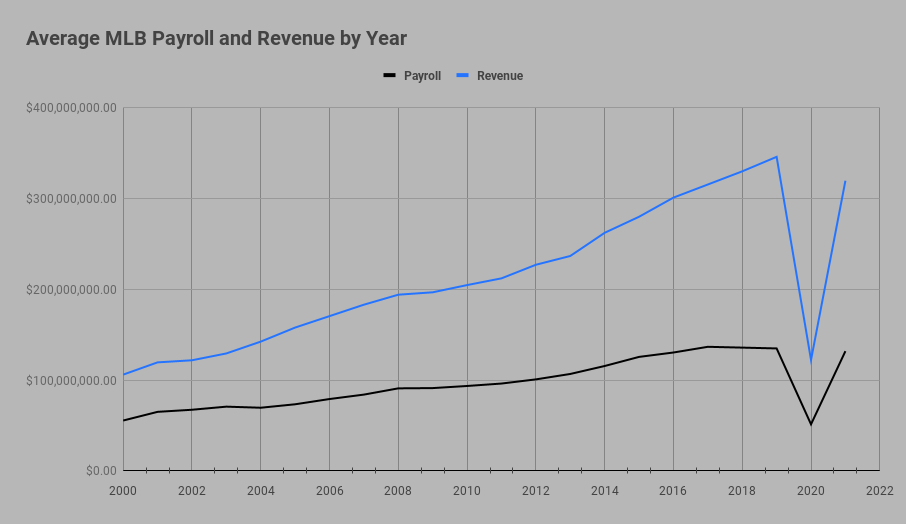
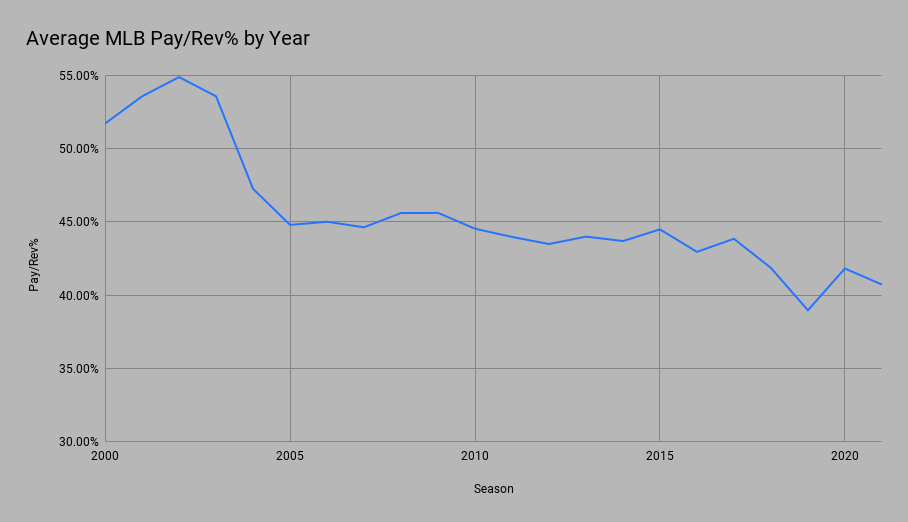
As you can see from the above, the first two pandemic seasons caused a bit of a hiccup in what has been a multiple-decades-long decline in relative spending. Crucially, though, this hiccup largely reflects a decline in revenue. Even though the 2021 season was 162 games, baseball did not reach 2019 revenue levels. The minor bump we’ve seen in Pay/Rev% is likely due to the fact that teams continue to pay guaranteed contracts that were signed before the decline. As I’ll discuss further down, free agent demand in 2021 was markedly lower than anything we’ve seen in the past decades.
The Shortened 2020 Season
By now, most fans are very familiar with the problems that a 60-game season poses for statistical analysis. Simply put, baseball requires a much bigger sample size. Calculating WBRO for 2020 poses a different set of challenges. While estimates reflect the effects of empty seats and fewer games on revenues, most payroll estimates are built on figures taken from guaranteed player contracts. This can give the impression that every single MLB team operated at a loss of tens of millions of dollars in 2020. The reality is, though, that Major League Baseball contracts include financial safeguards. In other words, the shortened season significantly decreased player salaries, even for otherwise guaranteed contracts. In fact, the MLBPA filed a grievance arguing that in 2020, MLB negotiated the start of the season in bad faith. That grievance has been dropped, but the $500 million initially sought by the MLBPA illustrates the shortened season’s impact salaries.
Luckily, the precise impact is well-documented. In 2020, players received 37% of their annual salaries. That number reflects the percentage of games played in the 2020 season. So, when we input payroll into the WBRO formula for 2020, we will have to adjust estimated payrolls accordingly.
The other major factor to consider is the shortened season’s impact on $/WAR. Fortunately, this problem takes care of itself. Most team salaries were largely set before March of 2020. Since WAR is a cumulative statistic, the number of wins purchased by dollar will remain constant. If, for example, $9.5 million purchased 1 WAR over a 162 game season, $3.5 million would purchase about .37 WAR over 60 games.
With these adjustments in view, we can calculate WBRO for 2020. Here are the results:
As you can see here, the numbers for 2020 are significantly lower than in previous seasons. Whereas the 2019 average WBRO was -3.3, the average for the 2020 season was just -1.2. This makes sense, since the number of wins available on the market was significantly decreased.
The 2021 Season
The 2021 season is far more straightforward. The formula is exactly the same as years 2000-2019. The biggest noteworthy change, though, is the manner in which the market was impacted after the shortened season. In short, MLB teams were far less aggressive in free agency after losing revenue over the previous year. With decreased demand, the $/WAR figure dropped to ~$5.5 million, down from ~$9.5 million the year before. The league hasn’t seen prices that low since 2009, when $1 was worth about $1.34 today. Adjusted for inflation, these prices actually sit around where they did in 2001 when the average annual team payroll was just $65 million.
This decrease in $/WAR is reflected in WBRO. In general, decreased demand lowers the prices on player contracts. This, in turn, increases the number of wins a team could have purchased in a given free agent class. While this may seem counterintuitive, the math is relatively straightforward. The converse is true in years where demand is high. To the degree that teams are more aggressive on the market, $/WAR increases and WBRO decreases.
For 2021, our WBRO formula gives us the following results:
The results for 2021 are just as extreme as those of 2020, except in the opposite direction. While in 2020 fewer wins were available for purchase, in 2021 a win could be purchased at a fraction of the regular cost.
Only a few teams took advantage of the changing market. All three teams made significant free agent acquisitions and either signed significant extensions or re-signed star players. They were also active at the trade deadline. As a result, the Padres, Phillies, and Mets had 1.7, 1.3, and 1.5 WBRO respectively. Most remarkably, though, none of these teams made the playoffs. Perhaps this is a testament to the fact that money spent is not always the same as money spent well. WBRO only considers the former, after all.
The other standout organizations are the teams at the bottom: the Texas Rangers, the (now) Cleveland Guardians, and the Seattle Mariners. Each of these teams posted the worst organizational WBRO figures in the past two decades. This is especially significant because each of these teams have sat around league average in recent years. We now know that both the Rangers and Mariners were primed to spend the following offseason, but despite new investment and the extension of José Ramírez, the Guardians put together a very modest offseason. Only time will tell whether this dip will be followed by increased spending down the road.
A Tale of One City (and Two Owners)
The basic idea behind WBRO is to estimate the number of wins an owner is unwilling to purchase despite having the resources. The formula intentionally disregards anything other than simple dollars. This is important because it isolates ownership performance from other factors, such as the quality of analytic departments and general management. Just like fielding-independent-pitching isolates pitcher performance from the influence of fielders, WBRO deals with spending and spending alone. While it is true that owners sometimes take on active roles within organizational decision-making, the varying level of this activity is key; an owner receives a profit regardless of how much or how little they influence how their budget is spent.
As noted in my previous article, Hal Steinbrenner, heir to the pinstriped throne, is easily the least competitive owner in Major League Baseball. Over the course of his tenure, Hal has been worth -9.2 wins per 162 games. But starting in 2020, New York City has a new checkbook. Steve Cohen, notorious white-collar-criminal and newly-minted owner of the New York Mets, represents a well-noted shift in New York sports culture, drawing frequent comparison to Hal’s father, George. WBRO recognizes that shift. Within the first two years of his tenure, Cohen sits atop the current ownership leaderboard with +0.9 wins per 162 games. After another offseason of spending (including a record-breaking $130 million, 3-year deal signed by Max Scherzer), Cohen is likely to keep his position at the top.
Cohen doesn’t deserve any plaudits so he won’t receive any here. That said, his spending casts a shadow on a league that has seen a consistent decline in relative spending despite massive increases in revenue. In that way, Cohen can serve as a kind of real-life example of replacement level ownership. Within just two years, Cohen has reversed the outlook of a team that averaged -4.9 WBRO over the previous 5 seasons. To put it bluntly, while Cohen shouldn’t be praised, every other owner should be put to shame. Hal Steinbrenner even more so, given the fact that NYY is still the most valuable franchise in MLB, valued over twice as much as NYM by Forbes. Competition is at the heart of any sport and, in my view, Hal’s disinterest in spending money only serves to undermine the integrity of the game.
The Future of WBRO
WBRO is both a decent measurement of MLB spending and a tongue-in-cheek analysis of ownership performance justified by an MLB proposal that would have tied player compensation to WAR. In the future, I intend to make it both more decent and more tongue-in-cheek. For starters, I plan to continue updating the charts and to start providing some case studies for teams that have made public financial reports.
In the aforementioned episode of Effectively Wild, I was asked about possible adjustments that could be made to the WBRO formula. I’m currently workshopping ways to incorporate different CBA elements in order to more adequately reflect shifting market parameters. I am especially interested in taking up a suggestion that Meg Rowley offered in the episode: adding potential luxury-tax thresholds to the analysis. This would entail adjusting $/WAR values by how much a team would be penalized for going over a certain payroll number.
I also intend to explore ways to incorporate better estimates for non-payroll expenses that nonetheless make a team more competitive. These would include things like infrastructure, player development, and analytics. While the effectiveness of this kind of spending is largely unquantifiable from the outside, estimates could penalize owners who refuse to invest in these other crucial aspects of organizational process. Consider, for example, Artie Moreno, who consistently sits near the top of the WBRO leaderboard, but who also notoriously neglects scouting and player development. This kind of analysis may simply be impossible with what is publicly available, but it is something I have in mind.
All this is to say, you can expect future updates to WBRO as I continue in vain to rail against a few dozen owners who continue to sabotage the game we all love in pursuit of ever-increasing profit margins. As always, you can find the updated leaderboard here.
Photo by Charles Deluvio/Unsplash | Adapted by Ethan Kaplan (@DJFreddie10 on Twitter and @EthanMKaplanImages on Instagram)