


Last month, MLB reportedly proposed doing away with the arbitration process in order to replace it with compensation based on Wins Above Replacement (WAR). The proposal was dead on arrival, but it marks the first attempt to incorporate some version of $/WAR into the core economics of baseball. Such a proposal invites fans and analysts alike to consider the relationship between in-game wins and the US dollar. It also inadvertently legitimizes the measurement of ownership “performance” in terms of unpurchased wins. Enter what I call Wins Below Replacement Ownership (WBRO), a new stat that does just this.
The basic idea of WBRO is to turn the dollar value of WAR into a way to measure how many wins an owner is willing to buy when compared to a hypothetical replacement level owner, much like WAR’s replacement level player. In order to turn these dollar values back into unpurchased wins, we first have to consider what can serve as a kind of spending baseline against which we can measure an owner’s willingness to spend. That’s tricky since there are a lot of factors determining how much an owner spends and how much of that spending translates into wins for their team.
As with all baseball analytics, the key is isolating individual performance. In the same way that we can consider a pitcher’s performance independent from the impact of fielders by looking at the three true outcomes (Fielding Independent Pitching), we can also isolate the role played by an owner’s willingness to spend by removing any organizational decision making conducted under the advisement of a front office, i.e. front office independent spending. The most basic way to do this is to consider a team’s payroll in relation to its annual revenue. After all, profit returns belong to the owner regardless of how an organization’s decision-making gets done and regardless of how active the owner is in making those decisions.
Replacement Level Payroll as a Percentage of Revenue
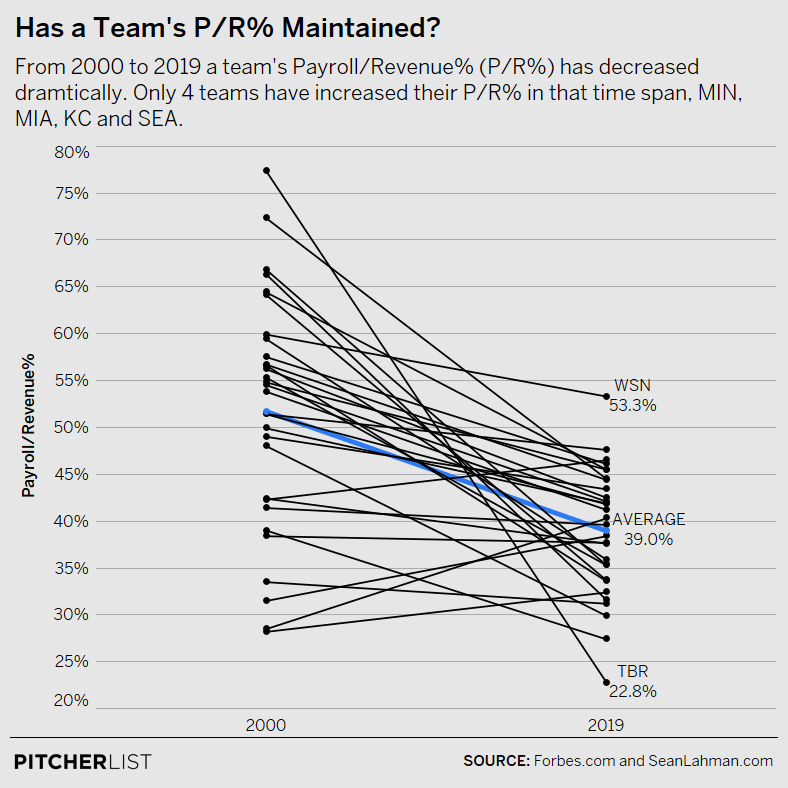
The first order of business is to set replacement level spending for WBRO using payroll as a percentage of revenue. Although team revenues are not available to the public, Forbes Magazine publishes estimated MLB revenues every year. These figures can be combined with publicly available team payrolls to see how much of their annual earnings individual owners spend on their team’s payroll (Payroll/Revenue%). Let’s take a look at a sample of P/R% from 2019:
As we can see from this sample, there’s a pretty wide array of percentages. The Washington Nationals spent about 53 cents for every dollar they made, more than any other team, while the Rays spent just 22 cents of every dollar, placing them at the bottom of the list. With such high variance in how teams spend, how can we establish a baseline figure for team spending?
One plausible way would be to consider team spending in relation to league average spending. But we aren’t looking for a way to calculate wins purchased above average, just like WAR doesn’t calculate how many wins a player contributes above league average. In WAR calculations, we look at the number of wins that can be produced by any readily available AAA player, what we call a “replacement player.” Since the replacement player hypothesized in WAR is well below league average, we aren’t using league average as a baseline. Doing so would be unhelpful because a league average baseball player is already quite good!
In the case of ownership, the opposite is true. Ownership “performance” isn’t really “performance” in the truest sense of the word. Really, what we are looking for is a way to measure an owner’s willingness to spend revenue. That willingness is only decided by the owner and it isn’t limited to an innate ability to spend at a certain competitive level. Why is this important? In recent years, payroll as a percentage of revenue has been in heavy decline:
Data Visualization by @Kollauf on Twitter
In general, owners only like to spend what they feel will make them competitive enough to get by and/or bring in additional revenue. When some teams start spending less, everyone can spend less, and this is exactly what we’ve seen on average. In other words, league average spending is already (and increasingly) quite bad!
Instead of using league average P/R%, WBRO uses the 90th percentile in a given year to set replacement level P/R%. This method has a few advantages. Setting replacement level P/R% this high allows us to consider what kind of payroll is possible given a team’s revenue rather than what kind of payroll is conventional. All other things being equal, if two teams bring in a similar amount of revenue, they should be able to afford a similar payroll. Using the 90th percentile also provides more of a buffer than we would get by simply setting replacement level P/R% at the highest percentage in a given year. That’s desirable since our revenue figures are only estimates.
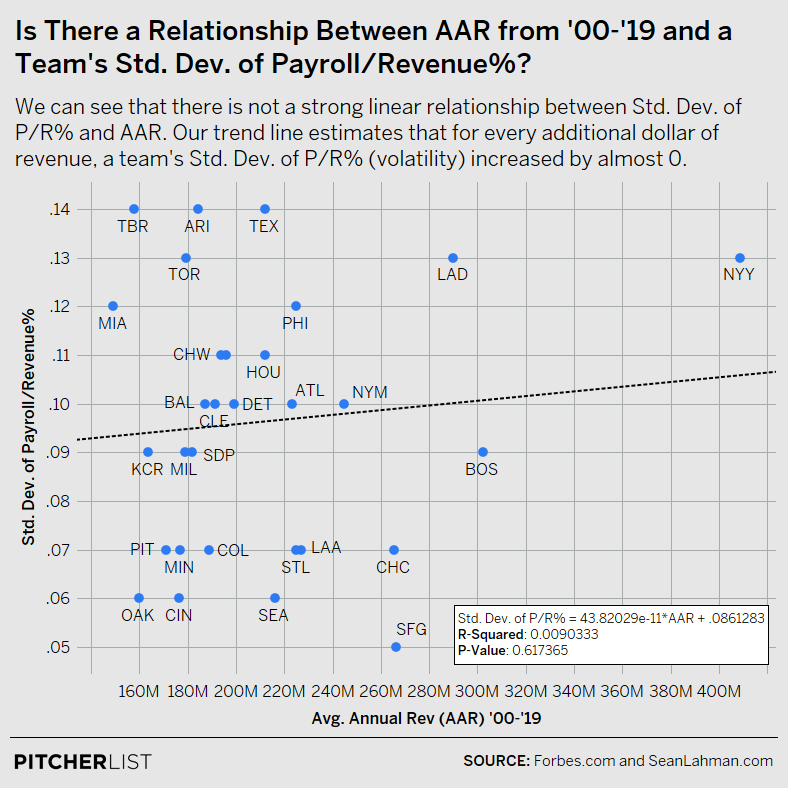
Moreover, setting replacement level spending for a given year accounts for market adjustments, but without allowing too much volatility. This is important because, contrary to popular belief, payroll volatility year to year isn’t determined by a team’s annual revenue. In other words, small-market teams don’t necessarily alternate between liberality and austerity any more than big-market teams. This can be illustrated fairly easily by taking the standard deviation of every franchise’s annual P/R% and comparing this to average annual revenue (as a proxy for market size). When we do this, we see that there isn’t a strong correlation:
Data Visualization by @Kollauf on Twitter
Since payroll volatility isn’t a function of revenue, we don’t need to worry too much about analyzing individual years. With our baseline P/R% defined, we can now turn to WBRO itself.
Wins Below Replacement Ownership
A number of studies (like this one) have attempted to estimate how much on average WAR costs in free agency ($/WAR). The basic idea behind WBRO is to use $/WAR to measure how many wins an owner is willing or unwilling to purchase relative to a replacement owner. Over the past few years, one win has cost around $7-9 million, and that number has increased annually by about 6%. With these values set down, calculating WBRO is simple. All that is left to do is to subtract what a team’s payroll would be at 90th percentile spending from their actual payroll and divide the result by $/WAR. Here’s the formula:
WBRO = (Team Payroll in year X – (90th percentile P/R% in year X * Team Revenue)) / ($/WAR for year X)
This calculation gives a simple measurement of how many wins a team’s ownership decided not to purchase in free agency in a given year. Let’s look at a sample of results, again from 2019:
This list already provides some startling numbers. For example, although the Rays brought in revenue below league average in 2019, the numbers suggest that Stuart Sternberg, the principal owner of the Rays, could have spent a lot more to help the Rays win. In fact, while the Rays and Blue Jays had a nearly identical revenue that year, the Rays spent $39.6 million dollars less than the Blue Jays. That’s good for -8 WBRO in a year when, despite winning 96 games, they lost the division by 7 games. Would they be flying another division flag if Sternberg had spent like the Jays did that year? Their front office certainly would have spent the money effectively.
The Dodgers are often characterized as one of the game’s big spenders. In 2019, they sported a top 5 payroll. Still, WBRO tells us that the Dodgers ownership group, lead by Mark Walters, neglected to purchase 8 additional wins in free agency, tied for second worst that year. The Dodgers haven’t spent in proportion to their massive annual revenue, second only to the Yankees since 2014. Even though the Dodgers have recently received plenty of praise for spending in free agency, the team makes so much in revenue that they would need to spend a lot more in order to counter the league-wide downward trend of P/R% (and compete for a regular season win record in the process). More on the top-revenue Yankees below.
Ranking Owners by WBRO
Now that WBRO has been defined, we can look at the careers of individual owners, ranking their “performance” by average WBRO by season. Here are the bottom 10 current owners in baseball, ranked by their average WBRO from 2000 to 2019:
What’s interesting about this list is that there is nothing obvious about it. The list isn’t comprised of only big market teams or only small market teams, for example, and there doesn’t seem to be much correlation to winning or losing. This is a good sign that WBRO is able to isolate ownership performance alone.
Perhaps the most remarkable thing about this list is the person at the bottom who deserves some special consideration. Hal Steinbrenner took over NYY operations in 2008 and under his watch the Yankees have consistently posted winning seasons. And yet, Hal has just as consistently refrained from raising payroll in proportion to the franchise’s growing annual revenue. On average, Hal Steinbrenner has neglected to purchase 17.8 wins per season by WBRO.
Yankees fans are very familiar with the franchise’s regular appeal to the luxury tax threshold when discussing payroll decisions. Recently, it was reported by The Athletic that Hal personally supported an MLB proposal to lower that threshold. If passed, the measure would effectively hinder Hal’s own spending. WBRO tells us that this is par for the course. Despite the team’s record during his tenure, Hal has been the least competitive owner in baseball. No one else is particularly close.
Moneyball
There are a number of factors that go unanalyzed by WBRO due to the fact that organizational finances are a team’s best-kept secret. We can only estimate revenue by what is publicly available and unless a team discloses other debts and investments, we just don’t know how much a team’s payroll is influenced by the unknown. In many ways, though, a lack of precision is common to all sports analytics – every attempt to quantify performance inevitably misses something. Yet we continue to develop new measurements in order to hone our understanding of the game. This lack of precision doesn’t prevent MLB from proposing to evaluate a player’s performance in dollars and cents. Perhaps if we subjected the performance of individual owners to public scrutiny, in the same way, we might hear more about the frugality of billionaires and less about the motivations of players when they demand proportionate compensation.
All of the data on display above, alongside WBRO for every team from 2000-2019, can be found here.
Photo by Charles Deluvio/Unsplash | Adapted by Ethan Kaplan (@DJFreddie10 on Twitter and @EthanMKaplanImages on Instagram)
Great article! Helped me look at ownership in a new way.
Great analysis! It would be great to also see an estimate of expenses, but assuming expenses are a uniform percentage (as opposed to mostly fixed) the analysis would not change. Thanks!
This is a great question and something I’d like to spend more time on. As it is, there are a few reasons why expenses can be misconstrued. 1) Organizational expenses vary widely, but much of the variance is attributable to investments in non-baseball related operations. 2) Ownership salaries can be treated as an organizational expense (i.e. profit is counted as a wage). For both these reasons, teams tend to claim small profit margins through these accounting measures.
The long story short is that MLB teams have realized that the increased revenue that comes from putting forward a competitive team diminishes past a certain point. There is no additional revenue for trying to be dominant if you are already pretty good. So teams take that money and invest it elsewhere with better returns.
AKA: Hal is a cheap bastard, we all knew it, but now it’s been quantified!
Nice work.
Where can we see the rest of the owners career WBRO?
Nevermind I just noticed the link.