


The Statcast leaderboard for swing/take run values is littered with baseball’s best offensive players. Last season was no exception with AL MVP runner-up Vladimir Guerrero Jr., young superstar Juan Soto, and NL MVP Bryce Harper topping the list. World Series Champion (and new Dodgers’ free-agent prize) Freddie Freeman finished with the fifth-highest total (including the playoffs).
How Freeman’s numbers break down caught my attention. You can see in the table below, shaded in red, that he was the only player in the top ten to have a negative run value in the heart attack region:
I was surprised by this. The heart of the plate is the place where we expect the best hitters to dominate. The heart numbers for the other players in the table demonstrate that. There is a reason pitchers almost universally try to avoid throwing pitches in the heart of the plate and it is because that’s where extra-base damage most often comes from. Batters produced a .310/.307/.564 (.363 wOBA) line against all pitches located in the heart of the plate last season. More than two-thirds (68.8%) of all home runs hit last season came from heart pitches. If you like exemplars, the entire league is roughly as productive as Pete Alonso against pitches in the heart.
It’s not as though Freeman had a bad year by any stretch. His overall numbers last season were all generally in line with his previous levels. His 135 wRC+, while not anywhere near the otherworldly 186 he put up in his 2020 pandemic shortened MVP campaign, was right in line with the 136 and 137 he produced in 2018 and 2019.
But his performance on pitches in the heart of the plate declined significantly compared to prior seasons:
Of course, Freeman’s 2021 depressed batting average, slugging, and weighted on-base average numbers in the heart still compare very favorably to most hitters. They far exceed the league average numbers I cited above and, his heart wOBA still placed him inside the top quartile (104th of 427) of batters with at least 50 plate appearances. But they are a noticeable departure from his past and a curious juxtaposition with his overall productivity that is worth trying to understand.
Run Values 101
Let’s start with a quick primer on how these run values work. They come from historical data that tell us the run expectancy of a given combination of the twenty-four base-out and twelve ball-strike situations, known as RE288. In practice, this means that every pitch thrown in a game (more than 700,000 over the course of a full season) has an expected run value. The results of the play from that pitch can then be credited and debited to the players involved as an accounting of each player’s contributions. If the player’s action increases the run expectancy from one pitch to the next, they get a positive mark. If it decreases the expectation, a negative mark. The run value totals are logged over the course of the season, and they can be divided up across a number of other dimensions, like swings and takes, and by pitch location.
Let’s use Freeman last October as an illustrative example. In the first inning of Game 5 of the NLCS against his new team, Freeman came to the plate with Ozzie Albies on first base and no outs. Dodgers’ opener Joe Kelly started Freeman off with a sinker down and away for a ball. The run expectancy before the 0-0 pitch was 0.53 runs according to the RE288 table linked above. A 1-0 count with a runner on first base and one out has a run expectancy of 0.57, so Freeman was credited +0.04 runs for taking the ball and increasing the run expectancy of the situation. The next pitch was a breaking pitch down and in that Freeman took for a ball, increasing the run expectancy of the situation to 0.64. He thus earned another +0.07 runs to his ledger. The 2-0 pitch was a middle-of-the-plate breaking ball that Freeman launched 425 feet into the right-center field bleachers for a two-run home run. As a result, Freeman was credited with 1.612 runs (1 run for his homer and 0.612 for the resulting change in run expectancy to a 0-0 count with one out and no runners on base). For the total plate appearance against Kelly, Freeman was credited +1.73 runs. Likewise, Kelly was debited -1.73 runs. That total can be further parsed into the 1.61 runs that came from a swing on a pitch in the heart of the plate, and the 0.11 runs that came from pitches taken for balls in the chase and waste regions.
Freeman in the Heart
Such granularity gives us the ability to dive into Freeman’s data to try and identify an explanation for his negative value in the heart last season. Starting with his swing/take profile we can see that he produced +2.3 runs when he swung against heart pitches and gave back -5.4 runs when he watched heart pitches go by. It’s worth pointing out that nearly all takes on pitches in the heart are producers of negative run value for the batter, because they should be a called strike (but sometimes, and more often than you might expect, are not).
Given that data, we might quickly assume that Freeman’s issue was taking pitches in the heart.
But the data suggests that is, at best, only part of the explanation. Last season, he took 14.77% (110) of the 745 pitches he faced in the heart, a mark that was far below the 26% league average heart take rate and placed him among the most aggressive hitters when it comes to attacking pitches he can damage. That said, the data from the past five seasons in the table below shows that Freeman has trended toward more takes on heart pitches the past few seasons. Last season’s rate was the second-most passive of his career.
So, it’s possible that watching hittable pitches go by is part of the explanation. It seems unlikely to be the full explanation, though. The magnitude of impact is not large enough to explain the full change. Take 2019 as a comparison. That season, he had -4.9 runs from takes in the heart (not far off from his 2021 mark) but still had +9.3 runs from the heart overall thanks to +14.2 runs from swings.
Studying the table a bit more, the comparatively small +2.3 swing runs produced last season (blue highlight) stands out. Compared to the previous years, that’s a significant decrease.
Let’s investigate his results from swings against pitches in the heart. There are five possible pitch outcomes from swings in the Statcast databases: 1) a batted ball in play for an out, 2) a batted ball in play for a hit, 3) a swing and a miss, 4) a foul ball, and 5) a called strike (oddly, but there are a few strays in the data).
The chart below shows Freeman’s distribution across those five categories on swings against pitches in the heart of the plate for the past five seasons:
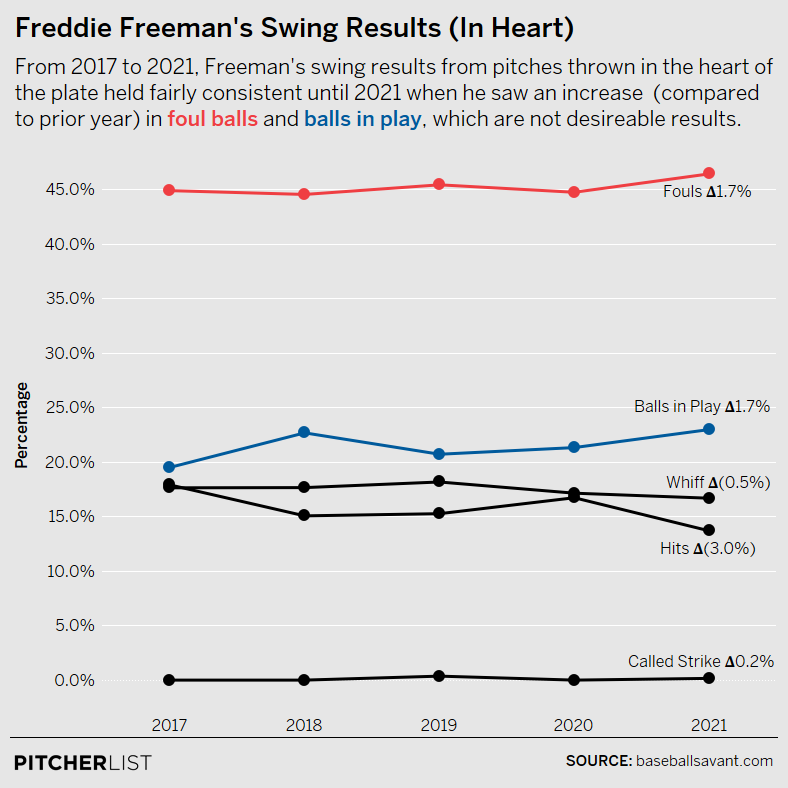
Data Visualization by @Kollauf on Twitter
The year-to-year differences are just a percentage point or two, but there are a couple of patterns that emerge in the data. Three of the categories—fouls, balls in play for outs, and hits—all trended the wrong way. Freeman’s share of swings producing foul balls jumped up about a point and a half last season from prior rates. His share of swings producing an out on a ball in play has been on a year-over-year upward slope and reached a new high last season. As a result of the changes in those first two categories, his share of swings that produced a hit has declined more than four points since 2017 and set a new low last season. On the positive side, he’s managed to hold his whiff rate against pitches in the heart steady over time.
These subtle shifts mostly work against Freeman. Obviously more outs on balls in play and fewer safe base hits will lead to more negative run value totals. Foul balls are also a somewhat hidden source of negative value because they frequently result in a strike in the count, which tends to reduce the run expectancy of the next pitch. Foul balls are a good thing when the hitter is battling to stay alive in a two-strike count. But they are a poor outcome if the batter just missed a 3-1 pitch in the middle of the plate.
The chart below gives us a better sense of which of those changes above was most impactful to Freeman’s run value production:
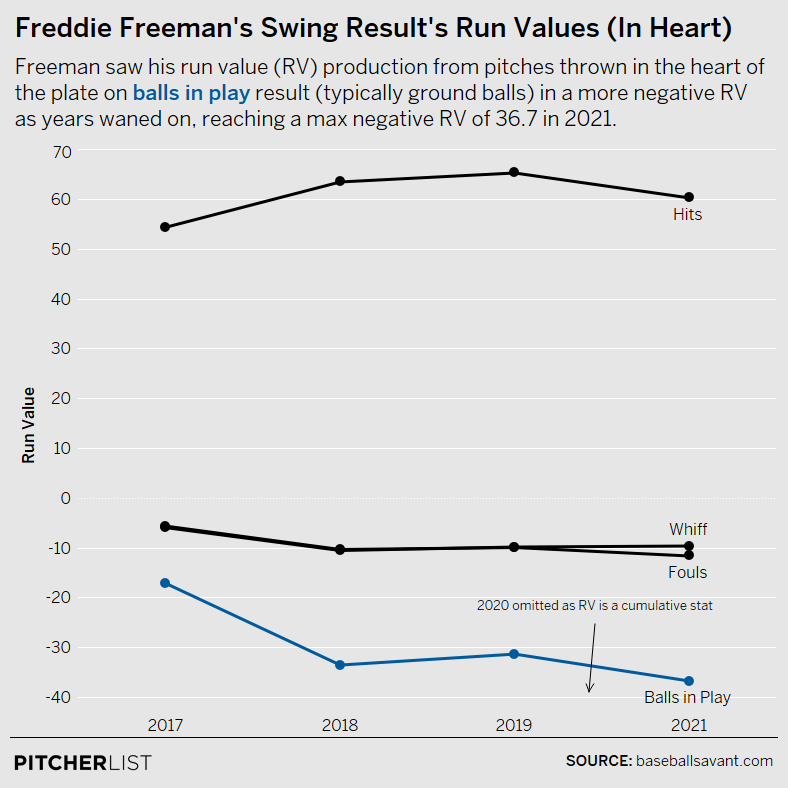
Data Visualization by @Kollauf on Twitter
It seems clear that the increased negative results on balls in play are the primary factor driving his lesser run value production in the heart region. But what is behind that?
With the help of Statcast search, I broke Freeman’s balls in play for outs from heart pitches from the past five seasons down by batted ball type—ground ball, fly ball, line drive, and pop up:
Freeman put 146 heart pitches in play for outs last season and nearly half of them were on the ground, easily his highest rate of ground balls on heart pitches in the past five seasons. This is the biggest reason why his heart zone production declined last season.
This tracks with the fact that Freeman’s overall ground-ball rate last season was 43.2%, the highest of his career and more than five points above his previous career high. Perhaps this was just a circuitous way to get to a conclusion that might have been more quickly achieved by quickly looking at his overall batted ball profile, but going through the steps to more granularly break it down adds confidence to the explanation for his strange negative run value against the most hittable pitches.
Impact of the Shift
There is one other piece to this puzzle worth mentioning. It’s not just that Freeman hit heart pitches on the ground more often. It’s also that there was a predictable pattern about where he was likely to hit them, as this spray heatmap of his batted balls in play against pitches in the heart shows:
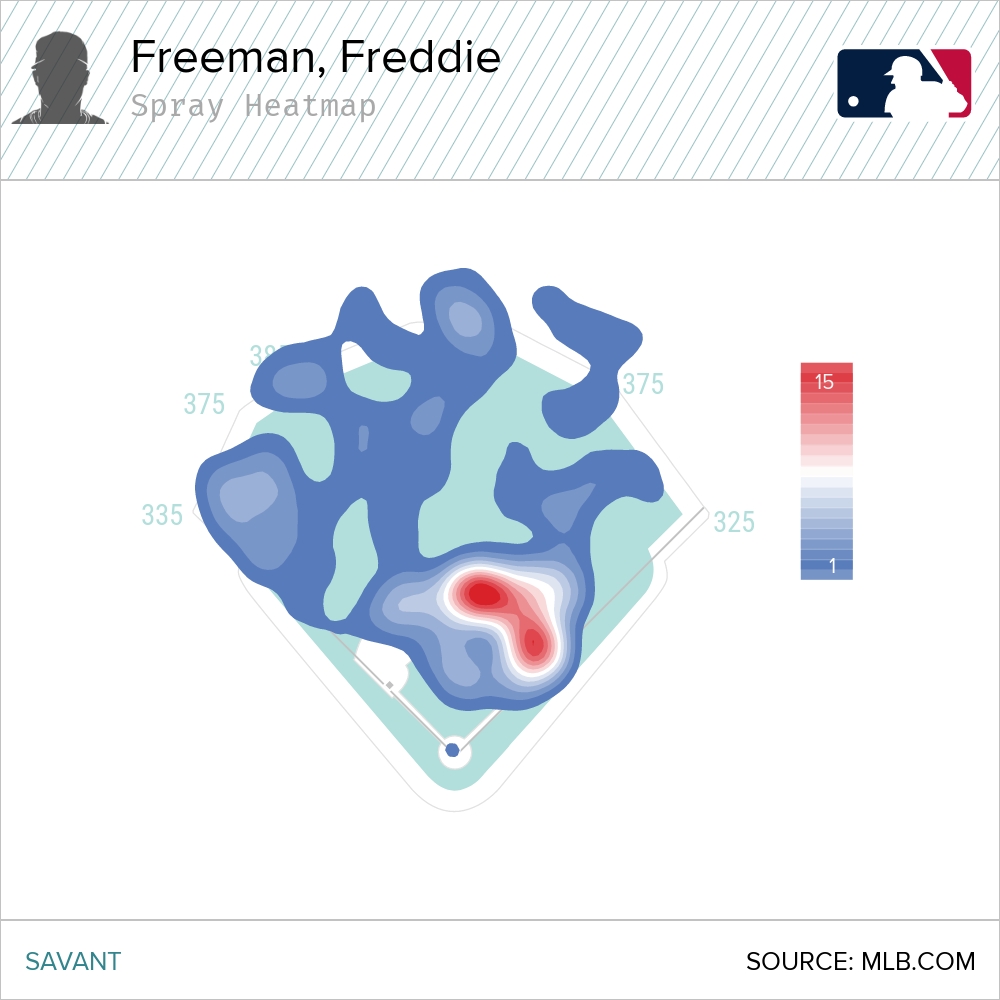
Like a lot of left-handed power threats, Freeman has faced an increasing number of infields shifted to his pull side in recent years. Last season, no doubt in part because of data like the heatmap above, opposing defenses shifted their fielders against Freeman at the highest rate yet: 72.5% of his plate appearances. And because he was hitting the ball on the ground into the teeth of those shifts more than ever, they were more successful than ever in limiting his production. His .361 wOBA was the lowest mark of his career against shifted defenses.
Conclusion
In the end, it turns out that Freeman’s strange combination of a very productive season with a negative run value in the heart can be explained pretty simply. His approach remained fantastic and he worked himself into situations where he got plenty of pitches in the heart to hit. But for whatever reason, he was just a tick off, resulting in a few more fouls and a lot more grounders instead of more productive line drives. Opposing teams exploited that by shifting their infields even more often to gobble up Freeman’s pulled grounders.
In a lot of ways, this serves as a reminder of how hard it is to hit in the big leagues. You can do a whole lot right just to get a good pitch to hit and then not get any positive payoff in the results. It’s a good example of why so many hitters focus on their process and what they can control, instead of fretting about the results.
Now, as the Dodgers make a sizable investment in Freeman in free agency, they surely assessed what to make of this change in his contact profile. We know that ground-ball rates tend to increase with age and the 32-year-old first baseman is probably on the wrong side of the aging curve. Perhaps this is the beginning of his decline phase. Or it might be just a temporary blip.
It’s worth noting that Joey Votto, another excellent left-handed first baseman with outstanding plate discipline, has pulled this unique combination of being highly productive overall while having negative run values in the heart of the plate a couple of times in the past few seasons. The Dodgers can look at Votto’s production as he has aged (cumulative 137 wRC+ since age 32) as an encouraging scenario for Freeman. Beyond that, another reason for encouragement about Freeman’s mid and late-30s is the coming ban on defensive shifts, which should mute some of the negative effects of his changing batted ball profile.
Photos by Rich von Biberstein & David J. Griffin/Icon Sportswire | Adapted by Michael Packard (@artbyMikeP on Twitter & IG) | Data Visualizations by @Kollauf on Twitter