


Pitch location has long been an obsession of mine. It all started in 2015, I was watching a Cleveland Guardians game as Trevor Bauer was struggling mightily on the mound. No matter how you feel about Trevor Bauer as a person (and to be fair you almost assuredly shouldn’t feel good about him at all let alone as a person) he is a perfect example of what we’re going to discuss. Back to the game. We’re somewhere around the fourth inning and Bauer is pacing around the mound in agitated rage as he walked what felt like the 500th batter in a row because he couldn’t get anyone to chase his curveball. Bauer was just absolutely flabbergasted by the hitter’s seemingly ironclad discipline. Guardians Play by Play commentator Matt Underwood was equally confused. His partner, former MLB player Rick Manning explained (and I paraphrase): “It’s really simple he can’t throw it for a strike and they know it. They see curveball and they know not to swing.” and that really sat with me. That curveball had all the hallmarks of a great pitch, a tremendous 20.3 SwStr%, a 69 K% and even had a 37.0 O-Swing%, heck hitters only had a 14 wRC+ against it. Yet that year over 321 curveballs he was only able to amass 0.6 pVAL with the pitch for the year. A large part of that was because of the pitch’s miniscule 31.0 Zone%. In 2016 though that same curveball was worth 7.6 pVAL. What changed? A bunch of things but one of the biggest changes was that Zone% jumped up to 40.1%. In 2017 it was worth 6.4 pVAL and the Zone% was….48.2%!
An obsession was born for me with this concept. I became convinced that it was important to be able to locate a pitch in the zone and out of the zone in it’s ideal spots; four-seamers up, sinkers, sliders, curveballs, changeups down, or what we call the Blake Snell Blueprint around these parts. I was roundly sure that being able to this was the key to success, that this is what seperated pitchers from throwers. If you’ve read my writing over the years you’ll know I’ve really pounded this concept home over, and over, and over and over…and you get the point. Then in 2020 for the very first PitchCon I put together a presentation where I used machine learning and modeling techniques to determine which characteristics of changeups that year separated good changeups from bad ones. To my surprise the characteristics that had the strongest correlation with and effect upon changeup success were location based: The percentage of changeups the pitcher threw down in the strike zone and the percentage of changeups through down altogether.
Too low a percentage and it hurt the pitches effectiveness but if the percentages got too high and you saw diminishing returns that way too. This cemented within me the belief in location mattering most in a pitch’s effectiveness. Even though I could use this information to somewhat accurately interpret a pitcher’s breakout or diagnose their struggles with a pitch but it wasn’t the same as having something I could actually USE to analyze pitch locations. Up until now all I had was anecdotal evidence and accidental data-based findings while analyzing something on a much larger scale. No I wanted a stat I could use to not only determine if a pitch’s location was helping a pitch succeed (or not) but also determine WHAT the effect was and predict if that success (or lack thereof) would continue. It was out of that desire that I created a new statistic Optimal Location Ratios (OLR). Here in this primer I will lay out the techniques I used to create this statistic and the general basics surrounding it. Then over the next few weeks I will be putting out articles and videos talking about each pitch individually and some ways you can use this statistic. Finally I will make pitch projections for the 2022 season using OLR, with quarterly updates to see how things play out using over a full season. For now though let’s set the stage for those articles by talking about how I created/tested OLR and what it’s goals are, how you read it, and what it’s supposed to represent.
What is OLR?
At it’s core OLR is about comparing the rate at which a pitcher throws a pitch in it’s optimal location (Four-seam fastballs up, sinkers, breaking balls and offspeed pitches down) inside the strikezone and the total rate at which they throw the pitch in that optimal location as a whole. We’ll dive into the specifics of each pitch in the coming weeks but overall every pitch showed a strong connection between this ratio and pitch success. To define a few variables for notation purposes before we get started:
IZ% – % of the pitch that is thrown in the zone in it’s optimal location according to Statcast
OUT% – % of the pitch that is thrown out of the zone in it’s optimal location according to Statcast
TOTAL% – IZ% + OUT%
and the formula for Optimal Location Ratio is:
OLR – (IZ% / TOTAL%)/100
Since the ratio is calculated by dividing a portion by the whole, all OLR ratings are between 0 and 1 regardless of pitch type. The point of this is two fold. The first part is that if all the ratios are kept on the same scale they retain some semblance of normalization which makes it easier to compare across pitches and hopefully some day create an overall ratio for a pitcher’s entire pitch mix. The second reason has to do with IZ%. While there was some difference from pitch to pitch regarding what OUT% was most common amongst successful pitchers there was a consistent theme that showed up across every single pitch. There was a huge separation between the IZ% of pitchers with positive pVAL pitches and the negative pitches. This told me that in the construction of OLR’s structure I wanted to give more weight to IZ%. Since it is IZ%/TOTAL%, the higher the ratio is the greater percentage of their total pitches in that optimal area for that pitch that is made up of pitches in the zone. This allows you to draw two conclusions immediately from the ratio. Do they throw a high percentage of that pitch in the zone in it’s optimal location? AND Does IZ% make up a large chunk of the total pitches they throw in the optimal location for that pitch? That gives us more information to draw conclusions from than just IZ% on it’s own. It is important to note that OLR is not a catch all statistic for determining pitch success. You can’t look just at OLR and say “This is why that pitch is successful or not.” but as you will see throughout the pieces that follow this primer, we will see just how strong the connection is between OLR and pitch success and how it affects that pitch’s chance of success. It can help be a major piece of the puzzle of determining why a pitch is experiencing success (or not), lay out a path for pitch improvement, AND help predict/evaluate potential breakouts. It can tell us whether a pitch’s success is likely to continue or if it’s the result of noise and randomness. There is so much potential for how OLR can help us evaluate pitchers, hitters, catchers and really every aspect of the game of baseball.
Methodology
To test OLR I placed pitcher pVAL (from Fangraphs) and Statcast pitch location data along with OLR and it’s components through a series of statistical tests and models with the goal of determining if there is a connection between OLR and pitch success and to attempt to determine what the effects of that connection are.
Box Plots
I used Box Plots to simply determine if there was a notable distinction in the data between pitchers who had a positive pVAL in that year for that pitch and the negative ones. You’ve already seen for instance the box plots for IZ% across all the pitches we examined and it’s pretty clear how they can show differences or what are often referred to as trends in the data, for instance we could say that positive pVAL pitches tend to have a higher IZ% than negative ones. The box itself represent the inner 50% of the data in each category, essentially all the data between the 25th and 75th percentile. The whiskers extend across an additional 15% to cover 90% of the data and then the outside dots represent the outliers. As an example here is the box plot for Optimal Location Ratios for positive and negative pVAL sinkers:
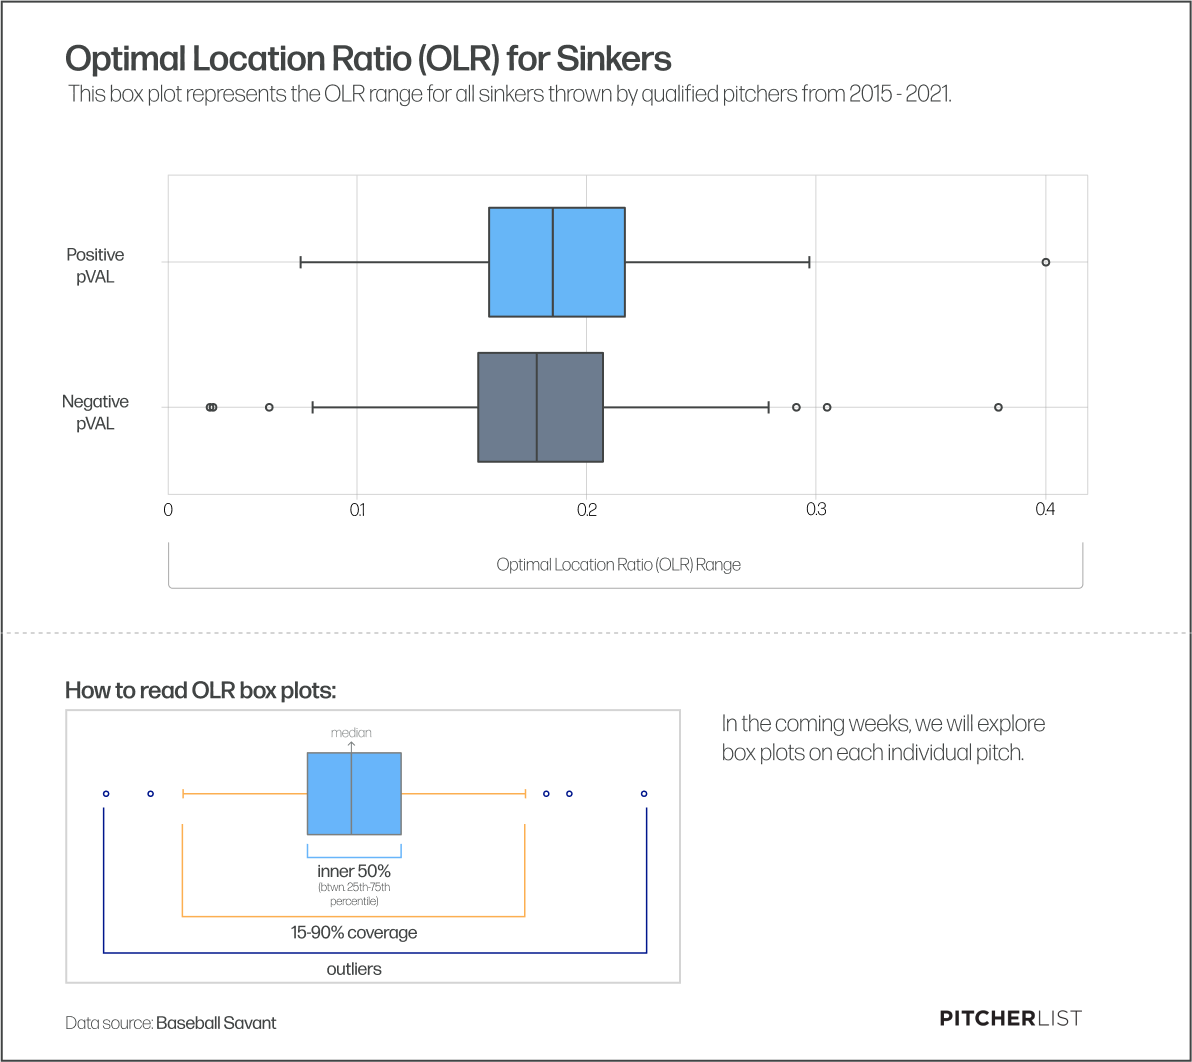
For each pitch, in their respective articles, we’ll show each box plot and how they demonstrate that they two categories are trending apart.
Decision Trees
An important question to ask with a new statistic like this is whether or not it is a decisive classifier of successful pitches. To answer this I modeled the data using Decision Tree Models. We’ve all played the game Guess Who? at some point in our lives, where you attempt to whittle down potential candidates your opponent could be holding using visual classifiers. You ask if their candidate has brown hair and if they say no you flip over and out of play several potential candidates and then repeat the process for if they are wearing hats, or glasses, or if they have green eyes, etc. until you are left with one candidate. Decision Tree models do the same thing only they are asking statistical classification questions like “Is IZ% above 16%” or “Is CH% above 20%” to determine if the pitcher would likely end up in the positive or negative pVAL bins for that pitch. For example here is the Decision Tree Model for Sinkers:
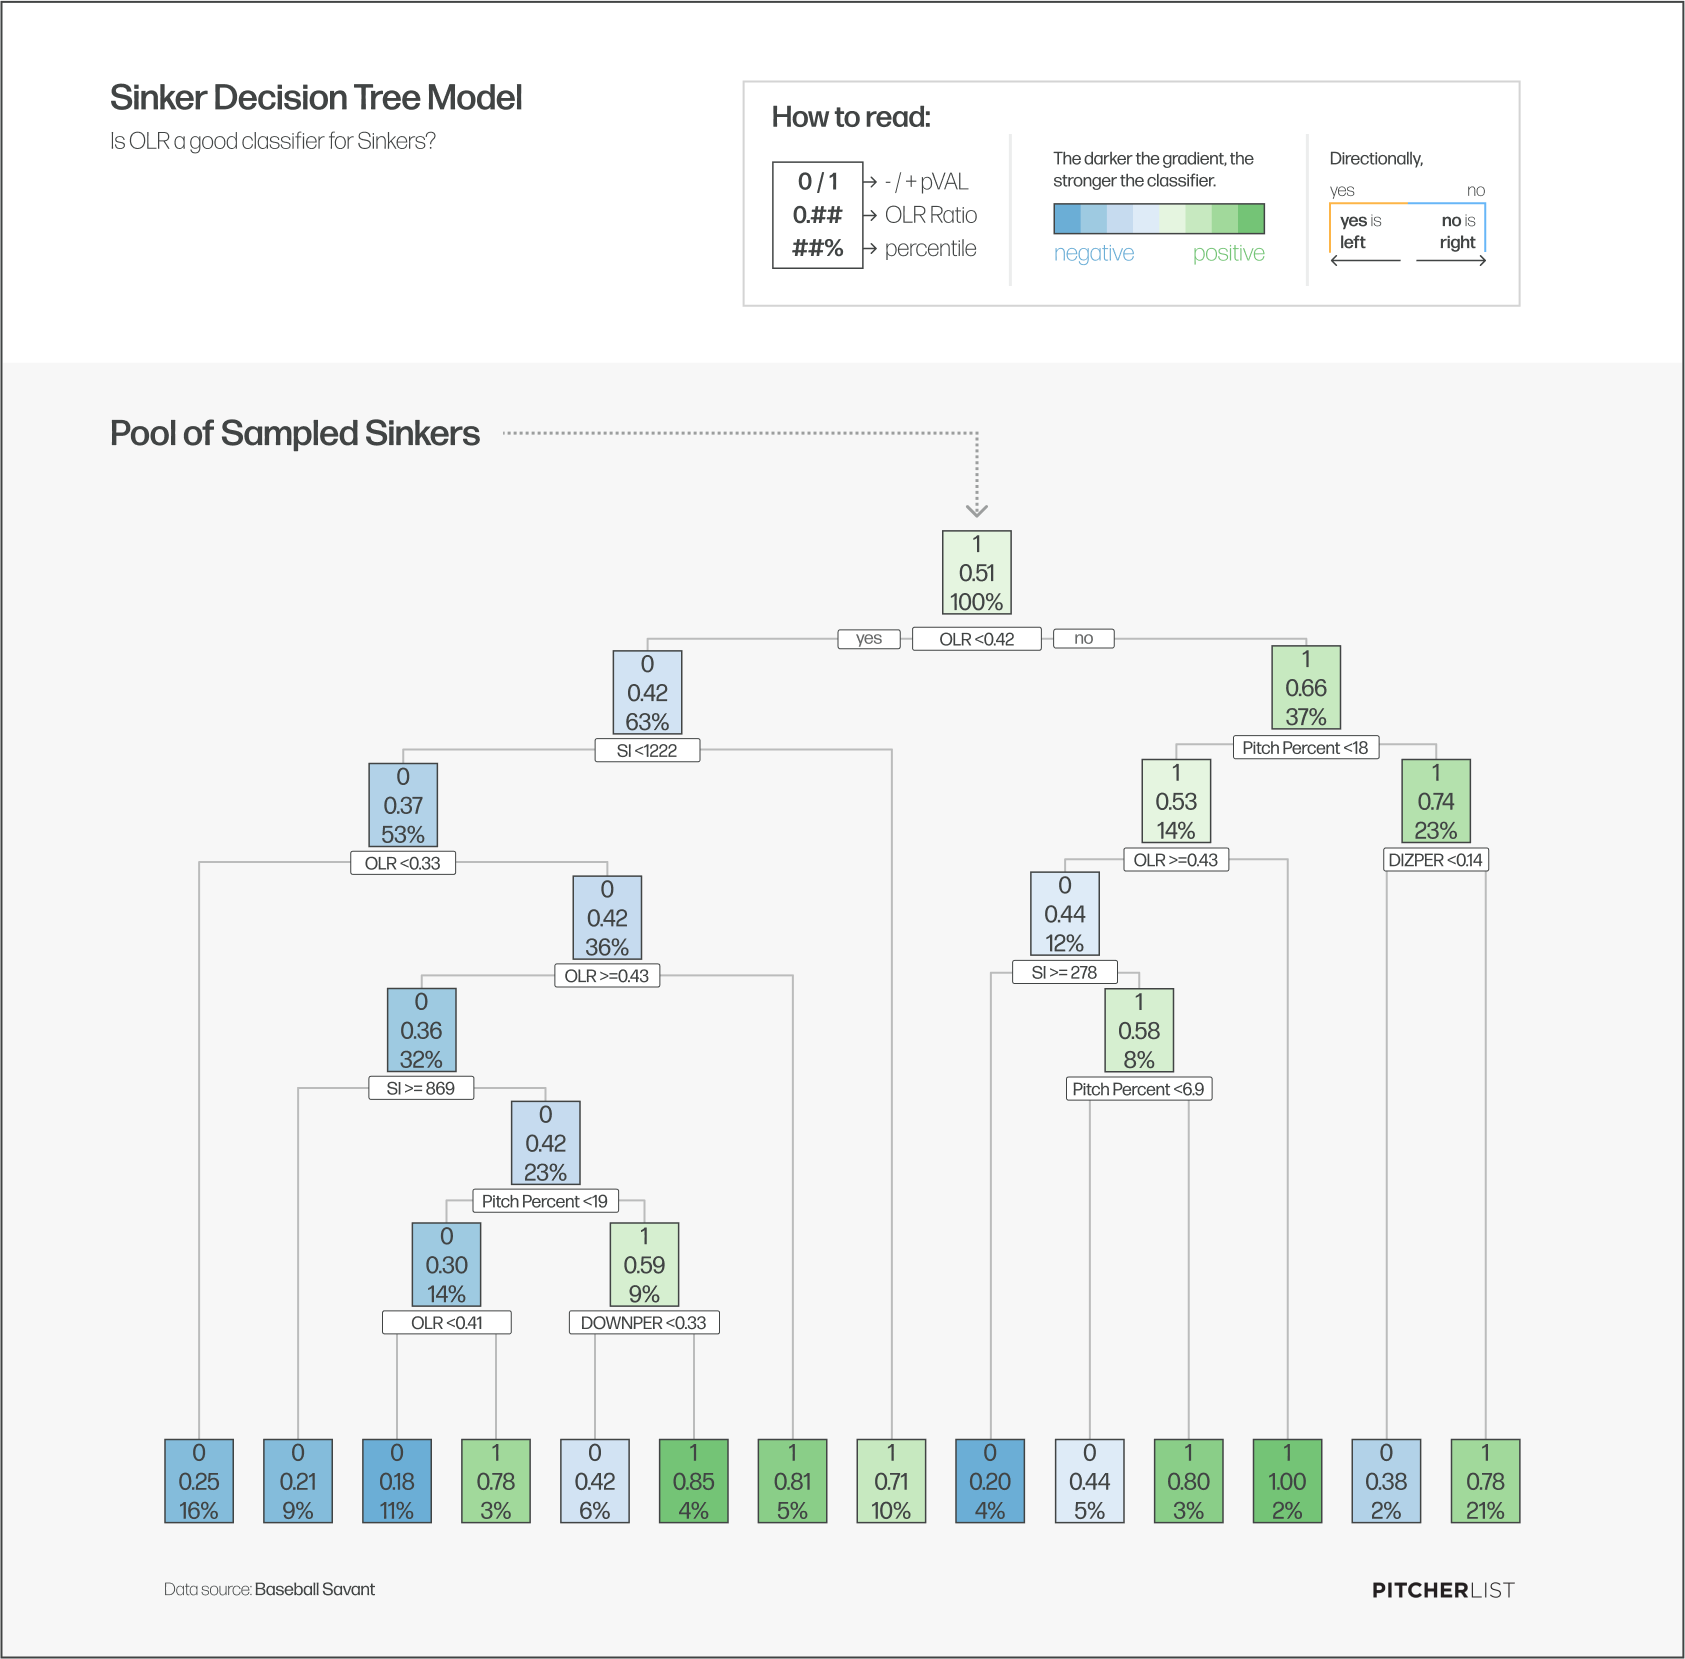
At a glance the most important thing I wanted to see in these decision trees is whether or not there were multiple instances of either OLR or IZ% (in this case DIZ% for Down In The Zone %) showing up as a classifier for separating the successful pitches from the unsuccessful. You can see in the above model that this is the case for sinkers and that’s what we’ll be looking for in each pitch as well.
Logistic Regression
Logistic regression models quantify the impact of changing OLR, leaving all other variables unaltered. To use another analogy, it operates like a Sliding Doors or Multiversal model. It asks if we went back in time to a particular pitch within a particular season and changed absolutely nothing else other than increase that pitch’s OLR by one for that season, how much more likely would it have been that pitch was successful. The model produces a variety of numbers but for this study the two numbers we care about are called P-Value (not to be confused to pVAL) and the Odds Ratio. At the end of the day P-Value tells us whether or not we are at risk for a false positive in our data. The goal is to have P-Value come up as below .05 or a 5% chance of encountering a false positive in the data. If it’s below that threshold it’s fair to consider the data and results reliable. The Odds Ratio on the other hand is the coefficient that describes the strength of the relationship between OLR and Pitch Success. Here are those P-Values:
Over the next several weeks I am going to talk alot about these pitches but not much yet about Curveballs. You can see why here in the P-Values. Every single pitch meets that .05 threshold except for curveballs which doesn’t even come close at a nearly 47% chance of false positives in the data. We just can’t trust the results right now as the model is structured. My suspicion is that this is because there is a pretty strong imbalance in the positive and negative categories for curveballs with the positive data points outnumbering the negative by almost two to one while a base logistic regression model mostly only plays nice when the categories are pretty closely balanced. I’m working on adjusting the model and data set and hopefully I’ll know more soon. For now we’ll stick to using OLR only for four-seamers, sinkers, sliders and changeups. Now look at the Odds Ratios:
The way you would report that Odds Ratio number is “If you went back to 2020 and raised Blake Snell’s (random choice) OLR for his four-seam fastball by one and nothing else that pitch would have been 55 times more likely to have been a positive pitch that year.” Now it’s worth noting two things:
- How does one raise their OLR? They increase their IZ%, since the closer IZ% is to the TOTAL% the higher OLR gets.
- In that vein since OLR is created by dividing the IZ% by the TOTAL%, the highest the ratio can get is 0ne so raising the ratio by one is pretty much impossible.
With regards to that second note, this isn’t a huge issue as all we have to do to scale the algorithm that model uses to produce the Odds Ratio to range OLR uses. Once scaled down, we now refer to the Adjusted Odds Ratio as if you raised OLR by .1 instead. You can see an example of these numbers here.
Now we have a much more useable number. In the example above we can now say “”If you went back to 2020 and raised Blake Snell’s (random choice) OLR for his four-seam fastball by .1 and nothing else that pitch would have been 1.55 times more likely to have been a positive pitch that year.” To put that in context Patrick Corbin threw the most sliders in 2021 with 1,050 sliders with 205 of those sliders being down in the zone (19.5%) and 644 down and out of the zone (63.2%) for a TOTAL% of 82.7% and an OLR of .24. How would improving his OLR have effected his season? Lets look at a few cases here:
For the record Corbin had a -3.1 pVAL for his slider in 2021. What the Adjusted Odds Ratio tells us here is that by changing nothing else about the pitch other than having him throw 21 more sliders down and in the zone and 21 fewer down and out of the zone, his slider would have been 1.32 times more likely to have compiled at least a 0.1 pVAL. Exchanging 47 sliders down and out of the zone for one’s down and in the zone and the pitch would have been 1.74 times more likely to have been a successful pitch. Heck, doing the same for just 78 of those sliders would have made the pitch just over two and a half times more likely to have a finished with a positive pVAL. That’s with making no other adjustments, no other improvements, nothing and it is that much more to be a successful pitch. It’s clear OLR has a very strong connection and effect on pitch success for sliders. I’ll dive into each pitch I studied (four-seamers, sinkers, curveballs, sliders and changeups) over the next couple weeks with regards to OLR but I will note here that every single pitch showed strong connections and effects in their logistic regression models.
Naive Bayes Model
I’m actually working on a larger piece about the importance in sports of Thomas Bayes, the statistical Theorem that bears his name and the philosophy it inspired but for now I’ll throw up a short, non-mathmatical explanation. At it’s basest level Bayesian Thinking is the idea that when you receive new stimulus or information you interpret said information through the lens of your previous knowledge and experience and update your viewpoints based on your previous information adjusted for the new information. In Bayesian Statistics this is done through probabilities. It’s a mathematical tool used to update our beliefs about random events in light of seeing new data or evidence about those events. Naïve Bayes is a type of model that uses these tools to tell us whether or not OLR is predictive. In short the output of the model tells us “What is the probability that if I know absolutely nothing about a pitch outside of the pitch’s OLR that you can accurately predict whether or not that pitch will end up with a positive pVAL.” Here are the probabilities produced for each pitch:
Technically anything over 50% is consider predictive but I would only really use a stat to make predictions in this case if it was above 53% or so, which would exclude sinkers at just 51.5%. My hope is that if I can get more data by opening things up to non-qualified pitchers we might get stronger Naive Bayes results before I get the sinkers page out but for now I would only use OLR to make predictions about the other pitches. By the way look at that probability for Sliders! 69% probability is incredibly high. That means that if you knew nothing about a slider other than it’s OLR you would have a better than two out of three chance to correctly determine if it will be a positive or negative pitch according to pVAL. That’s very, very predictive. I’ll talk about when each pitch stabilizes in the article’s about each individual pitch but this level of predictability opens up nearly endless potential uses for analysts, fans, scouts, coaches, and players.
Conclusions
From the box plots all the way down to the naïve Bayes models it’s pretty clear that there is a connection between OLR and pitch success for four-seam fastball, sinkers, sliders, and changeups. Decision Tree Modeling shows the importance of OLR in determining good from bad pitches and Logistic Regression shows not only confirms the connection but shows that connection to be a strong one and demonstrates exactly how strong. Best of all, we can use that strong connection to potentially predict future pitch performance! This could genuinely be a game-changing way of evaluating the modern approach to pitching and for laying out blueprints for success for pitchers as well.
What’s Next
Starting next week I’ll start putting out articles talking more about each individual pitch along with more specific details for that pitch and giving out examples of to use OLR to evaluate that pitch. I might even be including some predictions for some pitches I am keeping an eye out for in 2022. Finally as we get into spring training (maybe? Hopefully? Please MLB?) and have a better idea of who will be pitching where I’ll try to put out a full set of predictions for the 2022 season along with some potential breakout and bust pitches which will be updated quarterly! Until then please don’t hesitate to leave a comment if you have any questions or you can hit me up on twitter at @DanielJPort and I’d be more than happy to talk about OLR in any capacity until I’m blue in the face! I’ll see you next week when we sit down to look at four-seam fastballs!
Design by J.R. Caines (@JRCainesDesign on Twitter and @caines_design on Instagram)