


Any baseball statistician will tell you: “Not all offensive environments are created equal.” In some years, the ball explodes off the bat, creating more runs than expected. In other years, the offense just can’t get going, and pitchers dominate. But how do these different game environments alter the game itself? What effect do these run environments have on individual games? How should teams act in these environments? This piece will attempt to answer all of these questions so we can better identify the effects of the run environment on the game we love, as well as the competitive balance advantages teams could utilize.
To paint the whole picture, let’s establish a baseline. For this study, I will be using run data from 2003 to 2021, excluding 2020 (for obvious reasons). This window will provide a thorough evaluation of the modern run environment, and the start year was purposefully chosen to coincide with a new collective bargaining agreement.
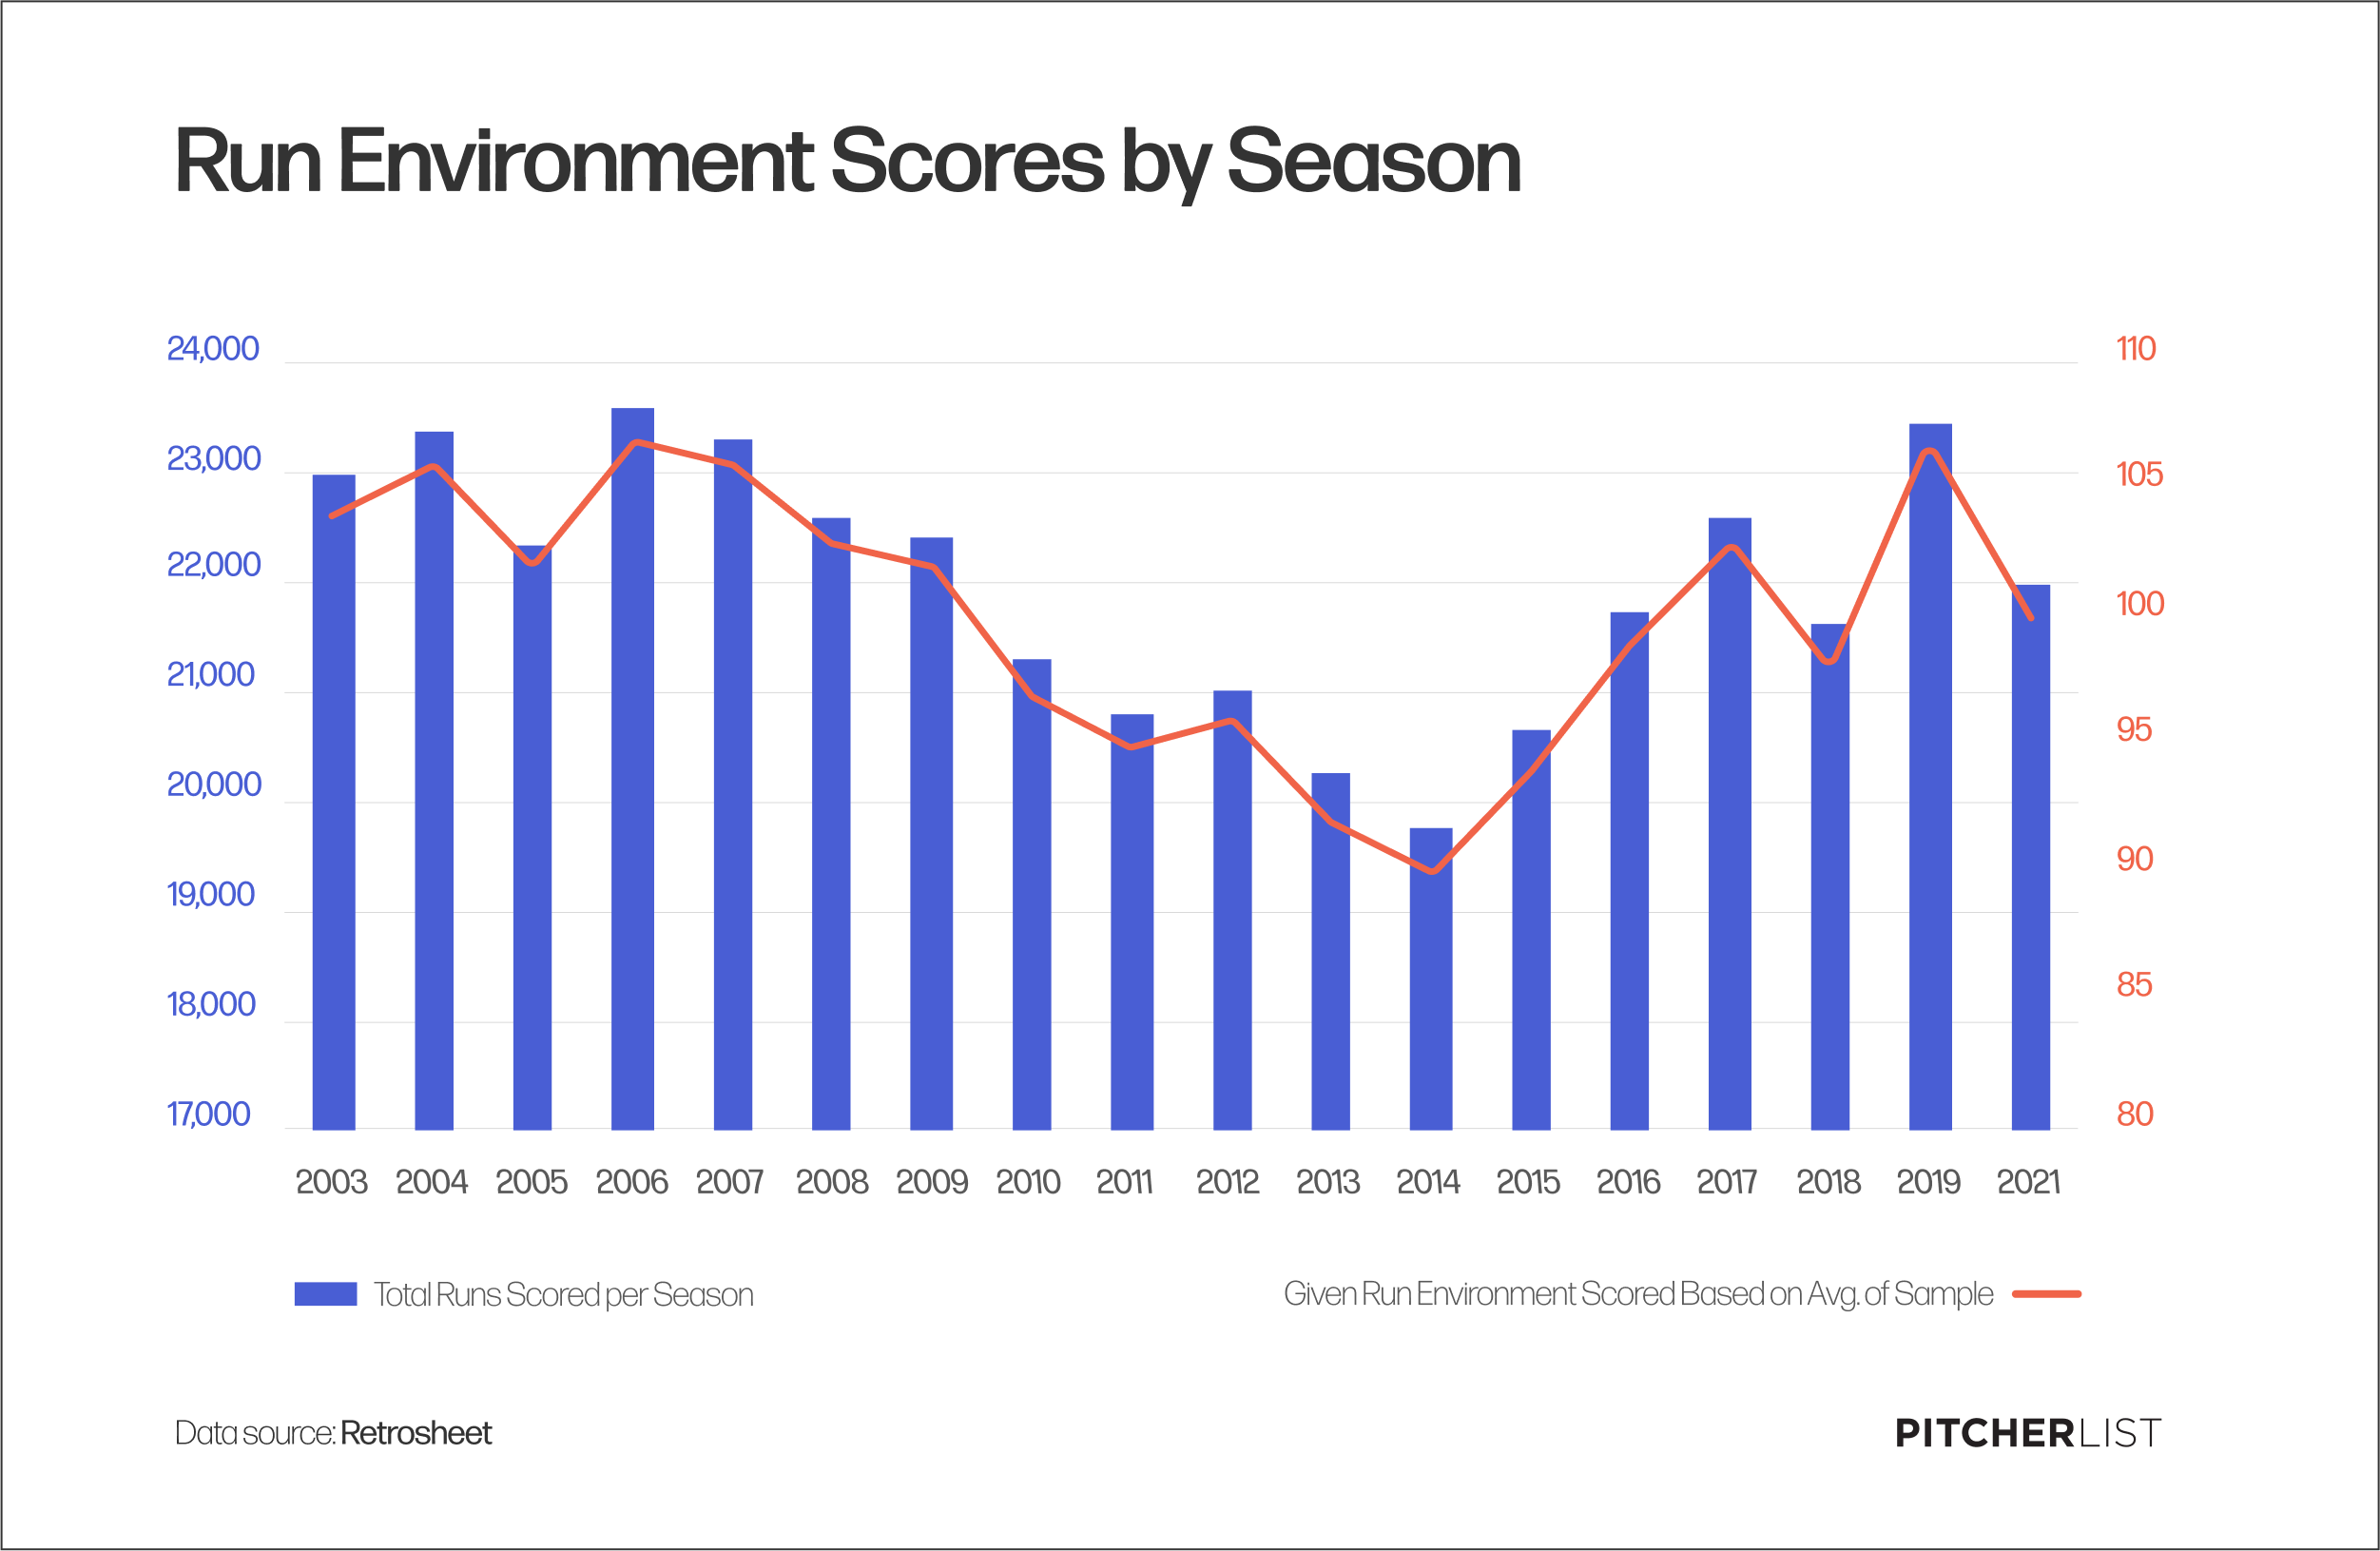
To make conclusions about the impacts of the run environment, we need to look at the modern scope of data. From this set, the number of runs scored ranges from 19,761 to 23,599 each year. The average runs scored is 21,990.
Now we have some context. But, let’s make this simpler. Converting the 21,990 to the new average of 100, we can see the relativity of runs scored per season more easily. This result will be considered the run environment score. And while some more advanced facets consider multiple factors, only a broad knowledge of the number of runs is needed to extrapolate our desired information.
Created by @visual_endgame on Instagram and Twitter.
Effects of Run Environment in a Given Season
Methodology
As mentioned in a prior competitive balance piece, there are multiple ways of measuring given advantages in certain run environments. The standard deviation of the winning percentage is considered the norm in measuring this factor, while I prefer run differentials. In the interest of fairness, both will be used.
Using the coefficient of determination (R-Squared as it’s commonly known, which measures the amount of variance that a certain factor accounts for), the effects of the run environment on general season outcomes appear. Only about 9.7% of the variance of the standard deviation of winning percentage can be owed to a season’s given run environment – a surprisingly low number. In the aggregate, the amount of wins a team has isn’t going to fluctuate by much when factoring in the run environment.
Now let’s consider the standard of competitive balance that I like — run differential. Unsurprisingly, run environments have a bigger effect on run differential in the aggregate than on wins. However, the spread is unexpectedly large. About 76% of the variance of a year’s average run differential can be owed to the run environment. In theory, win SDs and run differentials should be closely aligned. The run environment should have a similar effect on both wins and run differential as a whole, but that doesn’t seem to be the case.
The fact that run differentials and wins are affected so differently by the run environment in a given year could be owed to several factors. Run differentials themselves are more predictive of future wins, although they do not necessarily best represent the wins at a time. Hence, sometimes large differentials between Pythagorean Wins (Win estimate based on run differential) and actual wins exist. Another factor goes hand-in-hand with this – the actual direct relation between the two variables. As far as degrees of separation go, run differentials are much more closely related to run environments than wins. After all, the formers both have runs as units. The latter has to switch units, suggesting a less direct relation. Or, perhaps the problem lies in the specific timetable of the dataset. There is no doubt the allotted variance would change by a decent margin with a few years added or taken away, although a big spread would still be existent.
Application
The only fact that seems obvious is that the higher the run environment, the higher the run differentials in a given season, which may or may not lead to a major effect on competitive balance. If win percentage is one’s gold standard of competitive balance, then the effect of the run environment is arguably negligible.
Effects of Run Environment on a Given Game
Methodology
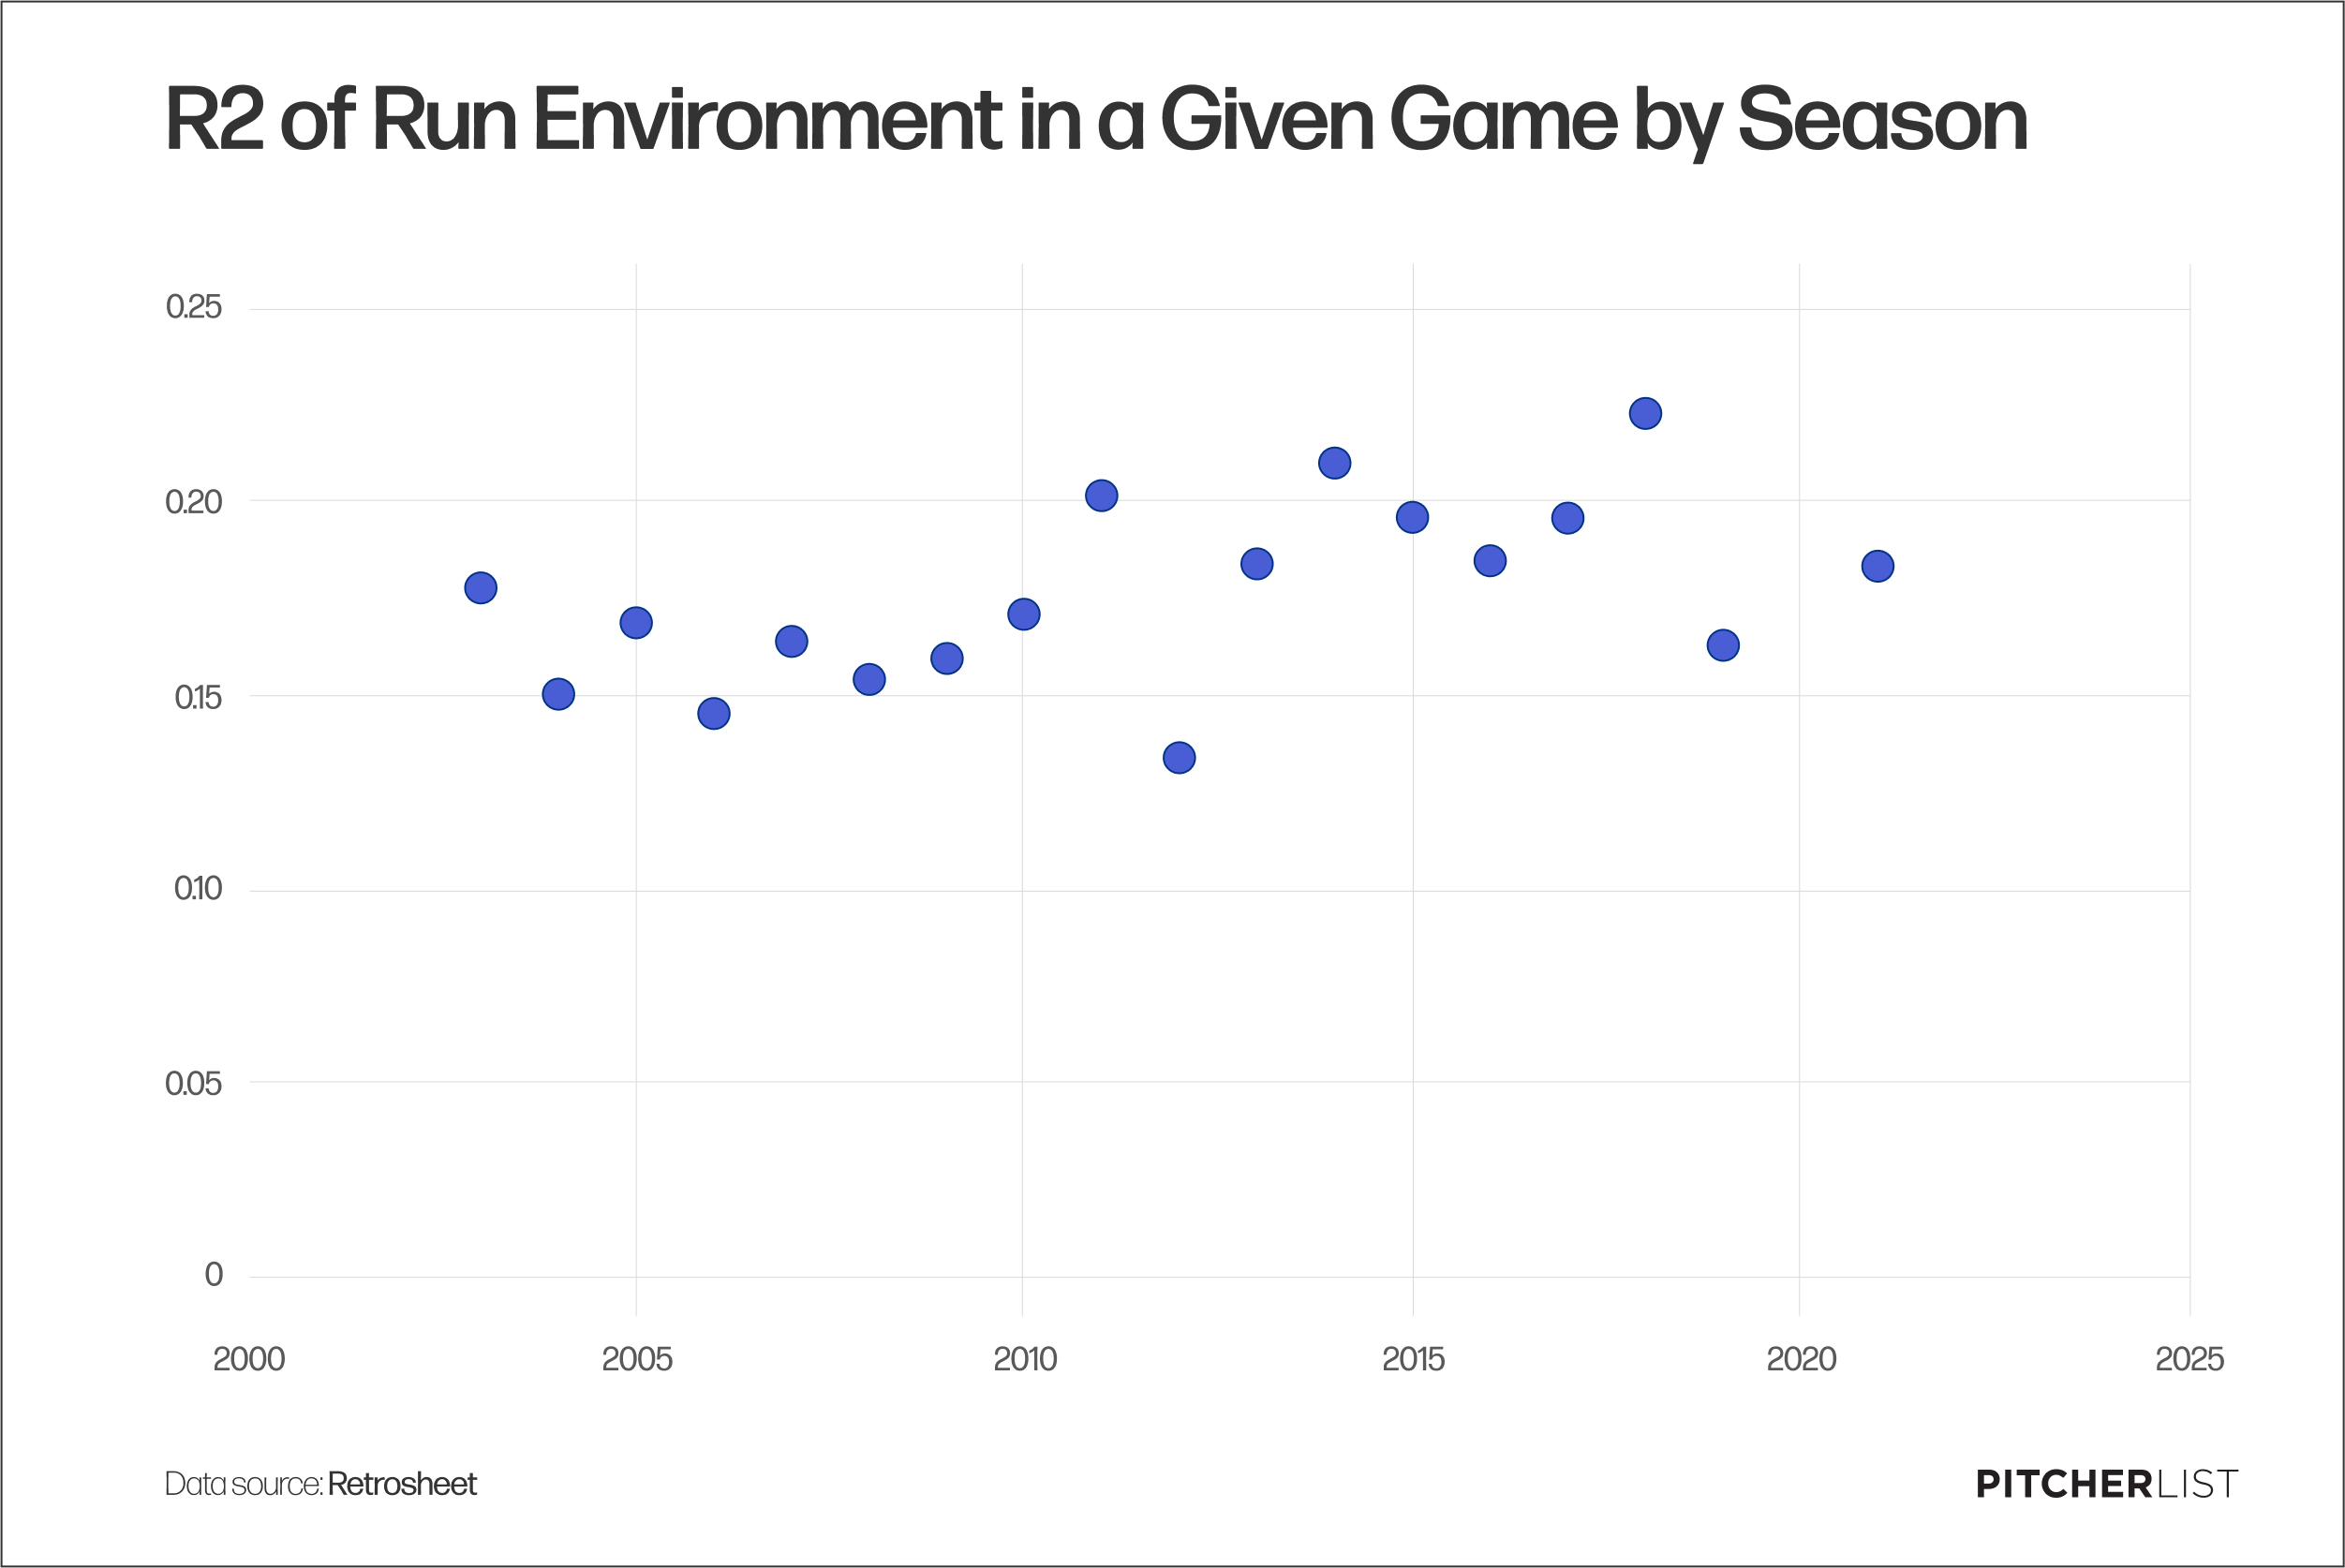
It may appear that the effect a run environment has in a given year will trickle down to an individual game, but that isn’t the case here. Individual games have a higher degree of variance, making the outcomes more random than across a full season. For this specific segment, I will only be utilizing run differentials. Tracking the variance of wins/records on an individual game outcome makes little sense in answering for the effect of the run environment. When using just runs, I was able to measure the amount of variance in the run differential that was owed to the total score of each individual game. Below are the results, summarized by season.
Created by @visual_endgame on Instagram and Twitter.
There are many important things to note from this graphic. The range of R2 scores spanned from .134 to .223, both very small numbers when the gold standard of a strong relationship between two factors tends to be in the .70s or above. At its biggest effect (from this data) on a given game in 2018, 22.3% of the varying run differential could be owed to the number of runs scored in that game. At its lowest point for a given game in 2012, only 13.4% of the varying run differential could be due to the total amount of runs scored in a game.
Despite both being small factors, throughout an entire season, these varying effects of the run environment on run differentials could indicate a change in the game environment by MLB. Many changes to the game are often not publicized, meaning that they are only noticed if a new trend emerges. If some seasons’ games’ run differentials are noticeably more due to the number of runs scored, it could be owed to one of those silent MLB changes. Further research would need to be done on this, which is admittedly outside the scope of this article — yet, a factor like this definitely needs to be investigated as to whether it could serve as another possible warning flag.
Application
Despite the variance in average differentials in a given season being owed highly to run environment, on an individual game basis, it has very little effect. Run Environment is essentially a negligible factor in said games. It may be worth considering when calculating the likelihood of a score difference between two teams, but it is far from the driving factor in deciding the outcome.
How Teams Should Act Based on Conclusions
Now, I will propose a couple of guiding thoughts that I believe teams could benefit from adhering to in certain run environments. This is not meant to identify the traits that certain teams exhibit and benefit from in these situations (which deserves an additional piece), but rather just point out a few factors that teams should consider when making roster decisions.
- Run Environment Logic applies to Portfolio Theory, not Game Theory.
- If you’re not familiar with portfolio theory, don’t worry – it is mainly used as a financial theory. It means that there is a mathematical way to maximize returns at certain levels of risk. Applied to baseball, it means that there are certain assemblies of players that can maximize runs at given levels of risk. Knowing that individual game score has little effect on run differentials, it makes the aspect of game theory inapplicable. Instead, it more closely aligns with Portfolio Theory. Knowing that in certain environments specific teams will benefit or worsen, those teams can accordingly buy or sell players (scale up or down their investment) to maximize their returns. General Managers, in theory, could differ their bets based on the run environment. The teams would also need to accurately predict the run environment to a certain extent, which is extremely difficult. If they can, teams would surely benefit by readjusting their portfolio.
- Struggling teams should not spend any excess during High Run environments.
- As I’ve highlighted heavily on in this article, I believe run differentials to be more telling of competitive balance than the standard deviation of winning percentage. If the average run environment is higher, one can almost assume that better teams will more easily wallop worse teams. There is less chance involved, making any type of bet by smaller teams to play on the chance become futile. Worse teams would be better suited by betting big when they can play in a low-run environment, where they have a better chance of stealing games.
- Teams should factor in a higher degree of chance in Low Run Environments.
- When the run environment is down, run differentials are down (during the span of an entire year). When run differentials are down, competitive balance is up, making it easier for bad teams to beat better teams. This introduces a whole new incentive for worse teams to bet bigger at certain times. If said teams know that a flyer on a random free agent is likely to lead to success in certain environments, they can act accordingly. Hence, they could exploit advantages to yield a better team.
Conclusion
As the run environment changes, the game itself changes. Different plans of action don’t lead to the same results as expected. Some teams get luckier than others. But with a better glimpse of what to expect from certain changes in the run environment – fans, teams, and analysts could better understand the odds of certain situations, as well as how to navigate them.
By looking at general seasons, the run environment plays a big part in run differentials, but not very much in win percentages. For each individual game, the total runs scored have very little effect on run differentials. With that knowledge, teams can utilize better strategies in the aggregate, deciding to spend on players when it would be more advantageous (or at least in theory) for them. While I know optimization is possible through this type of angle, the extent of possible value-added is a mystery to me (for now). Despite this, the ability to define the different effects of the run environment on baseball itself will hopefully lead to further study, paving the way for deeper identification of market inefficiencies in this area of the sport.
Photo by Mika Baumeister/Unsplash | Featured Image by Ethan Kaplan (@DJFreddie10 on Twitter and @EthanMKaplanImages on Instagram)