


Following Tyler O’Neill’s underwhelming 2018-2020 (92 wRC+), his emergence as a top 10 hitter (144 wRC+) in 2021 is difficult to evaluate. While his speed and power are certainly well-established, there are good reasons to question the sustainability of his breakout. O’Neill’s track record and elevated K% scream significant regression. And yet, his 450 plate appearances from ’18-20 and 537 plate appearances in ’21 suggest that the left-fielder may just be settling into the league. As of today, both Steamer and ZiPS project that O’Neill will remain a plus bat in 2022, but also deviate from each other in significant ways:
Although the ZiPS and Steamer formulas are proprietary, we can see that both models anticipate regression for different reasons. ZiPS is less optimistic about O’Neill’s K% and BB%, but believes in O’Neill’s power. Whereas, Steamer is slightly more optimistic about his approach at the plate and less optimistic about his power. Both projections also anticipate significant drop in BABIP, though Steamer much more so. This makes good sense, since O’Neill carried the fourth highest BABIP (.366) in baseball in 2021 and a high line drive rate (23%). Line drives are a beneficial kind of batted ball, but they aren’t very consistent year to year.
All that said, because O’Neill beat every major projection system throughout the 2021 season, it’s worth looking for signs of hope. Regression models are one of the best methods we have for projecting future performance, but if the Cardinal does this again, what might have portended it? A deep dive into the left-fielder’s plate discipline and batted ball profile indicates plausible reasons for optimism on both fronts.
Plate Discipline
O’Neill’s profile includes a good amount of swing and miss, so a high K% will almost certainly remain a significant part of his game, but if we look closely at his 2021, there are some real signs that O’Neill might reach another level in terms of BB%.
Let’s start by looking at O-Swing%, a stat that measures how frequently a batter swings at pitches outside of the zone. As we might suspect, a lower O-Swing% carries a sizable correlation with higher BB%. What’s especially interesting about O-Swing%, though, is the fact that it incorporates a judgement call about what is or isn’t inside the strike zone. That judgement call isn’t as straightforward as you might think.
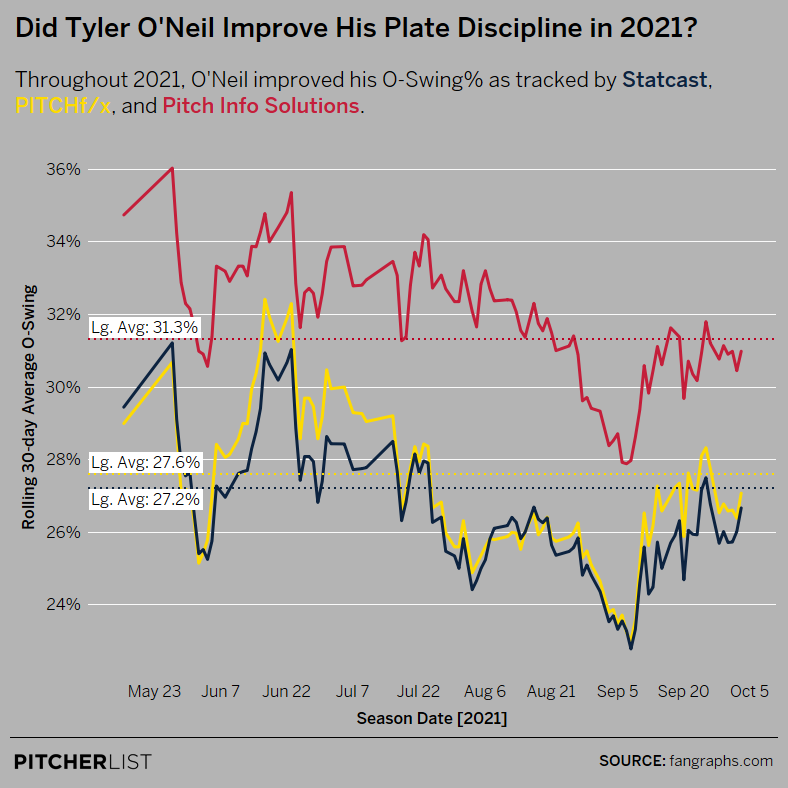
In fact, Fangraphs carries three different measures of O-Swing% taken from three different sources: Baseball Info Solutions’s “Pitch Info”, PITCHf/x, and Statcast. PITCHf/x, the data used on the MLB Gameday App, and Statcast tend to be very close to one another and use similar methods built on different tracking technologies. Pitch Info, however, uses collected data that has been combed over by human analysts. The results are, for the most part, very similar. Pitch Info tends to correlate slightly more tightly with BB% than the others (I suspect this is due to correction toward in-game calling), but all three create a similar distribution. In some cases, though, the results are strikingly different, as in the case of Tyler O’Neill:
Although each statistic shows a similar picture, looking at the PITCHf/x and Statcast data suggests that Tyler O’Neill may have sustained more of the plate discipline he developed in 2020 through the course of the 2021 season. These sources also suggest that O’Neill’s 2020 improvements may have been much greater than Pitch Info would suggest. Why does all of this matter? Every source shows marked improvements in 2020-2021 and where there is variance it is toward greater plate discipline. If O’Neill maintains this approach, he will sit closer to league average O-Swing% than he had in 2018-2019. We likely won’t see O’Neill repeat his 2020 figures, especially given the sample size, but if this is a genuine skills change, the slugger may not regress closer to his early career numbers.
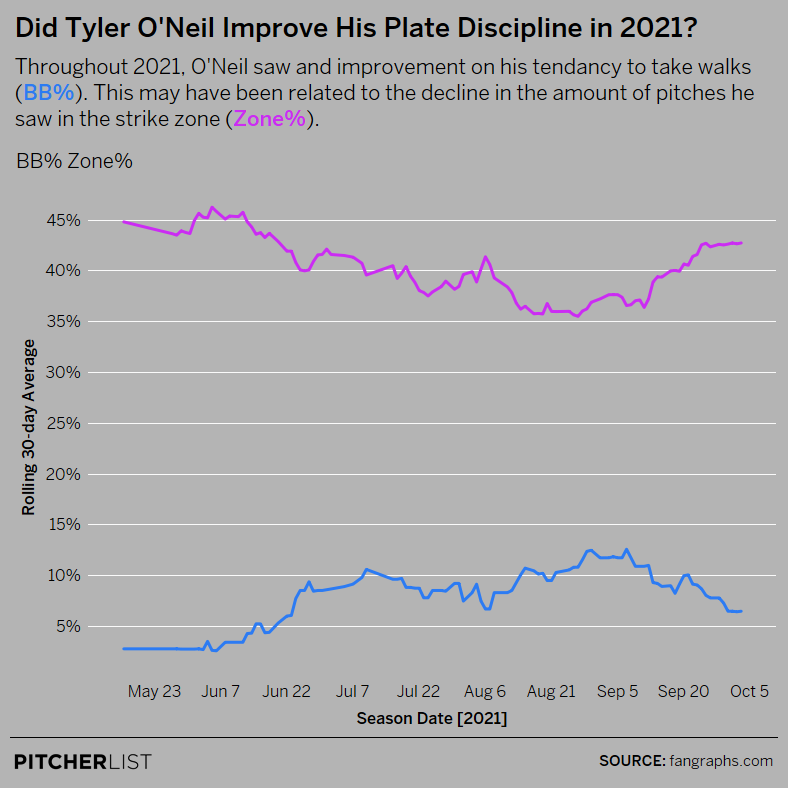
O’Neill’s plate discipline being what it is, we can suspect, along with Steamer and ZiPS, that O’Neill’s walk rate will remain at or slightly above 7.1%, the number he posted in 2021. But the increased discipline may also portend additional gains in walk rate, if the second half of 2021 tells us anything about how pitchers will plan to attack the emerging power threat. Below is a rolling graph of O’Neill’s walk rate compared to his Zone% (Pitch Info), a measure of what percentage of pitches were thrown to O’Neill in the strike zone:
Data Visualization by @Kollauf on Twitter
As is evident from the graph, pitchers adjusted to O’Neill in the second half of the season by throwing fewer pitches in the strike zone, and O’Neill’s newfound discipline allowed him to consistently post a 10-12% walk rate during this time. In the final month of the season, pitches found more of the plate, and O’Neill’s walk rate dipped. But this dip could deceive us into thinking O’Neill’s discipline was regressing. The numbers say quite the opposite. O’Neill’s chase rate sat at or below league average in the second half of the season:
Data Visualization by @Kollauf on Twitter
What happened in September? The answer is pretty straightforward– O’Neill simply punished pitchers for giving him the opportunity to hit, crushing 13 home runs and posting a remarkable .731 SLG in Sep/Oct. In short, Tyler O’Neill’s second half might suggest a prized double threat: a slugger who punishes pitches in the zone, but doesn’t excessively expand his regular zone when pitchers attempt to pitch around him.
Batted Balls
A key piece of this double threat is, of course, whether or not O’Neill can continue to punish pitches in-zone. This brings us to the second topic of consideration: O’Neill’s batted ball data. As I mentioned above, projections tend to predict that O’Neill’s luck won’t last after posting a high BABIP and line drive rate.
Is there more to his story? A cursory look at O’Neill’s career suggests there might be. Despite a slow start to his career, O’Neill has a career .488 wOBAcon due to his combination of power and speed. That’s good for 8th best in baseball since he entered the league in 2018, tied with Ronald Acuña Jr. In other words, over the course of his career, when O’Neill puts the ball in play, his production is elite.
A deeper look at the Cardinal’s 2021 campaign suggests that his quality of contact might be relatively sustainable. Two key ways we can analyze batted ball skills are dynamic hard hit rate (DHH%) and launch angle standard deviation (sdLA). DHH% is a stat developed by Connor Kurcon, based on the insight of Tom Tango. In DHH%, hard-hit rates are weighted by launch angle because poorly/under batted ball quality correlates well with future wOBAcon. This correlation suggest a certain level of projectable skill for hitters who regularly miss barreling the ball by a small margin.
Tyler O’Neill’s 2021 ranked 4th in baseball in DHH% among hitters with a minimum of 20 BBE, behind only Mike Zunino, Ronald Acuña, and Miguel Sanó.
This top 25 is impressive, but it also shows that not all players who demonstrate this particular skill are complete hitters. What this does tell us is that Tyler O’Neill’s career wOBAcon isn’t simply a coincidence. If we expand our time frame so that it begins in 2019, Tyler O’Neill sits at 10th among hitters with minimum 50 BBE. The batted ball “luck” is very likely here to stay.
This is also supported when we look at sdLA, popularized by Alex Chamberlain. This stat measures the “tightness” of a player’s launch angle, i.e. it shows whether a player’s average launch angle is the result of a consistent approach or merely the product of batted balls that significantly vary in quality. When a player posts a relatively tight launch angle over the course of a large sample, it suggests that the player’s average launch angle is the result of consistency in their batted ball skills. In this way, as Chamberlain suggests, sdLA helps us identify the quality of a player’s hit tool.
Now, Tyler O’Neill is by no means a high-contact hitter, but you may be surprised to find out that in 2021 he posted a sdLA of 27.6°, good for 8% lower than league average in 2021 among hitters with a minimum 50 BBE, essentially tied with players like DJ LeMahieu (27.7°) and Nico Hoerner (27.7°) with well-known hit tools. While for these two, a tight launch angle means consistent ground ball trouble because of a low launch angle, for O’Neill, this tightness is displayed in consistent lift (17.8° in 2021).
TON’s Authority
Although standardized regression models have good reason to show skepticism, Tyler has shown signs of significantly improved plate discipline which he coupled with an elite batted ball profile. Fantasy players might still find that hype brings too inflated a price given the risk, but Cardinals fans should be excited, because Tyler O’Neill has learned to hit with a TON of authority.
Featured image by Doug Carlin (@Bdougals on Twitter)
Grant, this is really good stuff! Ottoneu huh, what’s your screen name there?