


I’m a fan of projections. I tend to believe that Steamer and ZiPS and probably a dozen other projection systems can do a better job across a few thousand Major and Minor League players than me.
I also believe there are cases where a projection system doesn’t know a key piece of data. A pitcher whose decreased velocity was due to playing through arm discomfort that is now behind them. A hitter whose newfound exit velocity is the result of a changed stance, not just random fluctuations over a career.
One case, unique to the 2020 season, is the lack of traditional Spring Training. Teams did not get to play a full Grapefruit or Cactus League schedule, which means players arrived at Opening Day without the typical opportunity to face live opponents.
While, even without live competition, pitchers can work on pitches and measure things like velocity, movement, location, and break, hitters were in a tough spot. You can’t get your timing down for a 100 mph fastball with movement until you face a 100 mph fastball with movement. You can’t adjust to a big-league curveball until you see a big-league curveball. Hitters may have been at a disadvantage.
League-wide stats suggest there may have been an effect here, but a small one:
| Year | League-Wide wOBA | First 14 Days wOBA | Difference |
| 2020 | .320 | .306 | .014 |
| 2019 | .320 | .314 | .006 |
| 2018 | .315 | .306 | .009 |
| 2017 | .321 | .307 | .014 |
| 2016 | .318 | .310 | .008 |
| 2015 | .313 | .302 | .011 |
| 2015-19 Avg | .010 |
The first two weeks of 2020 were, in fact, tougher on hitters than the typical year, but not exactly an outlier, as hitters appear to have been just as far behind in 2017. That said, we know that individual players are impacted differently by issues like this, and it stands to reason that some hitters really missed that extra game experience.
For example, Marcus Semien, commented after an August 7th walk-off hit that he was, “struggling with [his] timing.” In a July 14 “Summer Camp” game, Christian Yelich was mic’ed up and talked about his timing being off and “trying to figure it out.”
The issue for someone like me, who likes to rely on projections as much as possible, is that the projection systems just see that Semien and Yelich had a down year at the plate. They don’t account for the lack of Spring Training and that Yelich was struggling with his timing. They could see that he had a slow start, with a -51 wRC+ (yes, that is negative 51) as of August 1, and a 133 wRC+ after, but the projection system doesn’t differentiate that -51 stretch from any other -51 stretch.
I am typically not a fan of saying, “well, except for that one game or that one week or that one month” to give a guy a mulligan, but if there is a good explanation—for example, a player using regular-season games as a kind of extended Spring Training to get their timing down – it can be informative.
So what if we gave a ~two-week mulligan to some hitters? If we found hitters whose overall 2020 lines look mediocre or worse, but only because they are being weighed down by the first week or two when they were effectively playing through spring training?
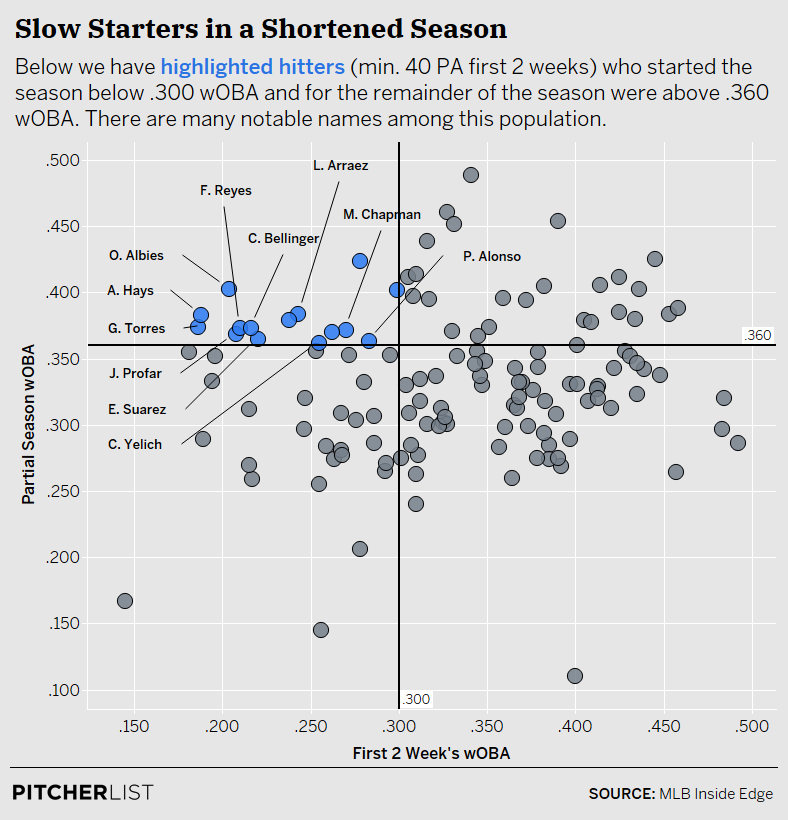
Data Visualization by @Kollauf on Twitter
In addition to the sub-.300 wOBA start and better-than-.360 wOBA finish, we’ll add a third criteria: a wOBA under .345 for the season as a whole. Why those benchmarks? They are admittedly chosen somewhat at random, but:
- Less than .300 is bad. Really bad. Bad enough to skew your season line bad. Bad enough that in 2019, over a full season, only seven qualified hitters posted a wOBA below .300 and only three of them got a chance to play in more than half their team’s games again in 2020.
- Greater than .360, on the other hand, is good. Really good. Enough that fantasy managers take notice, draft position improves, and we start seeing articles like, “Is this player’s breakout going to stick?” In 2019, 45 qualified players had a .360+ wOBA, so we are talking about bats you rely on as top 3-4 on a fantasy team, depending on league size.
- Less than .345 gets you closer and closer to average. Out of the 135 qualified bats in 2019, about half (65) were above .345 and about half (70) were below. Below .345, you get questions about why a star fell off so much (see 2019 Jose Ramirez and his .334) and less established players don’t really pop.
These are our “maybe they just needed Spring Training” candidates. Players who, if we assume the first two weeks were just noise, might look really different as we project 2021.
| Player | First Two-Weeks wOBA | Rest of Season wOBA | Full-Season wOBA |
| Ozzie Albies | .204 | .403 | .329 |
| Luis Arraez | .243 | .384 | .335 |
| Austin Hays | .188 | .383 | .315 |
| Gleyber Torres | .186 | .374 | .326 |
| Franmil Reyes | .210 | .373 | .341 |
| Cody Bellinger | .216 | .373 | .337 |
| Matt Chapman | .270 | .372 | .335 |
| Jurickson Profar | .208 | .369 | .333 |
| Eugenio Suarez | .220 | .365 | .332 |
| Pete Alonso | .283 | .363 | .342 |
| Christian Yelich | .255 | .362 | .343 |
There’s Yelich, with a nice recovery after struggling with his timing. Semien just barely missed this list, as his .333 wOBA after the first two weeks wasn’t good enough, but he still made massive strides after posting a .194 wOBA the first two weeks. Now let’s take a closer look at those 11.
Albies is a near-perfect case to start with, as he exactly demonstrates what we are looking at. His big 2019 made his 2018 look like an aberration, suggesting the young 2B was on his way to stardom. His 2020 appears to cast doubt on that.
| Year | PA | wOBA | wRC+ |
| 2017 | 244 | .347 | 111 |
| 2018 | 684 | .324 | 101 |
| 2019 | 702 | .354 | 117 |
| 2020 | 124 | .329 | 103 |
He starts to look more up-and-down, with a 946 very good PA in 2017 and 2019 and 808 more average PA in 2018 and 2020.
But in 2020, Albies suffered wrist discomfort in Summer Camp, fought his way through the first 11 games of the season (posting that awful .204 wOBA in the process), but never got his stroke right. What if we just ignore those first 11 games, before he was able to get right?
| Year | PA | wOBA | wRC+ |
| 2017 | 244 | .347 | 111 |
| 2018 | 684 | .324 | 101 |
| 2019 | 702 | .354 | 117 |
| 2020 | 78 | .403 | 152 |
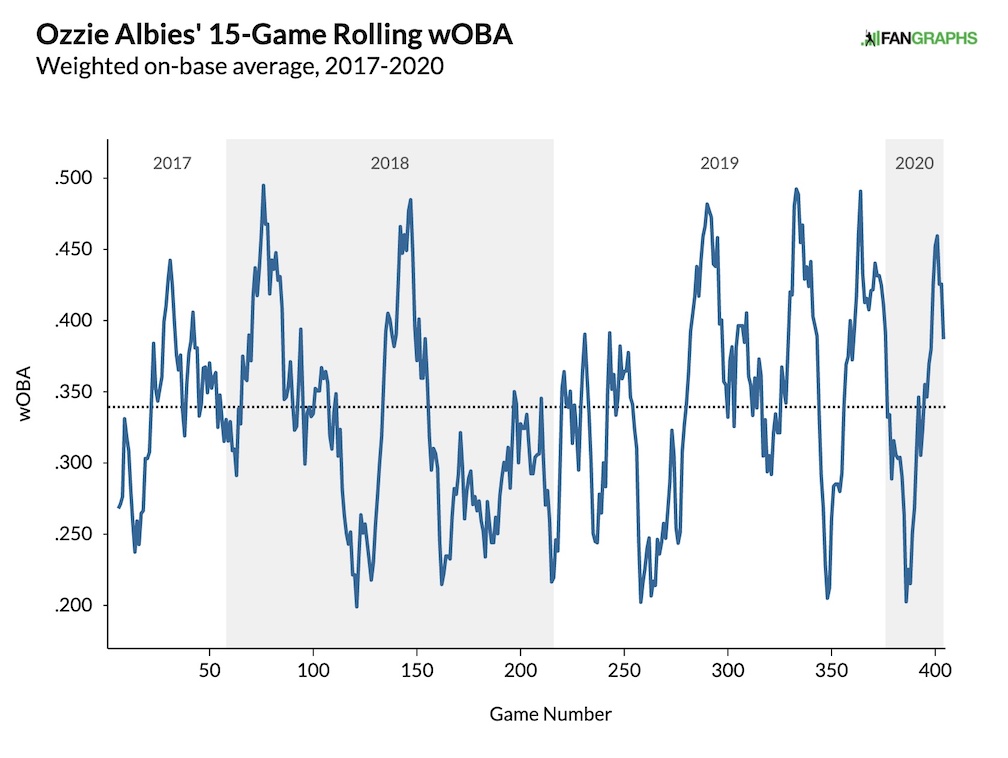
We’d call that .403/152 too small a sample to suggest a new talent level, but it would completely change the perception of his season and his career arc. Looking at a graph of 15-game rolling wOBA for his career, Albies 2020 looks more like an extension of his 2019 than a return to his 2018, when he had an extended downturn late in the year.
Albies Steamer projection (.342 wOBA) would be lower than his 2017 or 2019 seasons, and I think that is too pessimistic. It seems fantasy players are mostly ignoring his 2020 – Albies 2020 NFBC ADP was 36.4; this year it is 32.2, and that seems like the right bet. I think taking him late 3rd in a 12 player draft is a great get, and I wouldn’t hesitate to take him earlier, as I think there is upside that is being hidden by 46 bad PA.
Luis Arraez wanted to make a run at a .400 average in the shortened 2020 season and he seemed like a prime candidate to achieve that feat. But, like Albies, Arraez struggled with a joint issue in Summer Camp (his knee, not his wrist), limiting an already-limited ramp up, and started ice cold. As a result, he appeared to take a step back from his rookie campaign. But after those first couple weeks, he did, in fact, keep his average within sniffing distance of .400.
| Dates | Avg | BABIP | wOBA | wRC+ |
| 2019 | .334 | .355 | .360 | 125 |
| Through 8/5/20 | .216 | .229 | .243 | 48 |
| After 8/5/20 | .373 | .418 | .384 | 145 |
| 2020 Total | .312 | .353 | .335 | 111 |
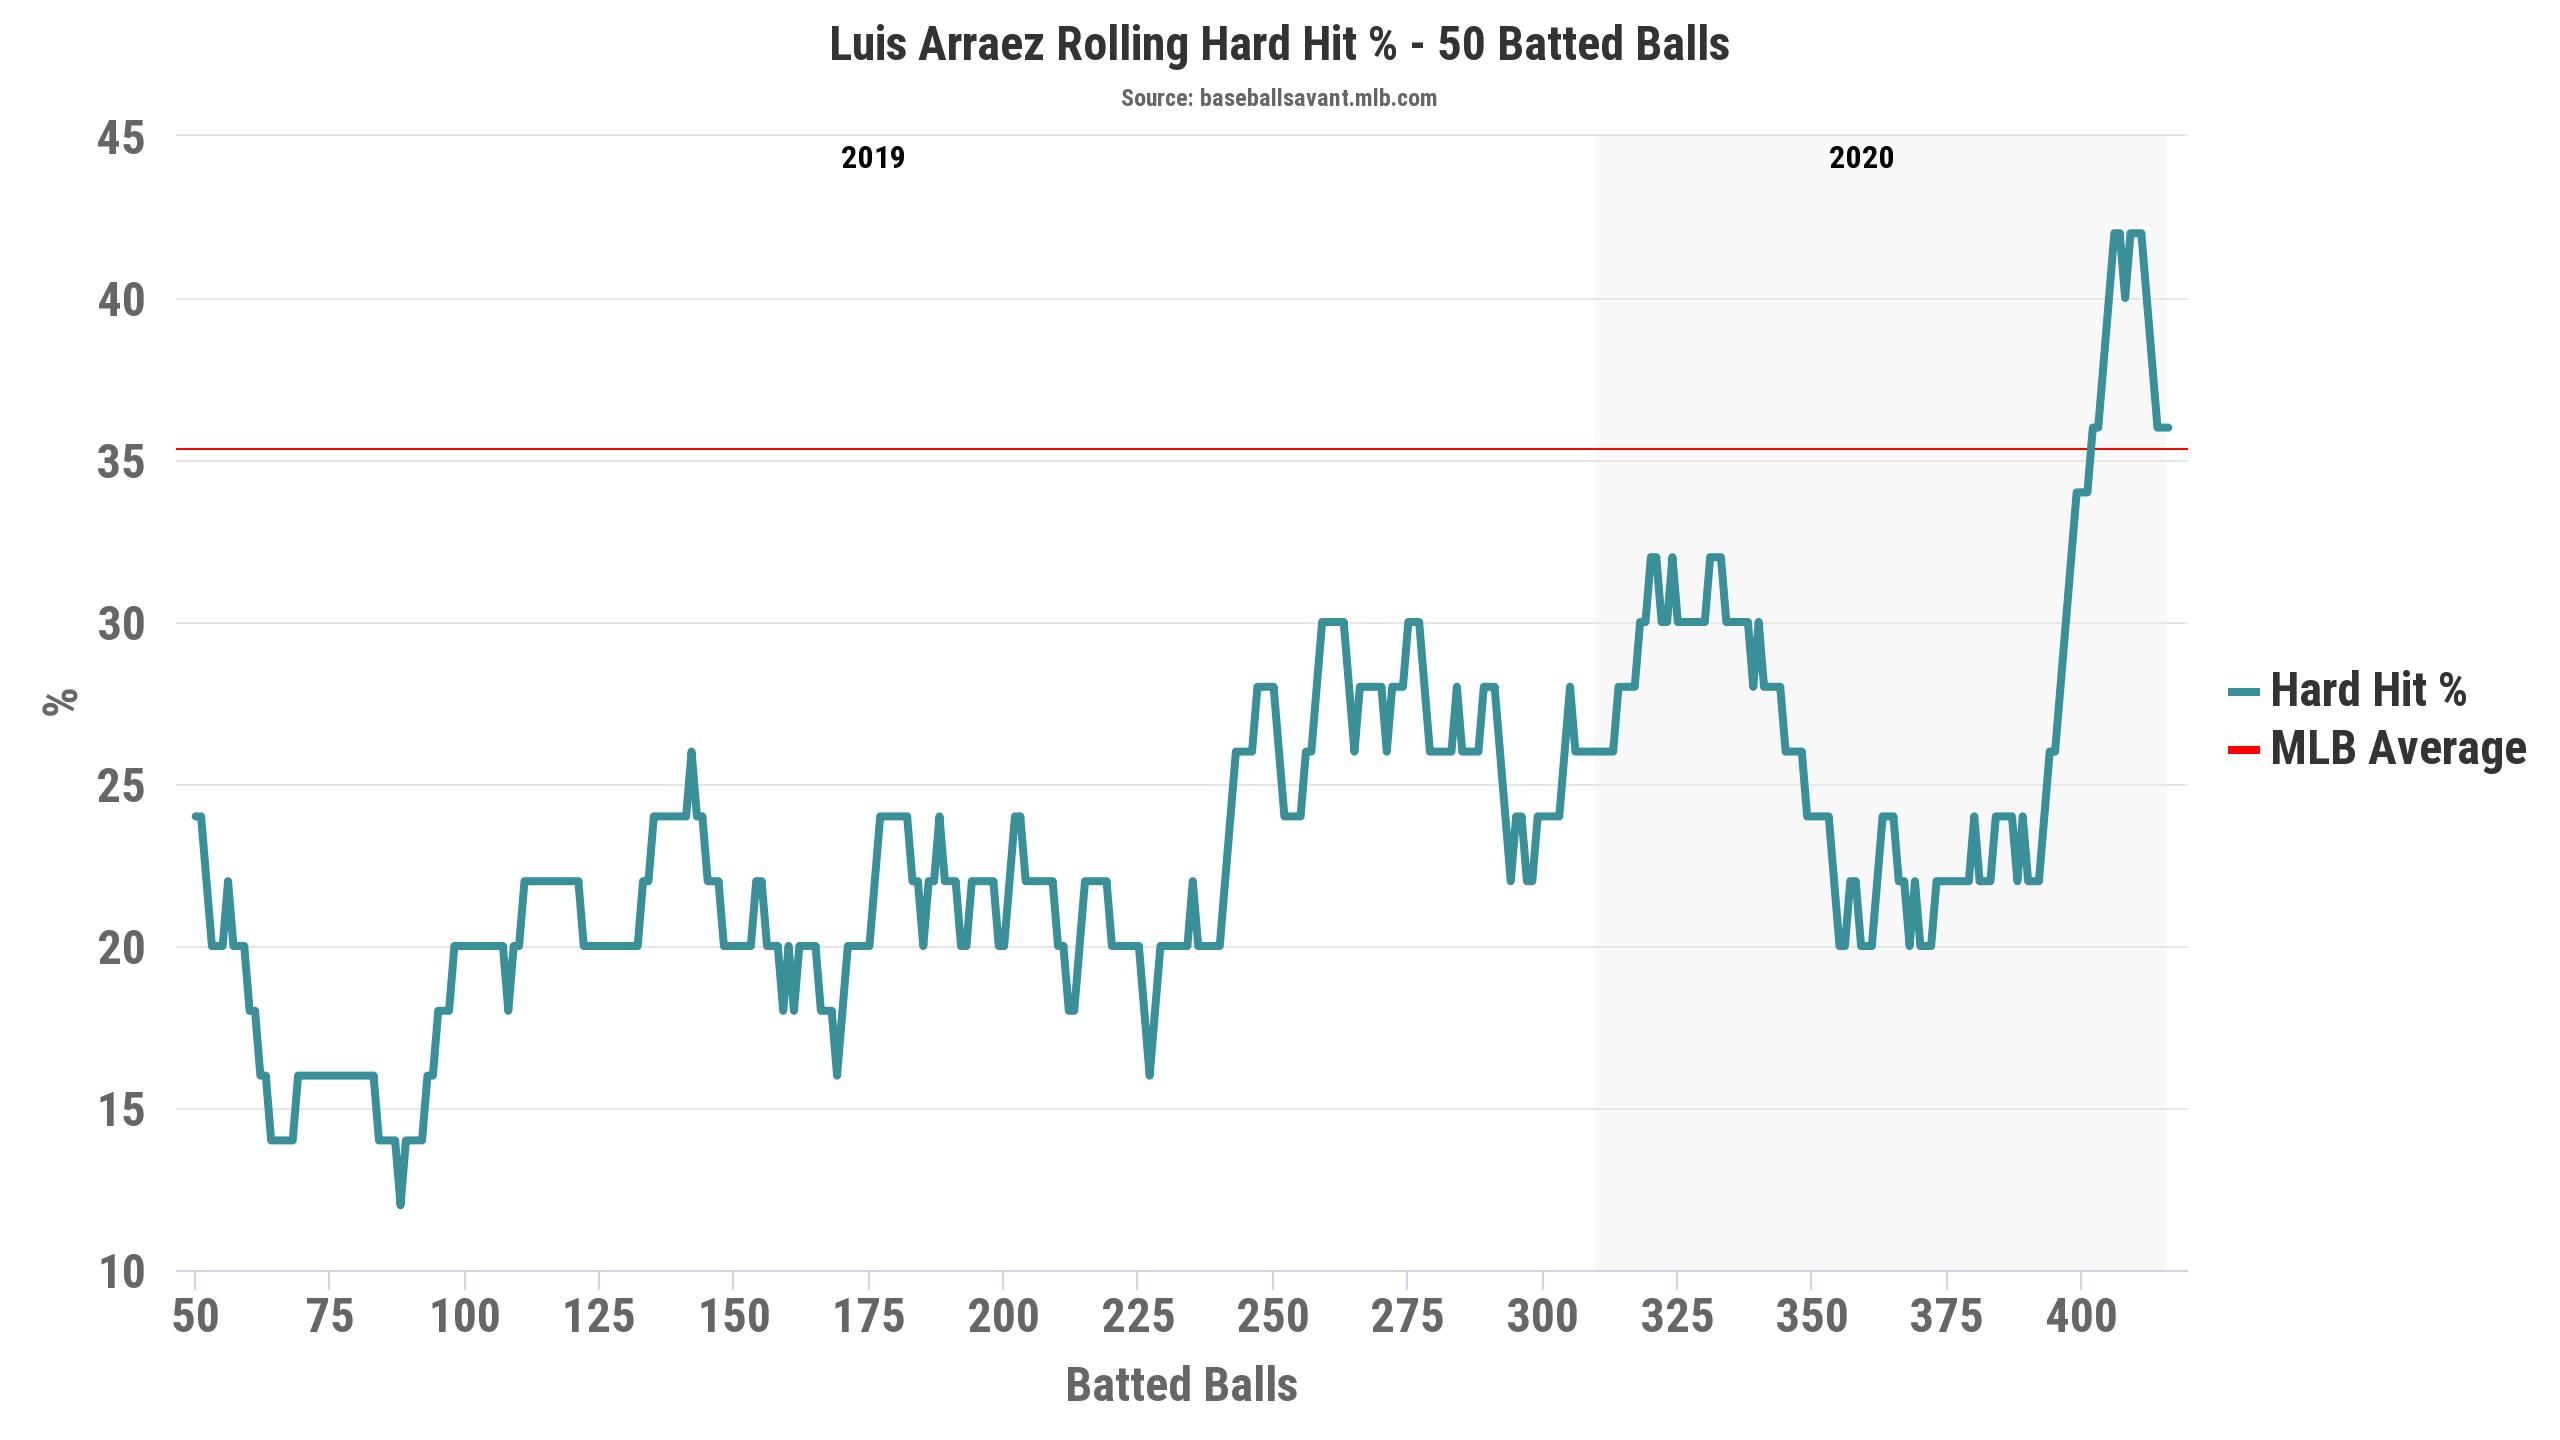
Arraez puts the ball in play a ton, with just a 9.0% walk rate, an 8.9% strikeout rate, and four home runs in 487 plate appearances over his career, so he is going to be BABIP-dependant, and it shows. But he also made better contact in 2020. His xwOBA, xwOBACon, hard-hit rate, sweet spot rate, average exit velocity, and barrel rate all improved in 2020 vs. 2019. Looking at a rolling 50 batted ball hard-hit rate, you can see how he made better contact as 2019 went along and seemingly maintained those gains in 2020. That drop in 2020 still stays up above where he was most of 2019.
For anyone who (like me) was down on Arraez going into 2020, his season looks like validation. I worried he couldn’t keep up the BABIP, but even though he did maintain that, his overall line is a big drop. For a guy who is not going to hit for power and is not going to steal you bases, his 2020 just isn’t useful. And sure enough, his ADP has dropped from 246.1 last year to 357.1 this year. Steamer is projecting a .341 wOBA, rather than something closer to his 2019 or his career mark (.354).
I still don’t think Arraez is a great addition to a fantasy team, but the market correction based on his 2020 line is too significant. Without that rough start, he took a big step forward. Even with the rough start, he improved his Statcast profile. His 2020 doesn’t seem like a reason to lower his stock—he’s the same guy today he was after 2019, and maybe a bit better.
Austin Hays is busy stacking small samples on small samples, so there isn’t a ton to look at, but I was high on Hays coming into 2020. His ugly cup of coffee in 2017 was far behind him, his 2019 was short-but-excellent, and he seemed likely to hit at the top of the lineup in Baltimore. And then the bottom fell out.
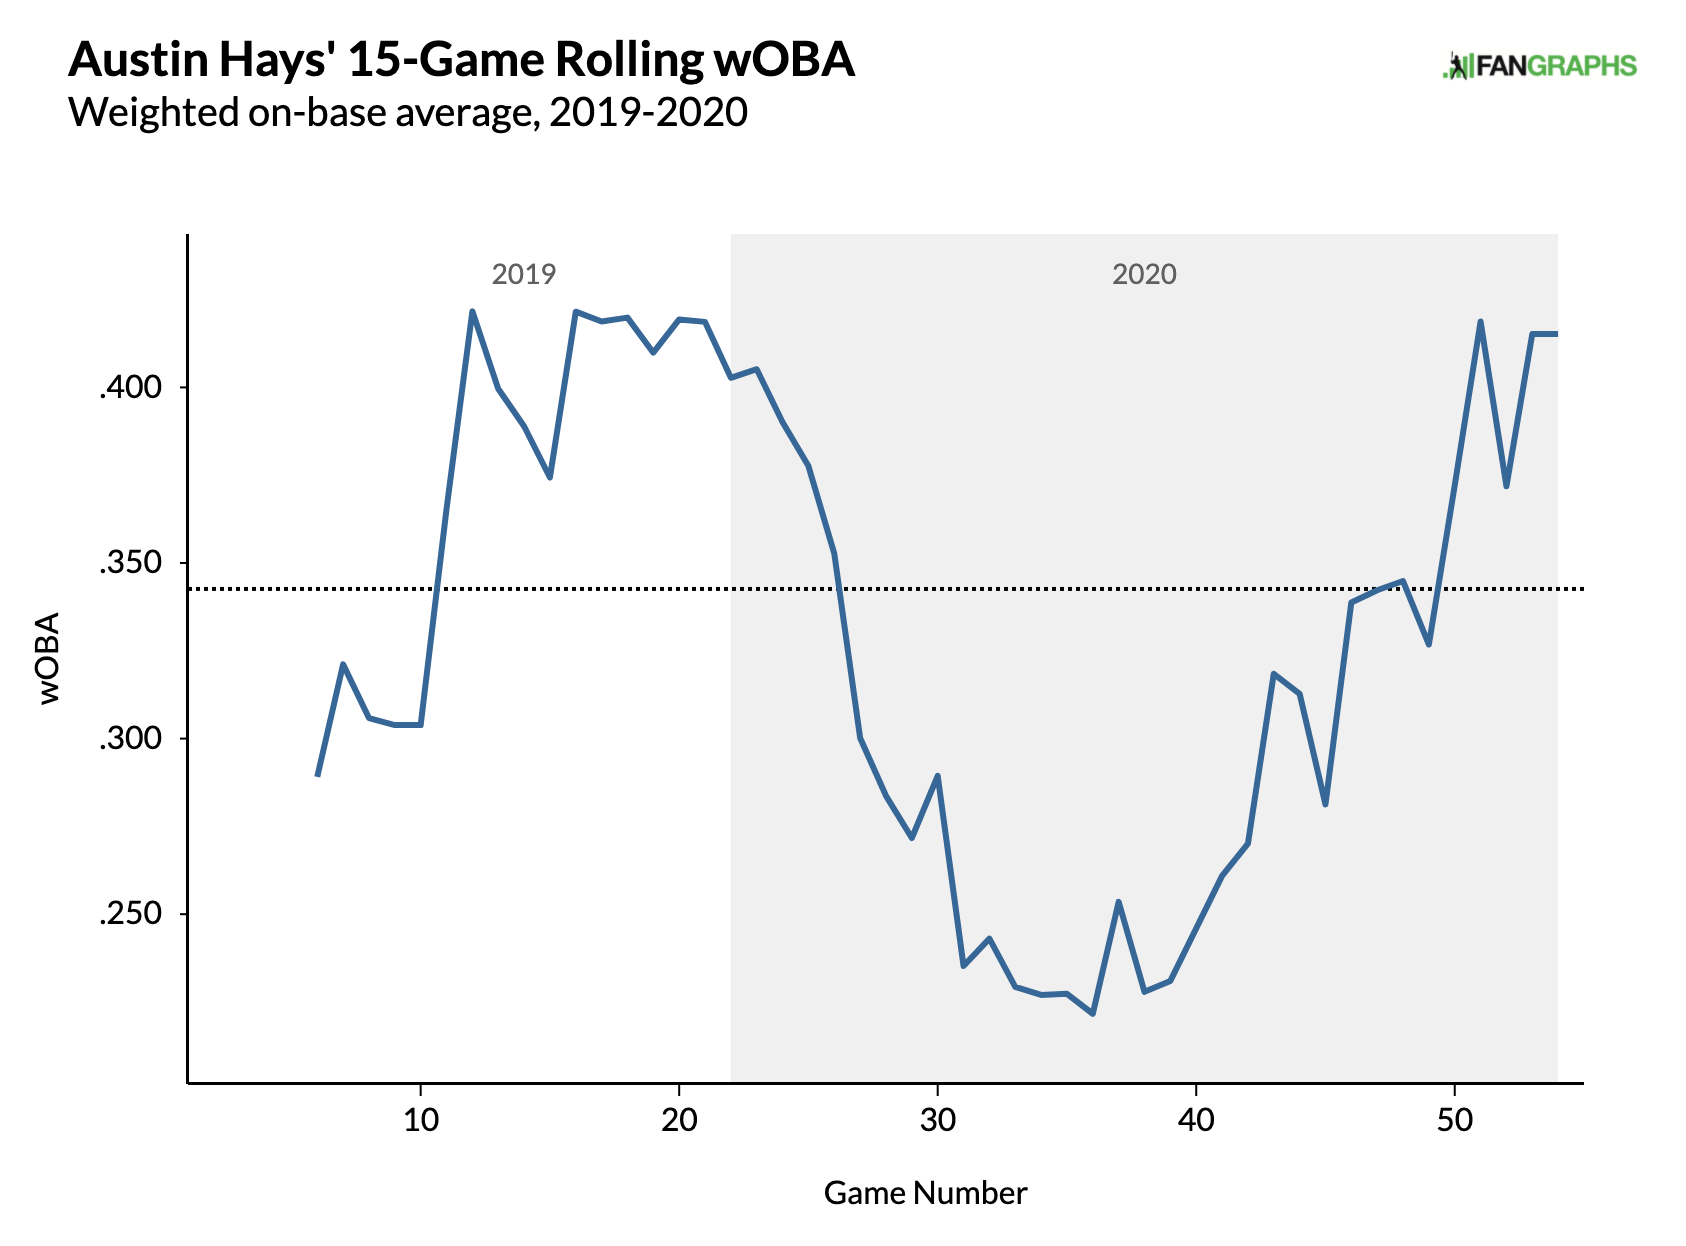
Almost immediately, his wOBA plummeted. As of August 6, it was .188, which is a 10 wRC+, making him 90% worse than league-average. After hitting at a nearly-league-average level the next week (.318 wOBA, 99 wRC+), he broke a rib and hit the IL. When he came back, he hit basically everything else.
It was only 57 PA, but after he returned, he posted a .417 wOBA and 166 wRC+. By the end of the year, he had worked his way back to the top of the Baltimore lineup, and with good reason.
In fact, when you look at that graph above, he basically got himself back to being the exact player he was in that short-but-fun 2019.
Interestingly, Hays has seen his ADP rise this year, going from 259.5 last year to 223.5 this year. But I am still in at that price. Let your opposition look at the .318 career wOBA, the .315 in 2020, or the .314 Steamer projection. It’s only 209 PA, but his .343 wOBA over 2019-20 is intriguing to me. Add in 20/10 HR/SB potential, and I’m happy to take him late in drafts.
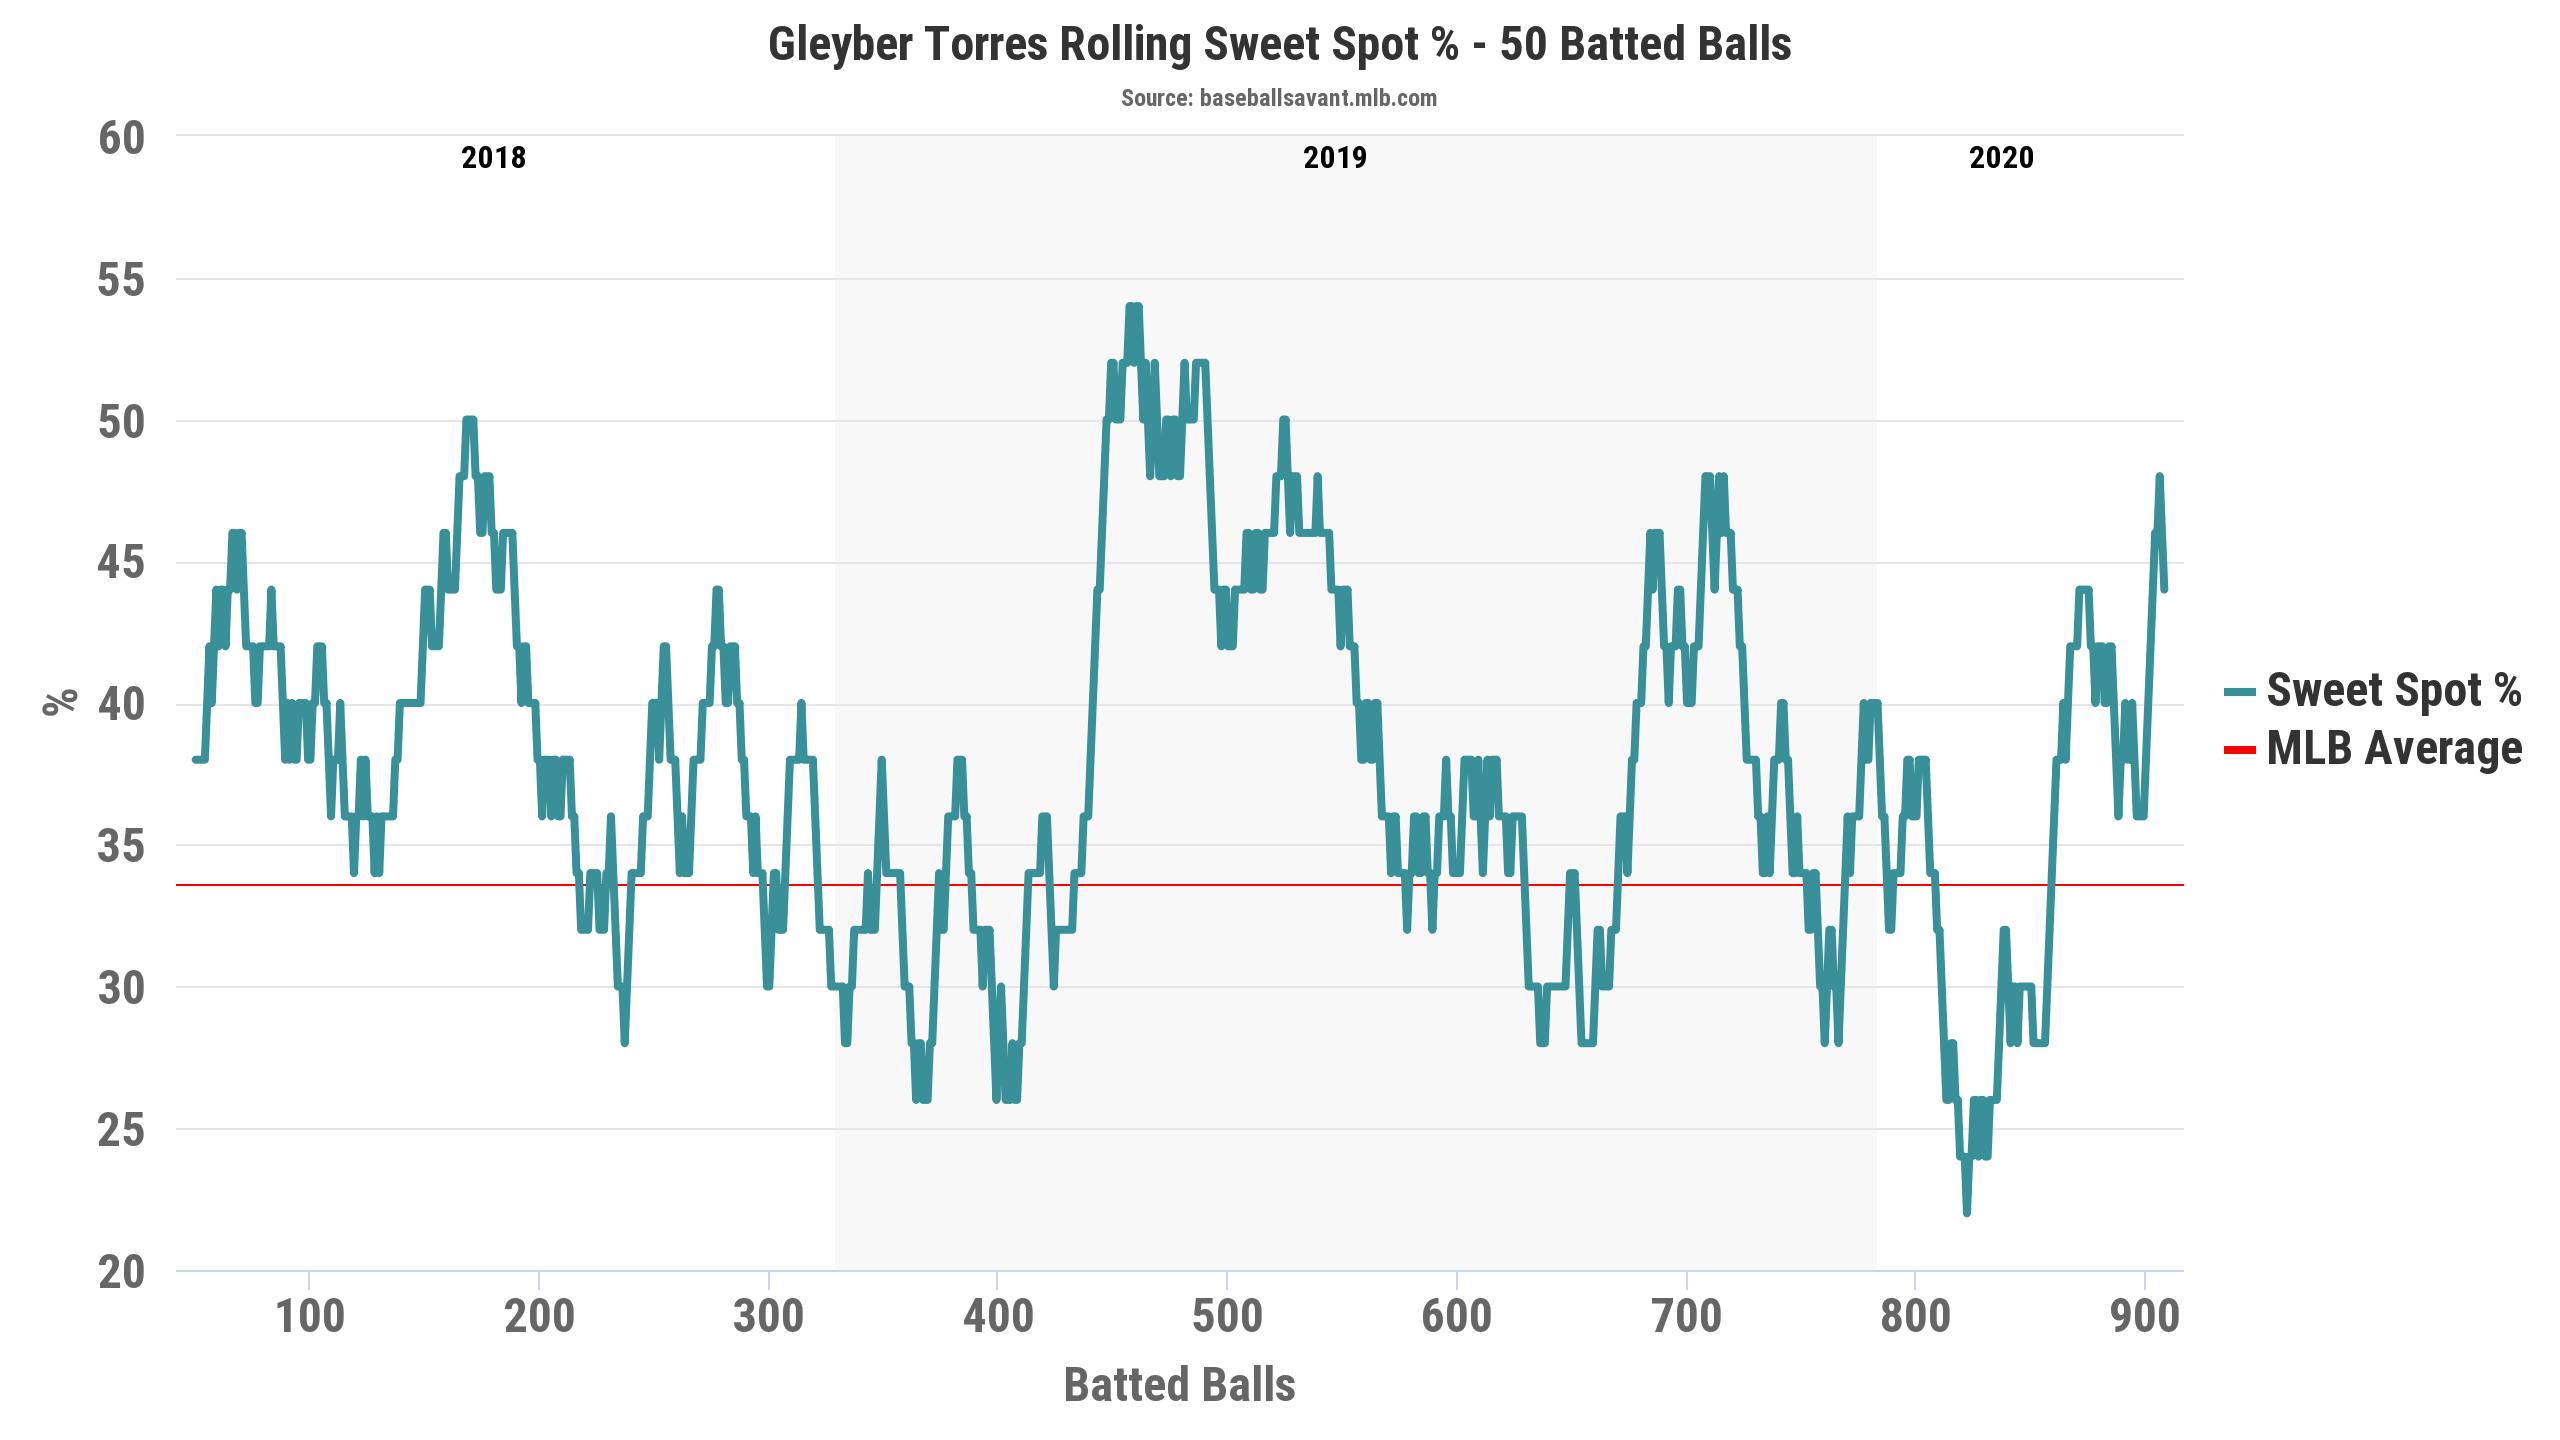
Gleyber Torres is a fun case because fantasy managers are clearly reacting to his 2020. Coming into the year, his ADP was 29.0, this year it is 67.9. His 2020 represents a sizable drop from his 2019 and 2018, weighed down by a really bad start, even by the standards of this list. As of August 7, he had a .119/.178/.190 slash line for a .170 wOBA and a -1 wRC+. After that date? He slashed .298/.426/.447 with a .387 wOBA and 149 wRC+.
Combined, that left him with an underwhelming overall line, but that hid some real improvements. His strikeout and walk rates were both career-bests. His hard-hit rate was up, as well. The challenge seems to have been launch-angle related, as his sweet spot rate dropped. The drop in sweet spot counteracted the increase in hard-hit, leaving him with a big drop in barrel rate.
But by the end of the year, his sweet spot rate was back up.
Call me crazy, but I am not ready to drop a guy from the third to the sixth round of drafts based on a rough 160 PA, especially when it was really just the first 45 PA that were a problem.
Franmil Reyes had a rough go his first couple months in Cleveland after his 2019 trade from San Diego, but while he bounced back from that, he landed closer to his overall 2019 than a full return to what he showed as a Padre. But from August 7 on, he not only recovered but had one of the best stretches of his career. In fact, on September 4, he completed a 25-game stretch with a .494 wOBA, the best 25-game stretch of his career.
Looking at a graph of wOBA on a rolling 15-game basis, you can see that the peak doesn’t look quite as high as 2018, but he sustained that peak much longer than he has before.
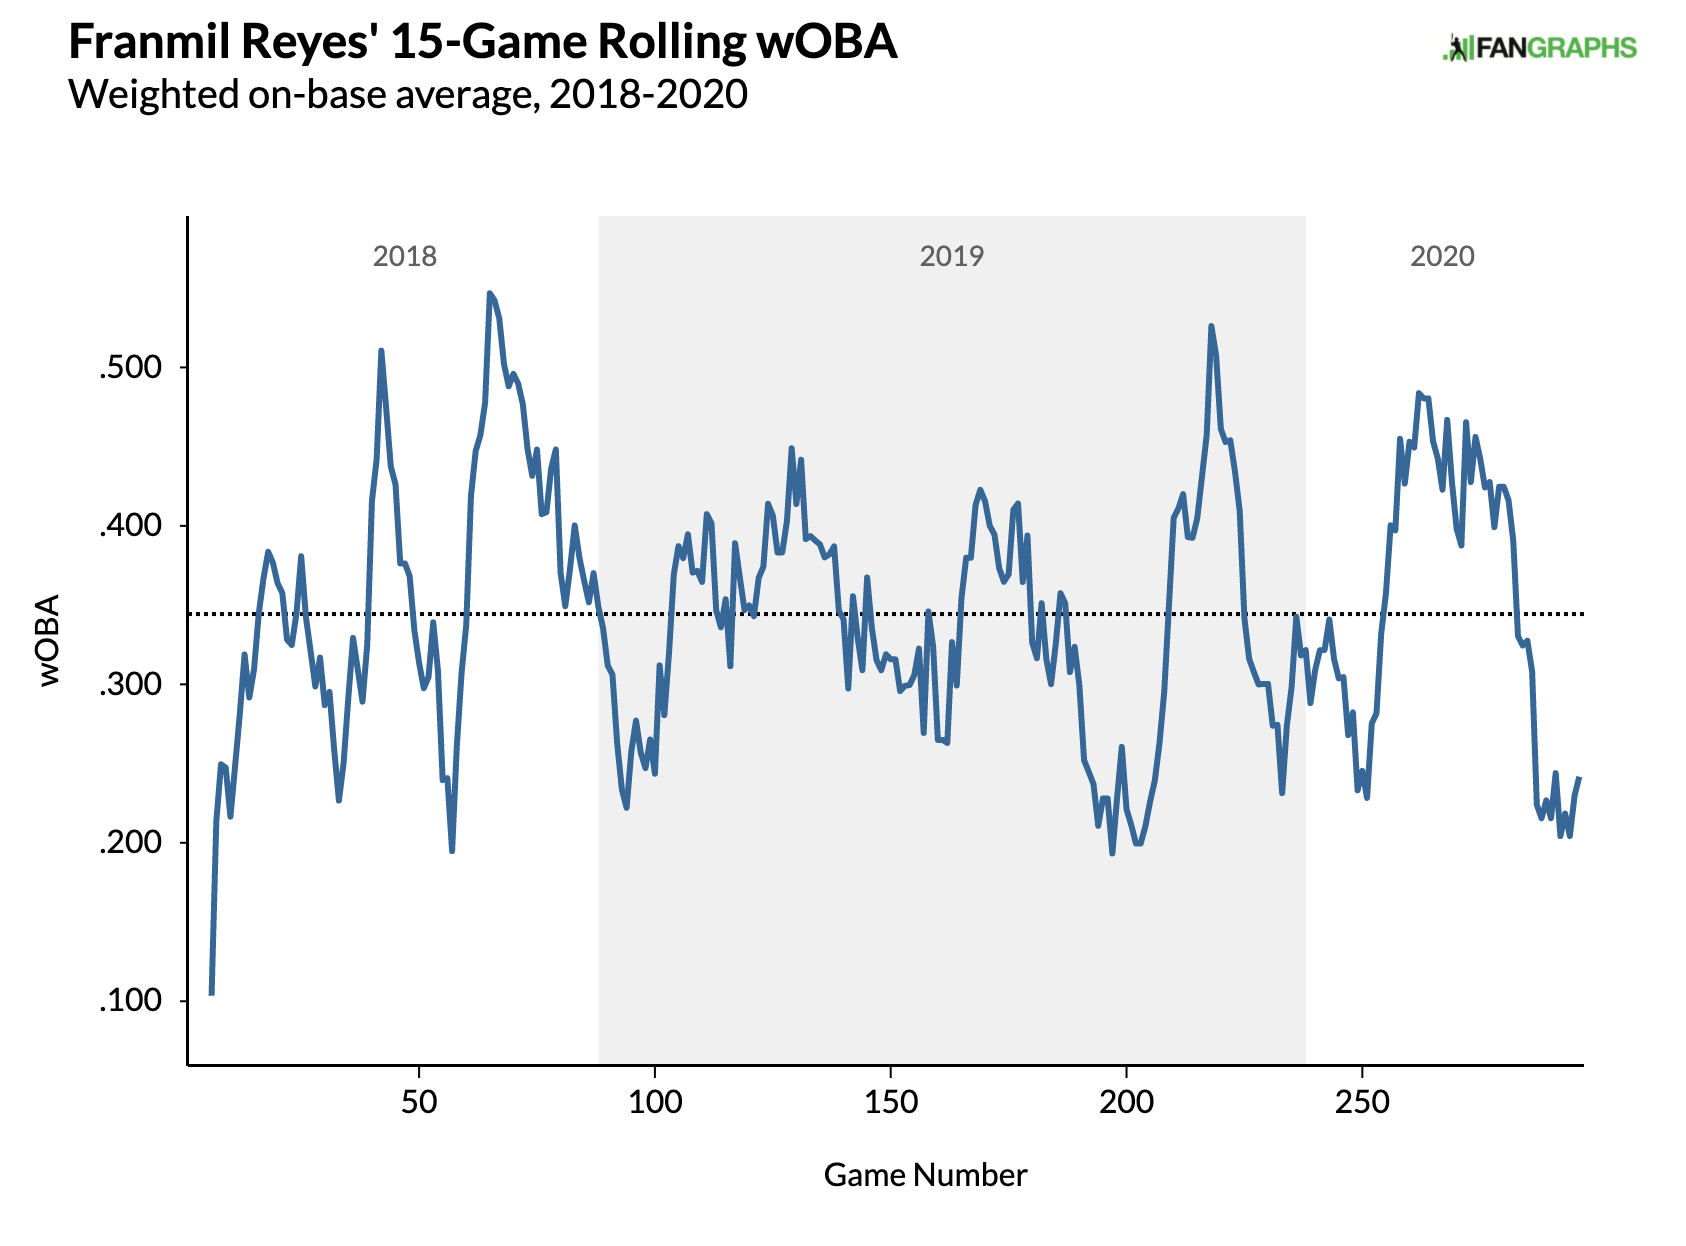
In fact, after August 7, he posted what would have been career-best marks in walk rate and strikeout rate. His wOBA after that date was .373, which would represent a huge step forward.
There are some red flags. The biggest during that stretch is his .380 BABIP – I would be shocked if he could keep that up. He also posted only a 20% HR/FB rate – up from 11.1% to open the season but a big fall from the 30.6% rate he had posted for his career coming into the season. The lower HR/FB rate is supported by a slight dip in his hard-hit rate, but his barrel rate stayed mostly in line with his career numbers, and still well-above league average. The guy can still mash.
Maybe it is because of the overall weak line, maybe the decreased HR/FB rate has fantasy players scared, but despite seeming to make plate discipline strides and putting up maybe the best stretch of offense of his career, Reyes has dropped a couple of rounds in ADP, from 126.2 to 147.9. I don’t think he’s any different than the guy who was going 20+ picks earlier in 2019, and I’ll gladly pick him up at his current price or even a bit higher.
Cody Bellinger is no stranger to mid-season shifts in performance. In his incredible 2019 season, he came out like gangbusters before falling off, but this year he did the opposite.
| Dates | wOBA | wRC+ |
| 2019 Season | .415 | 162 |
| 2019 First Half | .448 | 183 |
| 2019 Second Half | .370 | 132 |
| 2020 Season | .337 | 114 |
| Before 8/13/20 | .215 | 33 |
| 8/13/20 and after | .398 | 154 |
In 2019, Bellinger’s shifting fortunes were driven by contact quality and the same is true in 2020. While Bellinger walked more as the season went on, he struck out more, as well. What changed though, was his hard-hit rate. You can see on this graph from Baseball Savant that Bellinger saw his hard-hit rate tumble through 2019 and that tumble continued in early 2020 before he bounced back to where he was.
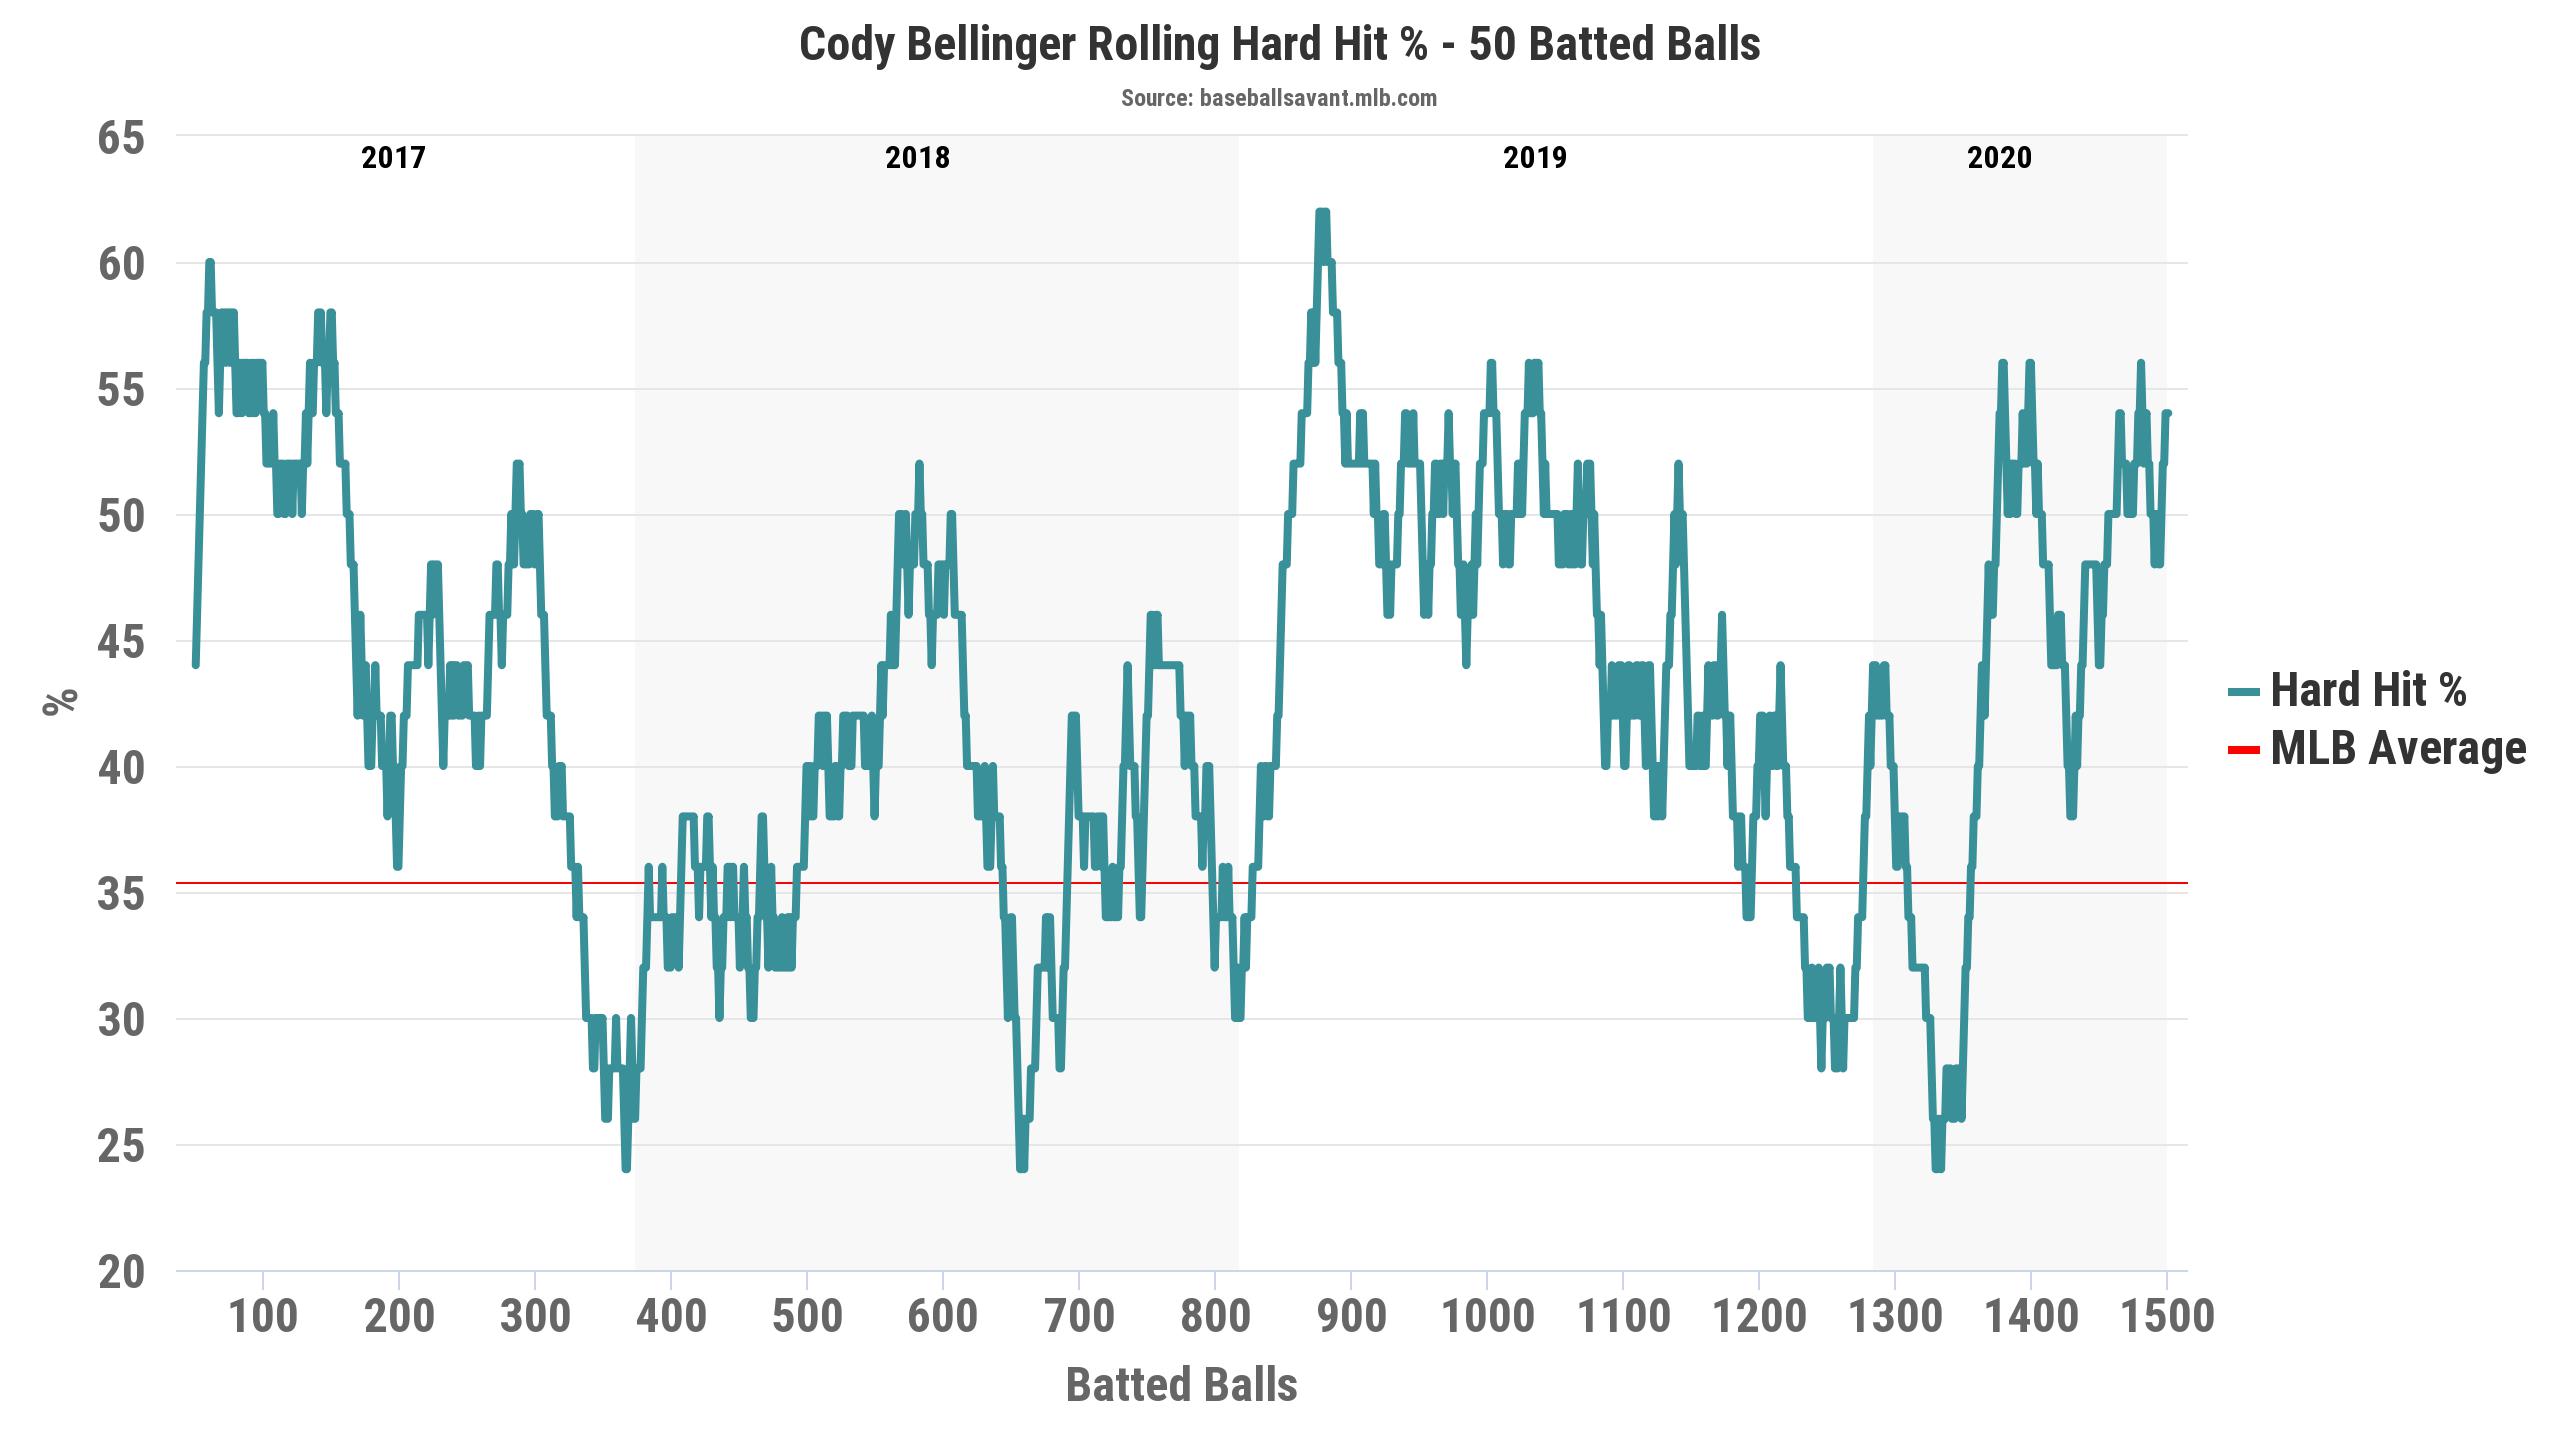
The return did not bring Bellinger all the way back to his peak in the first half of 2019, but it did bring him back above his career numbers (.375 wOBA, 137 wRC+). And Steamer, at least, thinks Bellinger will pick up where he left off, projecting a .387 wOBA and 144 wRC+. Despite the return to his hard-hitting ways and the positive projection, Bellinger’s NFBC ADP has dropped from 4.5 to 15.1.
Given how well he hit for most of the 2020 season, it seems like there might be room to take Bellinger a touch earlier than that, but there is an unrelated concern – his shoulder. Bellinger injured himself celebrating the World Series win and while reports are positive, being a little cautious about drafting a hitter with a bum shoulder isn’t a bad idea, especially when he has been so up-and-down over the last couple of years.
Evaluating Matt Chapman’s season is a totally different experience if you focus on what happened before or after contact.
| Year | BB% | K% | HR/FB Rate | Avg EV | Max EV | Hard-Hit Rate | Barrel Rate |
| 2017 | 9.8% | 28.2% | 13.9% | 90.1 | 112.3 | 40.0% | 10.5% |
| 2018 | 9.4% | 23.7% | 15.2% | 93.1 | 115.3 | 47.6% | 8.2% |
| 2019 | 10.9% | 21.9% | 19.0% | 92.7 | 114.4 | 48.1% | 10.9% |
| 2020 | 5.3% | 35.5% | 22.2% | 93.6 | 115.9 | 51.7% | 18.0% |
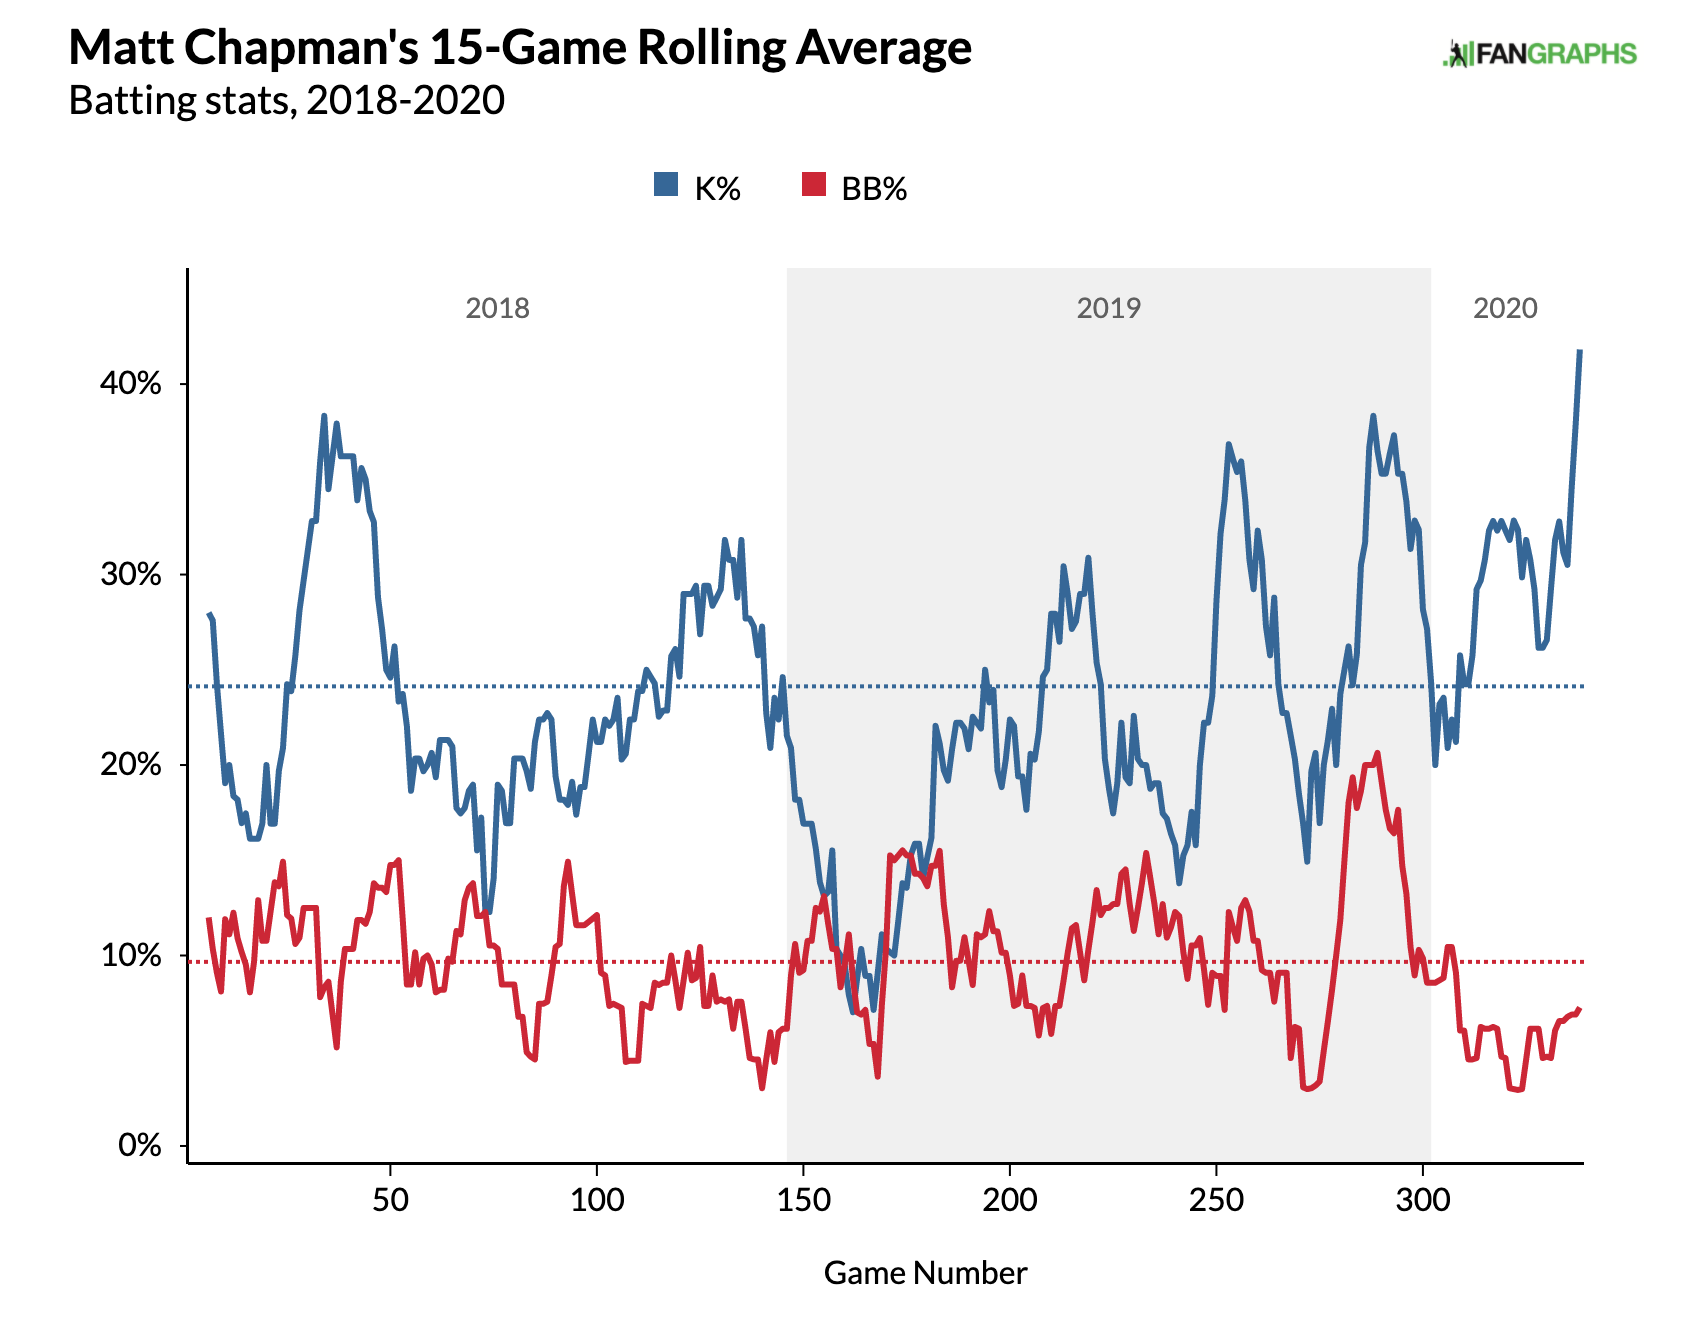
Chapman was relatively consistent for three years, particularly in the last two years. Then 2020 hit and Matt Chapman started mashing everything he could make contact with – but stopped making contact. He didn’t really chase more (23.4% O-Swing in 2019, 24.0% in 2020), but his contact rate went from 78.1% to 66.1%.
The problem is, even if you cut out the slow start for Chapman (he had a .246 wOBA before August 4 and a .370 after), the story is really the same. Over the year, his plate discipline continues to get worse while his hard-hit rate just stays high.
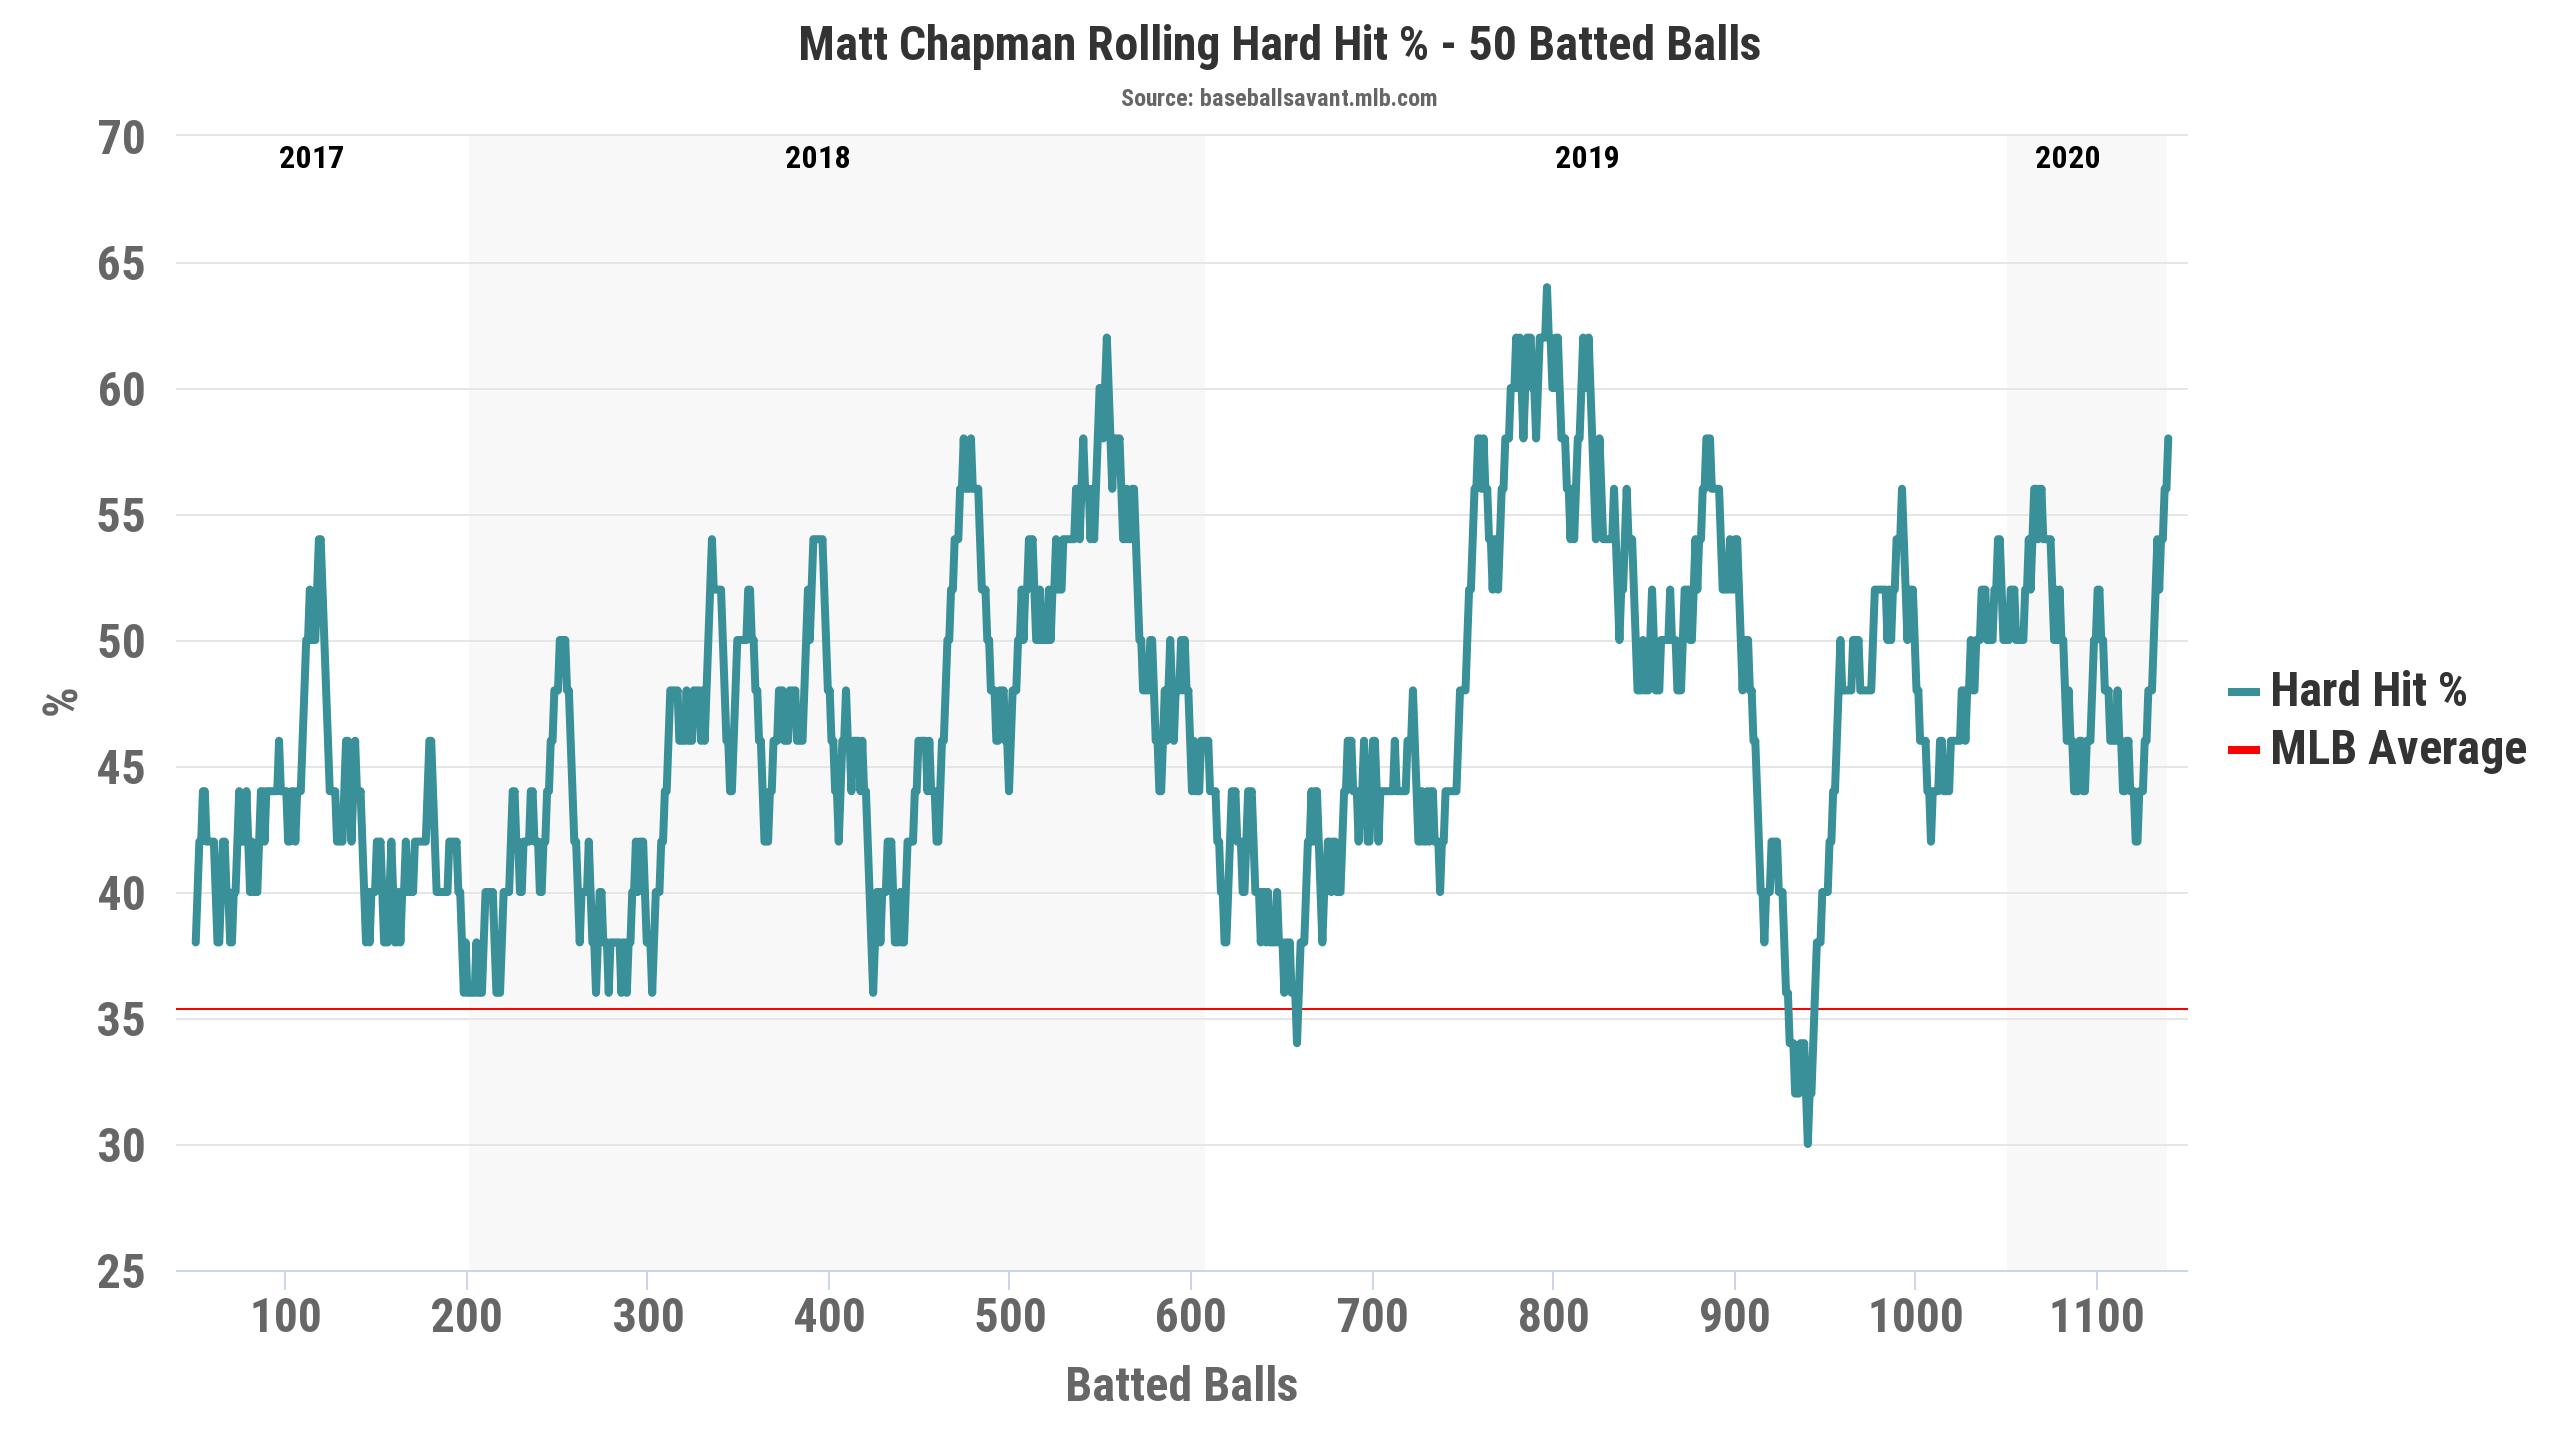
This calls for a deeper dive – did Chapman make a change to sell out for power at the expense of plate discipline? Is it just a fluke that he put his worst strikeout rates and best results on contact together at the same time? Can he keep the power gains and get back the plate discipline? But for now, I am intrigued by Chapman. His draft position has dropped a couple of rounds (91.8 last year, 114.9 this year) and I think he is a good buy. He has been so consistent that I would expect him to get back his approach. If he can do that and keep the power, there is upside.
Before diving too deep into Profar, it is worth noting that any evaluation of his ADP or market price is going to be skewed by the fact that he doesn’t have a job. While most intriguing free agents (Marcus Semien, George Springer, Marcell Ozuna, etc.) can be reasonably well-assumed to have a full-time job somewhere, we really don’t know what to expect from Profar. He could be a starting 2B; he could be a utility guy. He could stay unsigned for months. But, based on his 2020, I’ll be watching his landing spot closely.
In his 202 PA in 2020, Profar put up the second-best year of his career. But after coming up as an elite prospect, he hasn’t done enough to make “second-best” all that exciting. However, his .335 wOBA is skewed by an ugly 49 PA with a .209 wOBA to start the year. The .376 he posted the rest of the way is super impressive. Tacking on six home runs and five stolen bases in roughly a quarter of a season’s worth of plate appearances is pretty intriguing, too.
Profar’s big adjustments were in strikeout rate and BABIP. He started the year way too passive.
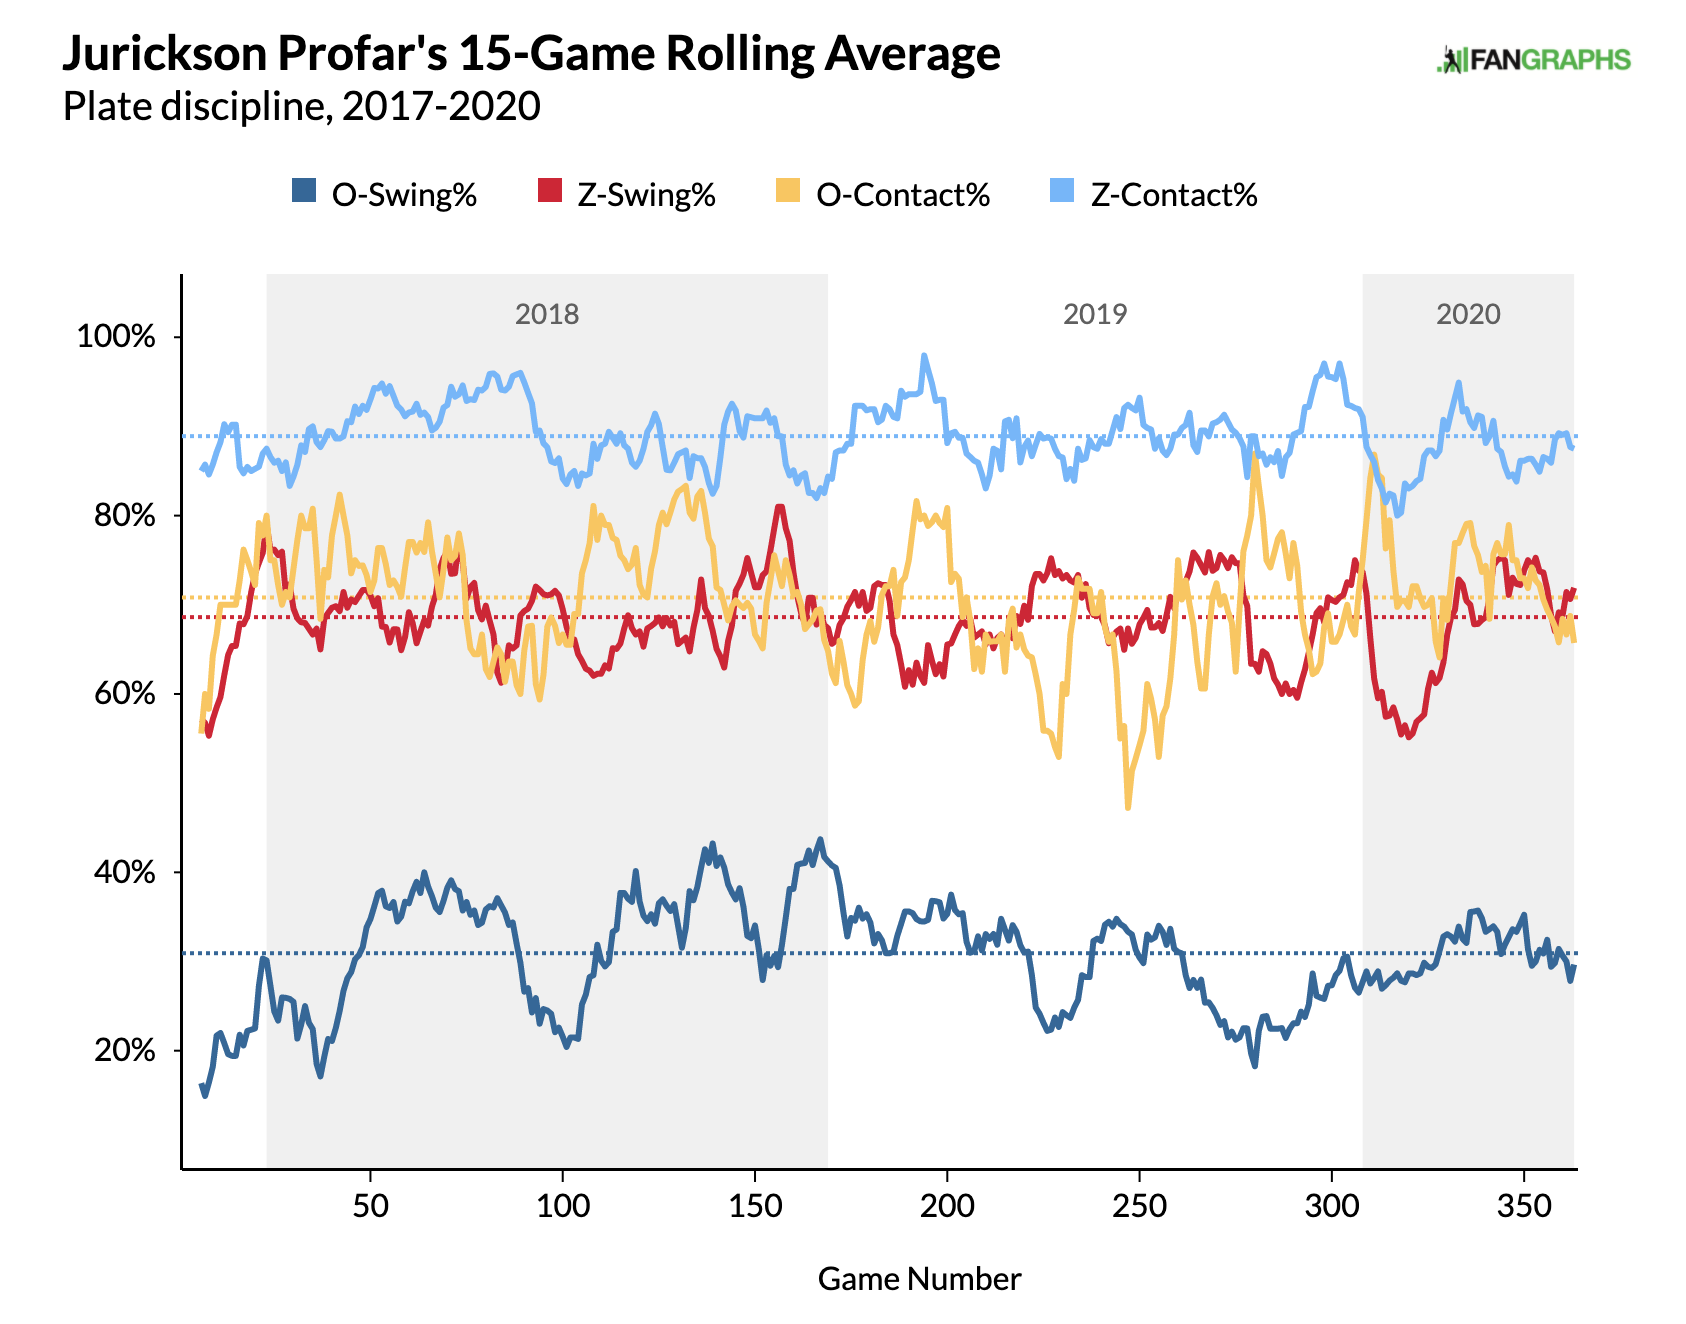
Early in 2020, you can see where his Z-swing dips down almost to 50%—letting nearly half of pitches in the zone fly by isn’t going to work. At the same time, his contact rates dropped quite a bit. By the end of the season, his plate discipline had normalized back to where it was.
His contact quality, meanwhile, looks very similar to where he was in 2018-19:
| Year | Avg EV | Hard Hit Rate | Barrel Rate | BABIP | wOBA | HR/FB Rate |
| 2018 | 87.3 | 31.8% | 4.3% | .269 | .341 | 13.2% |
| 2019 | 86.7 | 30.5% | 6.2% | .218 | .301 | 14.0% |
| 2020 | 87.2 | 27.7% | 3.2% | .293 | .335 | 14.9% |
| Through 8/8/20 | 86.8 | 15.6% | 3.1% | .097 | .209 | 8.3% |
| After 8/8/20 | 87.3 | 30.9% | 3.3% | .345 | .376 | 17.1% |
Profar turned things around by increasing his BABIP and HR/FB rate, but without actually hitting the ball any better. What he did do was use all fields more, as he went from pulling 46.9% of balls to just 33.3%. Perhaps that profile works better with Profar’s line-drive heavy approach, as he used all fields much more in his successful 2018 and much less in his unsuccessful 2019.
There wasn’t enough batted ball improvement to believe that Profar is going to sustain that .376 wOBA for a season, but seeing him get back to his 2018, perhaps even a bit better, if he can keep the BABIP closer to .300, seems pretty reasonable.
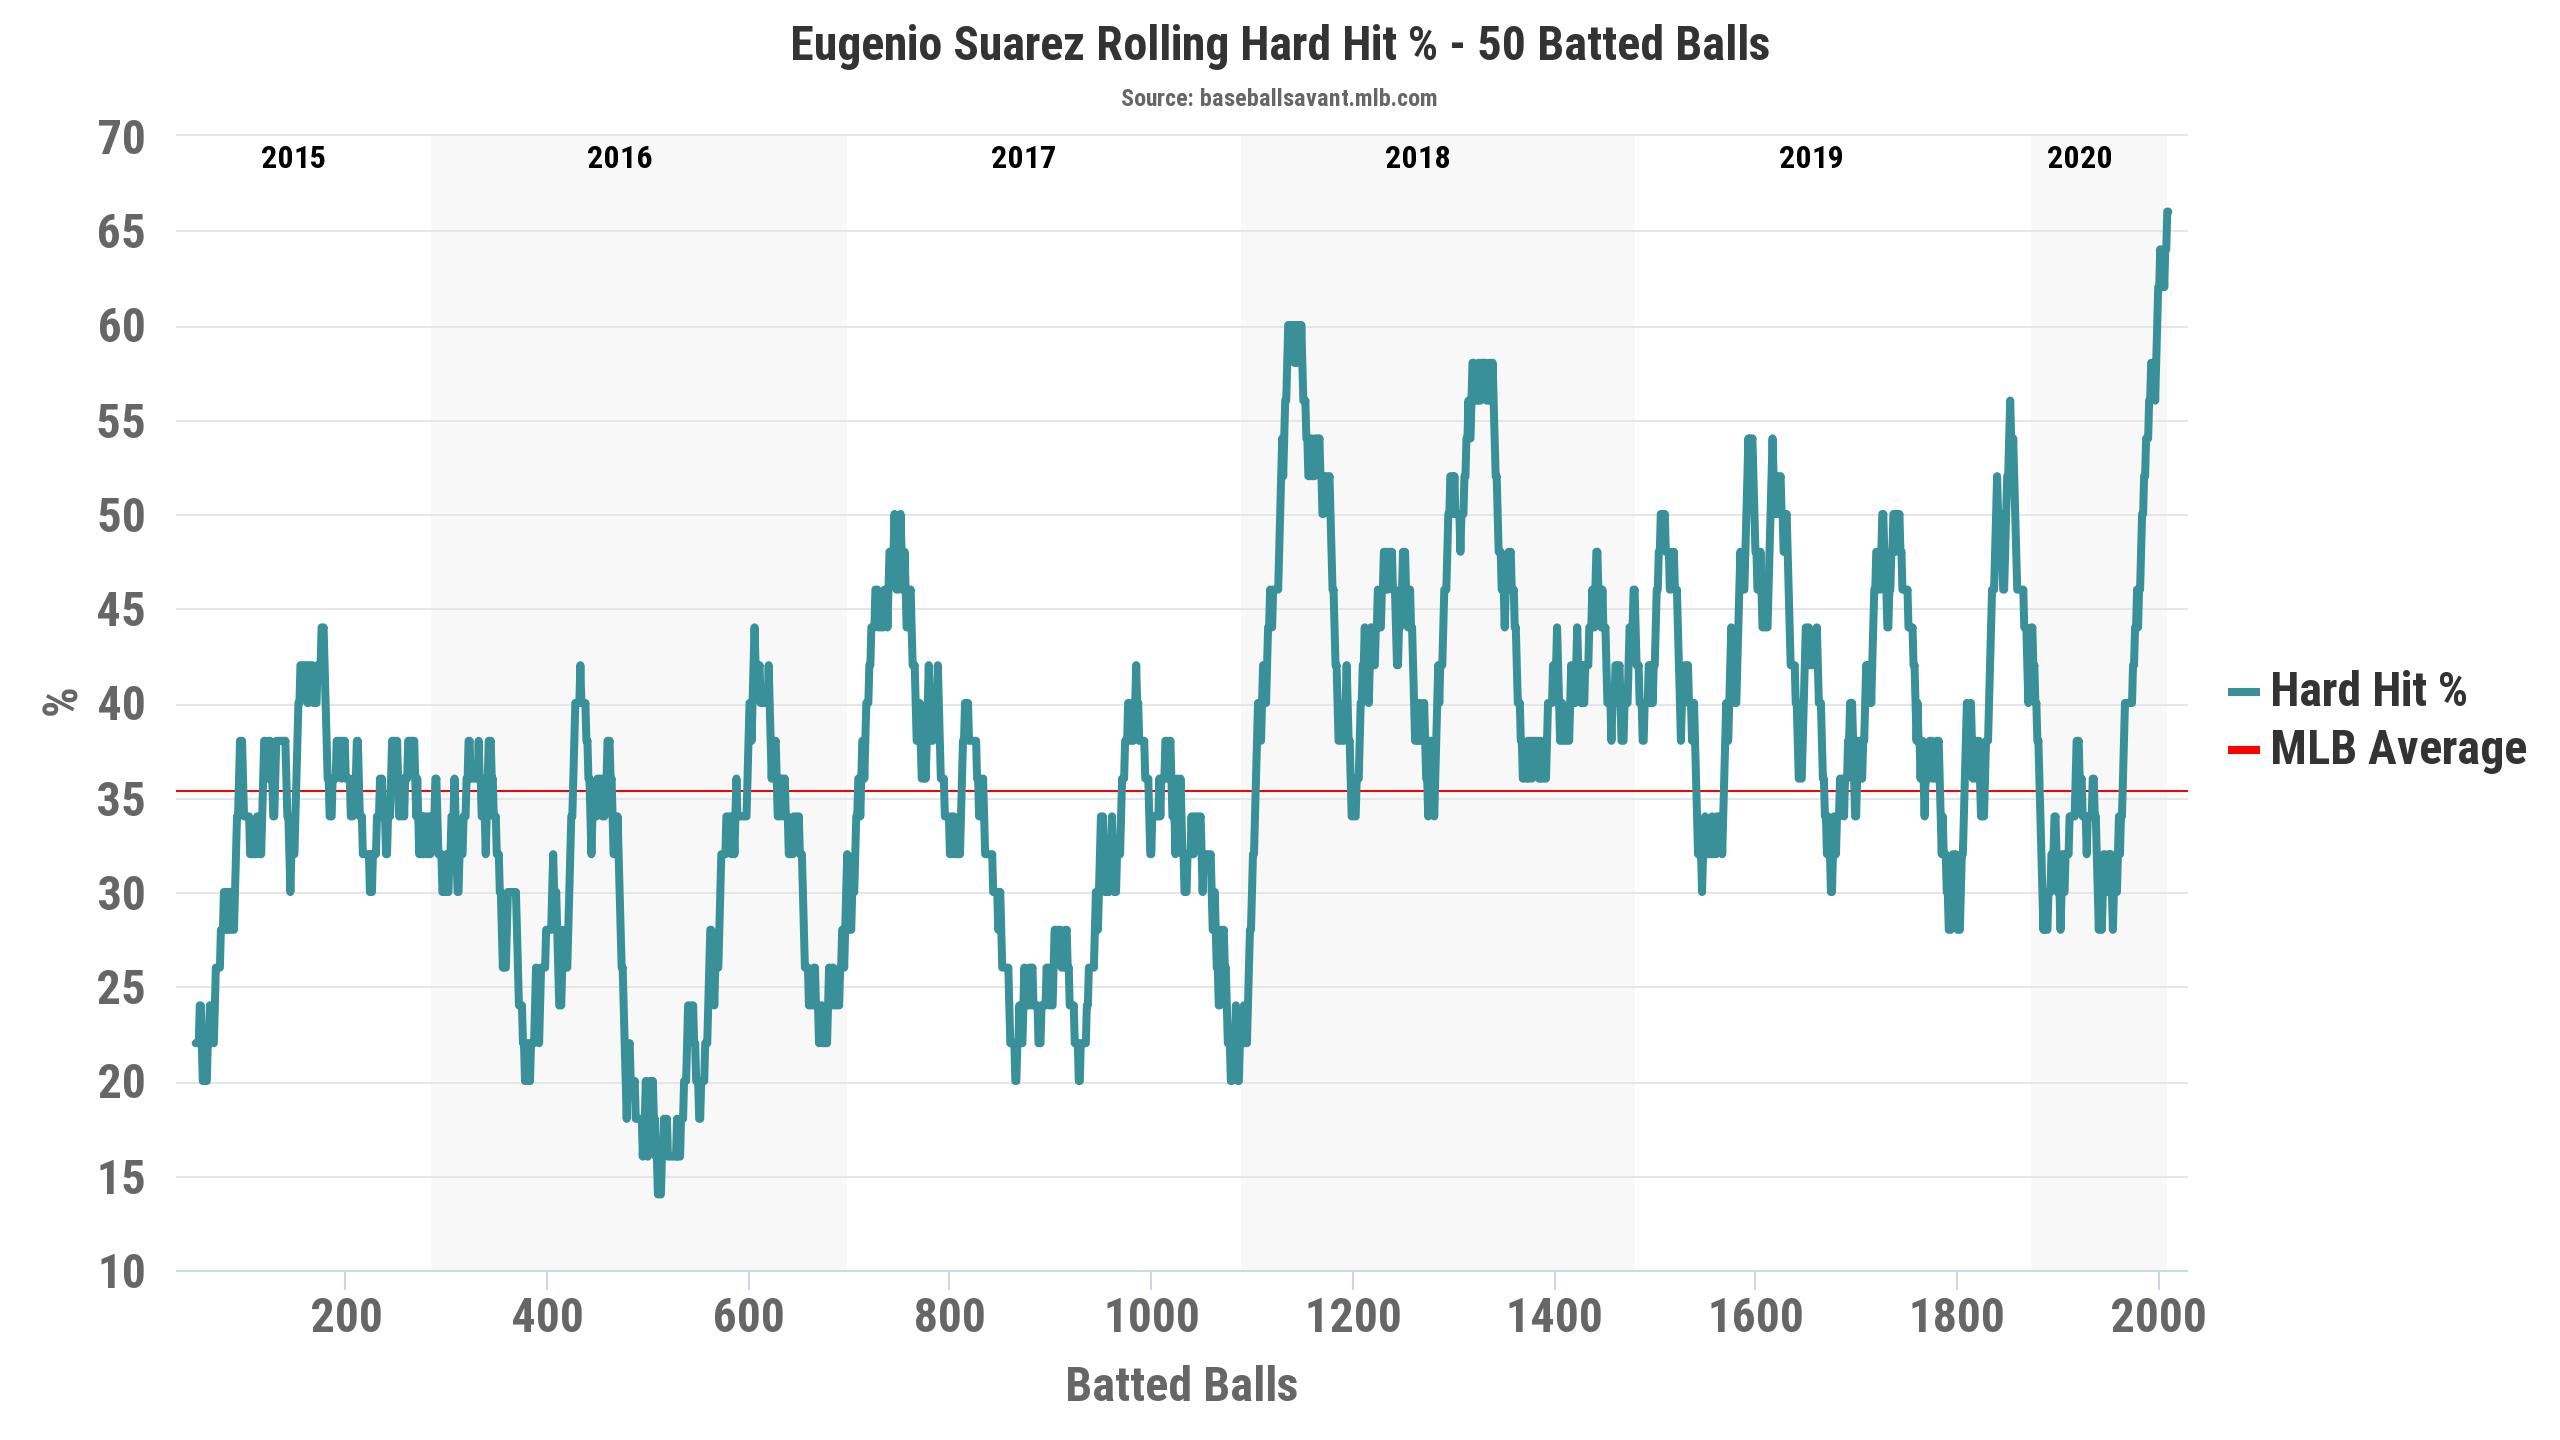
Eugenio Suarez
Over 2018-19, Suarez mashed 83 home runs and posted a .379 wOBA. In 2020, his strikeout rate and walk rate rose in unison, increasing his BB/K ratio. He increased his hard-hit and barrel rates. And he posted a .332 wOBA, his worst since 2016. Part of that can be explained away by BABIP (down more than .100 points from .317 in 2018-19 to .214 in 2020). And part can be explained by an impressively slow start.
Through August 13, he had a .250 wOBA. The Reds played the next day and then had a few days off due to a COVID outbreak. They came back on August 19 and from that point on, including an 0-3 effort in the first game back, Suarez posted a .374 wOBA with 13 HR in 152 PA. And that is despite his BABIP never recovering – his “hot streak” was with a .241 BABIP.
By the end of the season his hard-hit rate was skyrocketing.
And the one issue he was having – squaring up the ball on in the sweet spot – looks an awful lot like the start to his 2019 season.
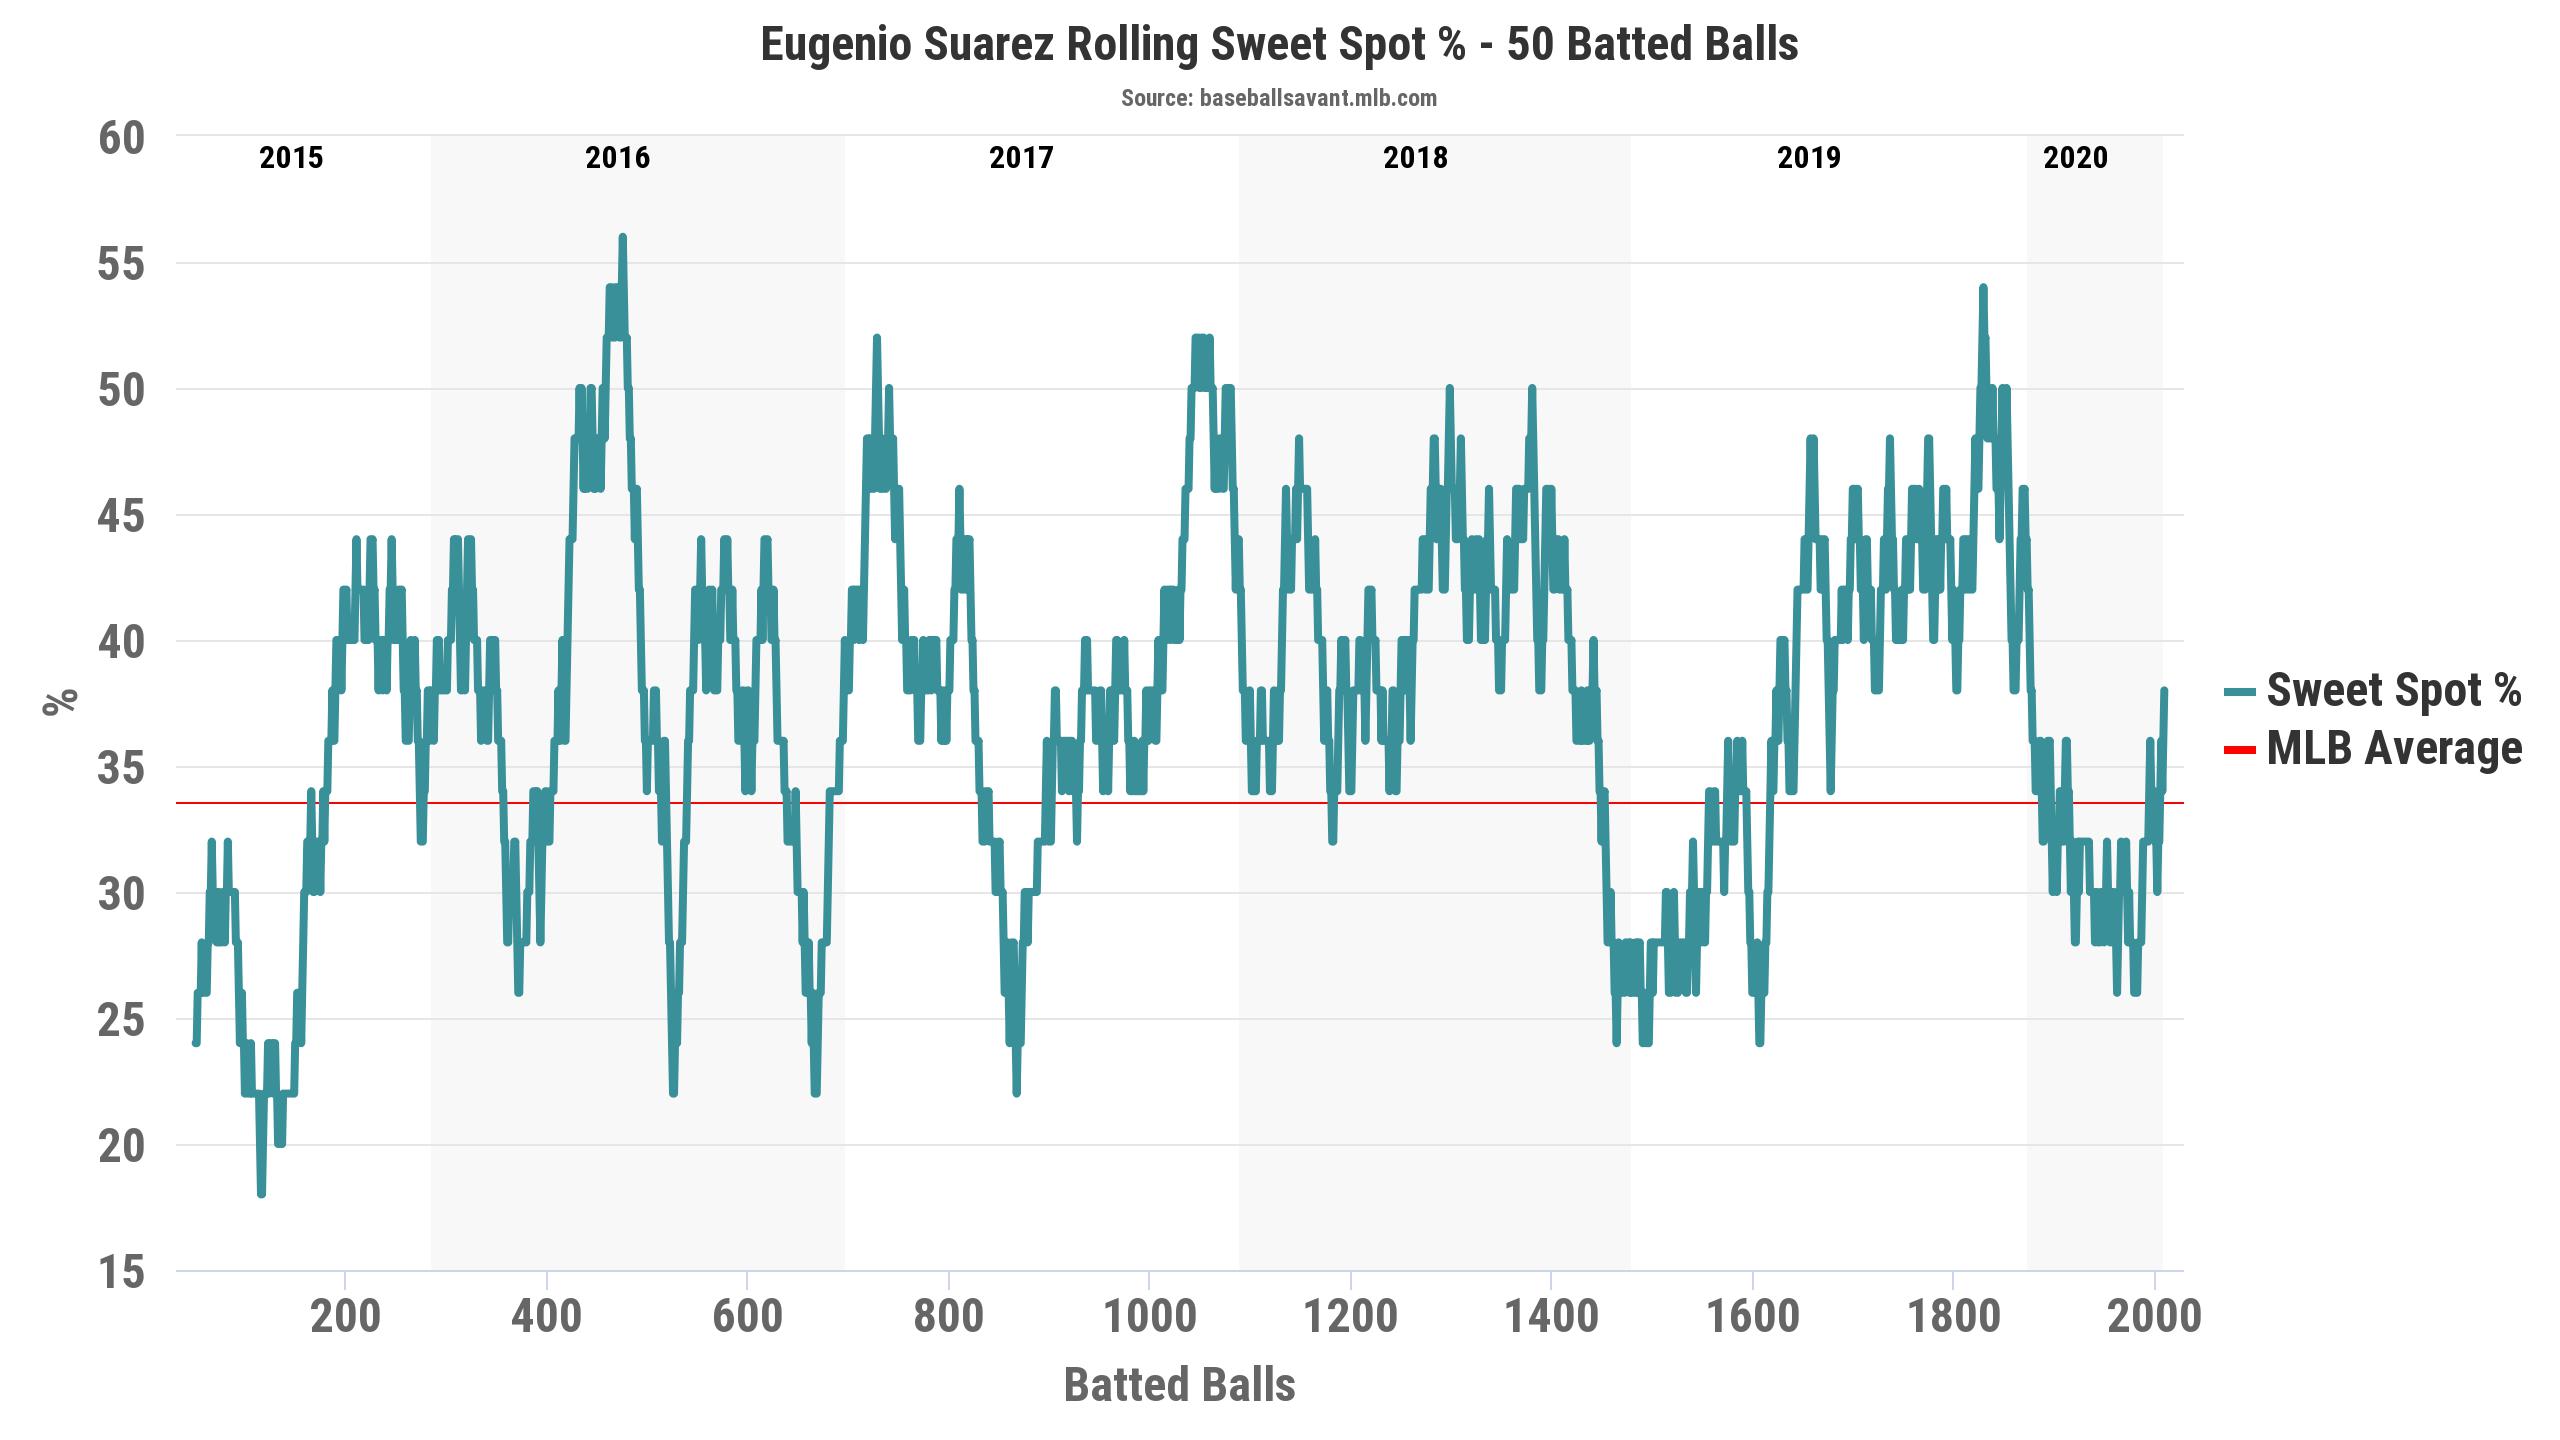
In fact, his sweet spot rate started low or dropped early in 2015, 2016, 2018, and 2019. 2020 doesn’t look like outlier-bad from that perspective.
Steamer is projecting a .343 wOBA in 2021, near his .347 career number instead of something in the .370’s, in-line with what he has done 2018-20, outside those couple weeks to start the 2020 season. His ADP has dropped from 73.6 in 2020 to 84.6 in 2021 – not a huge change but a suggestion that the market is reacting to his apparently-poor season. I’d expect a full recovery from Suarez, right back to where he was at his peak.
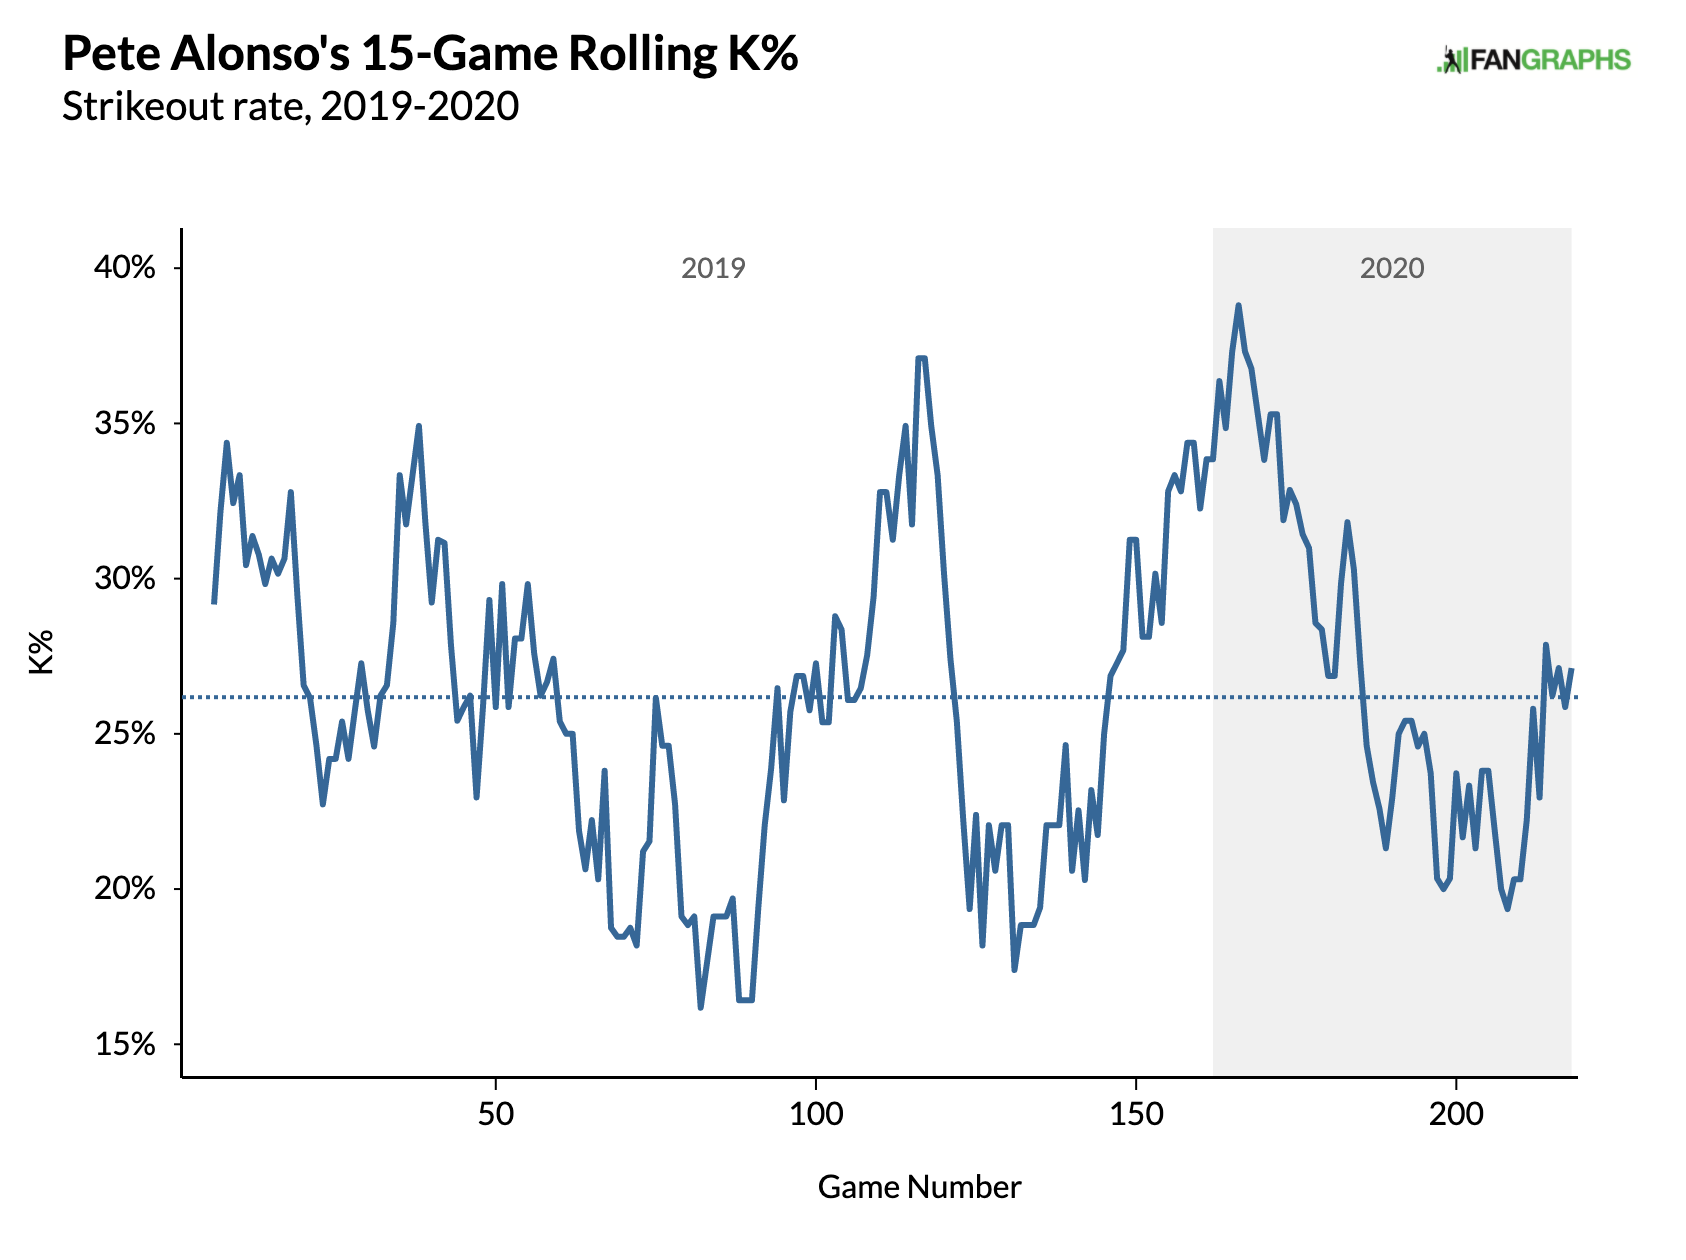
Pete Alonso exploded onto the baseball scene in 2019 and, in comparison, 2020 felt underwhelming. A .342 wOBA isn’t bad, but it doesn’t meet expectations for a stud 1B who put up a .384 as a rookie. But after the first two weeks, Alonso was much better. His wOBA was .261 as of August 2; from that point on, it was .362. That’s still not .384, but it is a heckuva lot better than .342 and it’s enough to change our perception of his season.
Alonso appears to have had a bit of a strikeout issue early in the season but by the end of the year, he had it under control.
The Polar Bear was hitting the ball just as hard in 2020 as he did in 2019, and if there is any concern, it might be around his launch angle. His average launch angle barely moved, but his sweet spot rate dropped quite a bit, though it was trending up by the end of the year.
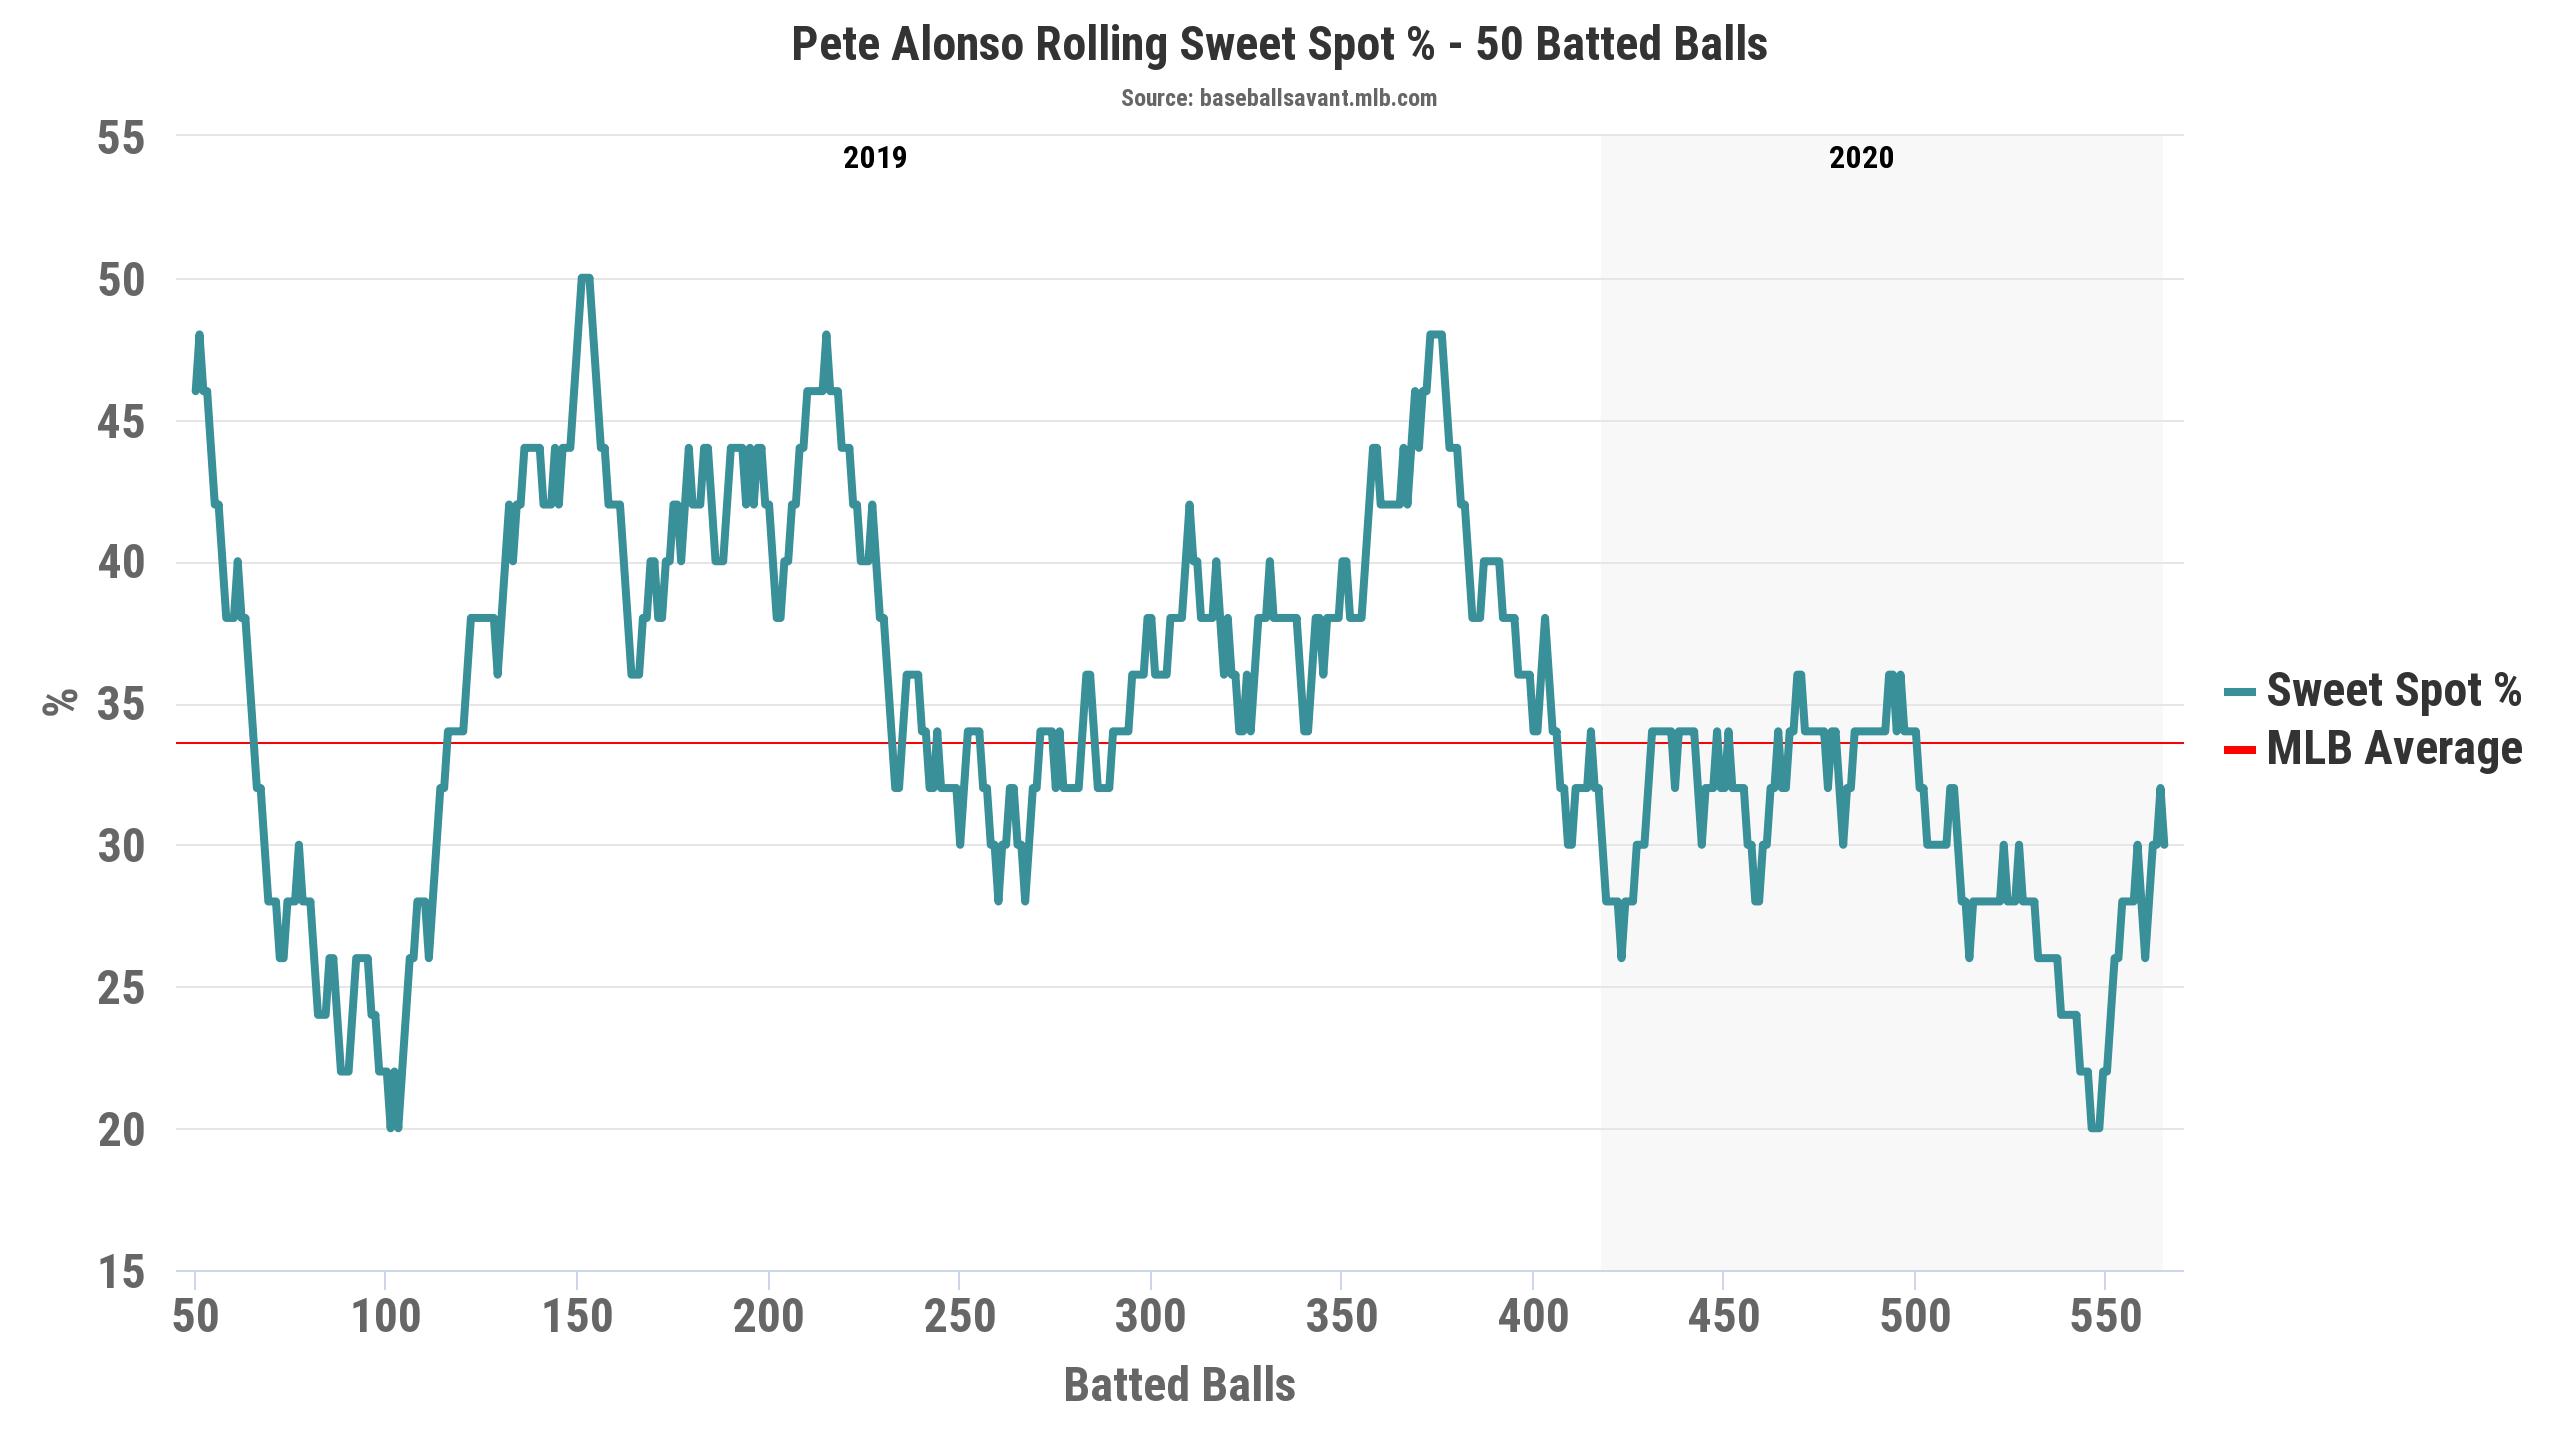
Don’t buy Alonso expecting a repeat of his 2019 campaign, but his career rate (.373 wOBA) is not a bad bet.
Yelich’s 2020 struggles are well-documented, and Yelich pointed at a lack of in-season video as an issue. But, for our purposes, he also noted that “You don’t have that large sample size for everything to even out, so if you get off to a tough start or a bad start, you’re really behind the 8-ball.”
And as far as bad starts go, having a wOBA of .096 and a wRC+ of -51 before the calendar turned to August is about as bad as it gets. Through the end of the season, Yelich posted a .375 wOBA and 133 wRC+. The problem for Yelich was, not only was that bad start really bad, even his bounceback did not meet the standard he set since moving to Milwaukee.
| Year | wOBA | wRC+ |
| 2018 | .422 | 166 |
| 2019 | .442 | 174 |
| 2020 | .343 | 112 |
| After August 1, 2020 | .375 | 133 |
Yelich seemed to suffer from two issues early on – he struggled to make contact (83.3% z-contact and 68.8% O-contact in that first week, compared to 87.6% and 76.5% in his first two years in Milwaukee) and the contact he did make was not as loud (6.7% barrel rate, 33.3% hard-hit rate, and 89.0 average exit velocity in that slow start, compared to 13.9%, 49.8% and 92.9 in 2018-19). He resolved those issues as the season went on, but he got extremely passive.
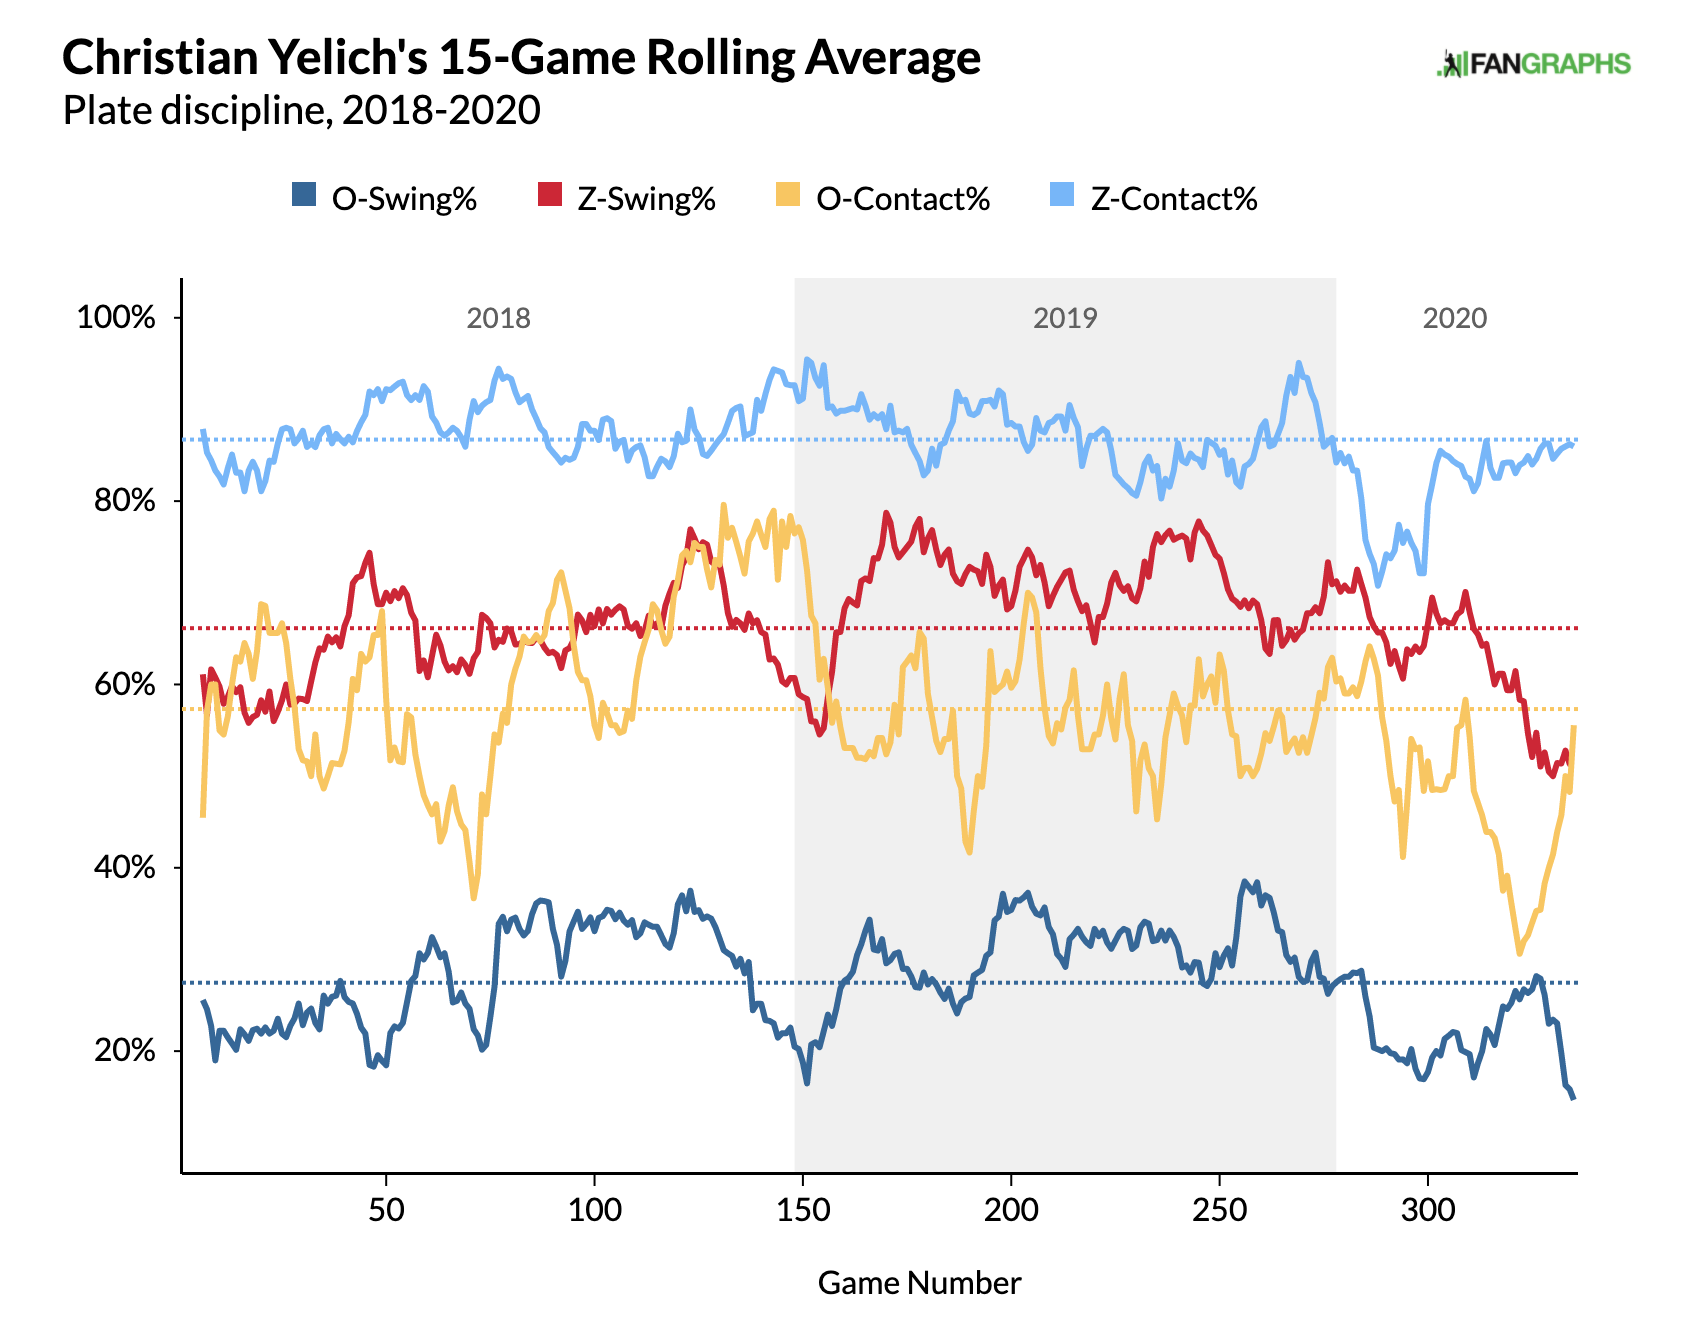
By the end of the season, his contact rates look fine, and he posted career-highs in hard-hit rate and average exit velocity in 2020, with a barrel rate in-line with his 2018-19. But the sudden passivity also led to walk and strikeout rates way above his previous highs. His 30.8% strikeout rate for the season was a glaring issue and even when his bat improved, he maintained a 29.2% rate.
The good thing is passivity is something Yelich can control. Maybe the lack of in-game video made it harder for him to recognize pitches. Maybe he lost confidence after the slow start and responded by being more selective. Or maybe it was just a short, weird season. Regardless, I suspect he’ll get back to being more aggressive in 2021.
After going second in many 2020 drafts, Yelich is slipping to the end of the first round this year. Part of that drop is valid – he likely won’t steal 30 bases as he did in 2019 – but part might be an overreaction to his 2020 performance. If you are drafting near the bottom of the first, Yelich is a great value.
Photo by Nick Wosika & Jay Anderson/Icon Sportswire | Adapted by Michael Packard (@designsbypack on Twitter & IG)
This is great. Any way to highlight the opposite – hitters whose final lines were inflated by early hot starts in 2020? Kyle Lewis comes to mind anecdotally. As does Tatis Jr. Thanks for the analysis!
Good idea and worth looking at.