


At this time last year how many of us, with complete honesty, could say we saw Max Muncy coming? I know I couldn’t, and I would venture to guess that the vast majority of the fantasy community had little to no knowledge of Max Muncy in December of 2017. That’s not meant to be a knock on anyone. Muncy was not considered a high-end prospect. He did show some power back in 2013 with Stockton and Midland, the Oakland Athletics‘ High-A and Double-A affiliates, with 25 home runs that year. After that, the power dipped and he was entering his age-27 season with little Major League experience. Defensively, Muncy largely manned first base while occasionally filling in at third and second base. Prospectors don’t typically get excited about bad-bodied first basemen with above-average power, average speed, and below-average defensive skills. That’s why Muncy fell through the cracks.
Offensive Skills
The one component to Muncy’s game that helped propel him through the Athletics’ and Dodgers’ minor league systems was his ability to get on base. Muncy’s plate discipline isn’t just good; it’s elite, as evidenced by a 21.5% O-Swing that ranked him 12th among all players with at least 400 plate appearances in 2018. If you’re wondering, that’s two spots ahead of Mike Trout! Plate skills are highly coveted in today’s game of analytics. Muncy also subscribes to the launch angle revolution and elevated the ball consistently in 2018. Muncy was able to maximize the quality of his batted balls, especially the balls hit in the air. Let’s take a look at Muncy’s hard-hit percentage on fly balls compared to the Major League averages.
| Hard Hit FB Direction | Muncy | MLB Average |
| Pull side | 78.8% | 51.6% |
| Center | 47.4% | 46.4% |
| Opposite Field | 39.6% | 20.4% |
Nearly 80% of Muncy’s pulled fly balls were categorized as hard contact per FanGraphs, allowing him to maintain a 57.6% HR/FB on balls hit to right field. Perhaps even more impressive is Muncy’s power to the opposite field. The Major League average HR/FB on fly balls hit to the opposite field is a measly 3.8%. Muncy managed an incredible 19% HR/FB on balls hit to left field in 2018. This data justifies Muncy’s elevated home run rate last season and showcases his power to all fields. Statcast also loves Muncy, evidenced by extremely solid barrel and hard-hit rates. Muncy finished 2018 ranked third overall in barrels per batted ball event. For context, that’s one spot ahead of that Mike Trout guy I mentioned earlier.
Muncy vs. Pitch Type
Can we expect Muncy to continue to mash in 2019 or does he have a weakness? For this, I want to breakdown Muncy’s wOBA and plate discipline against each pitch type.
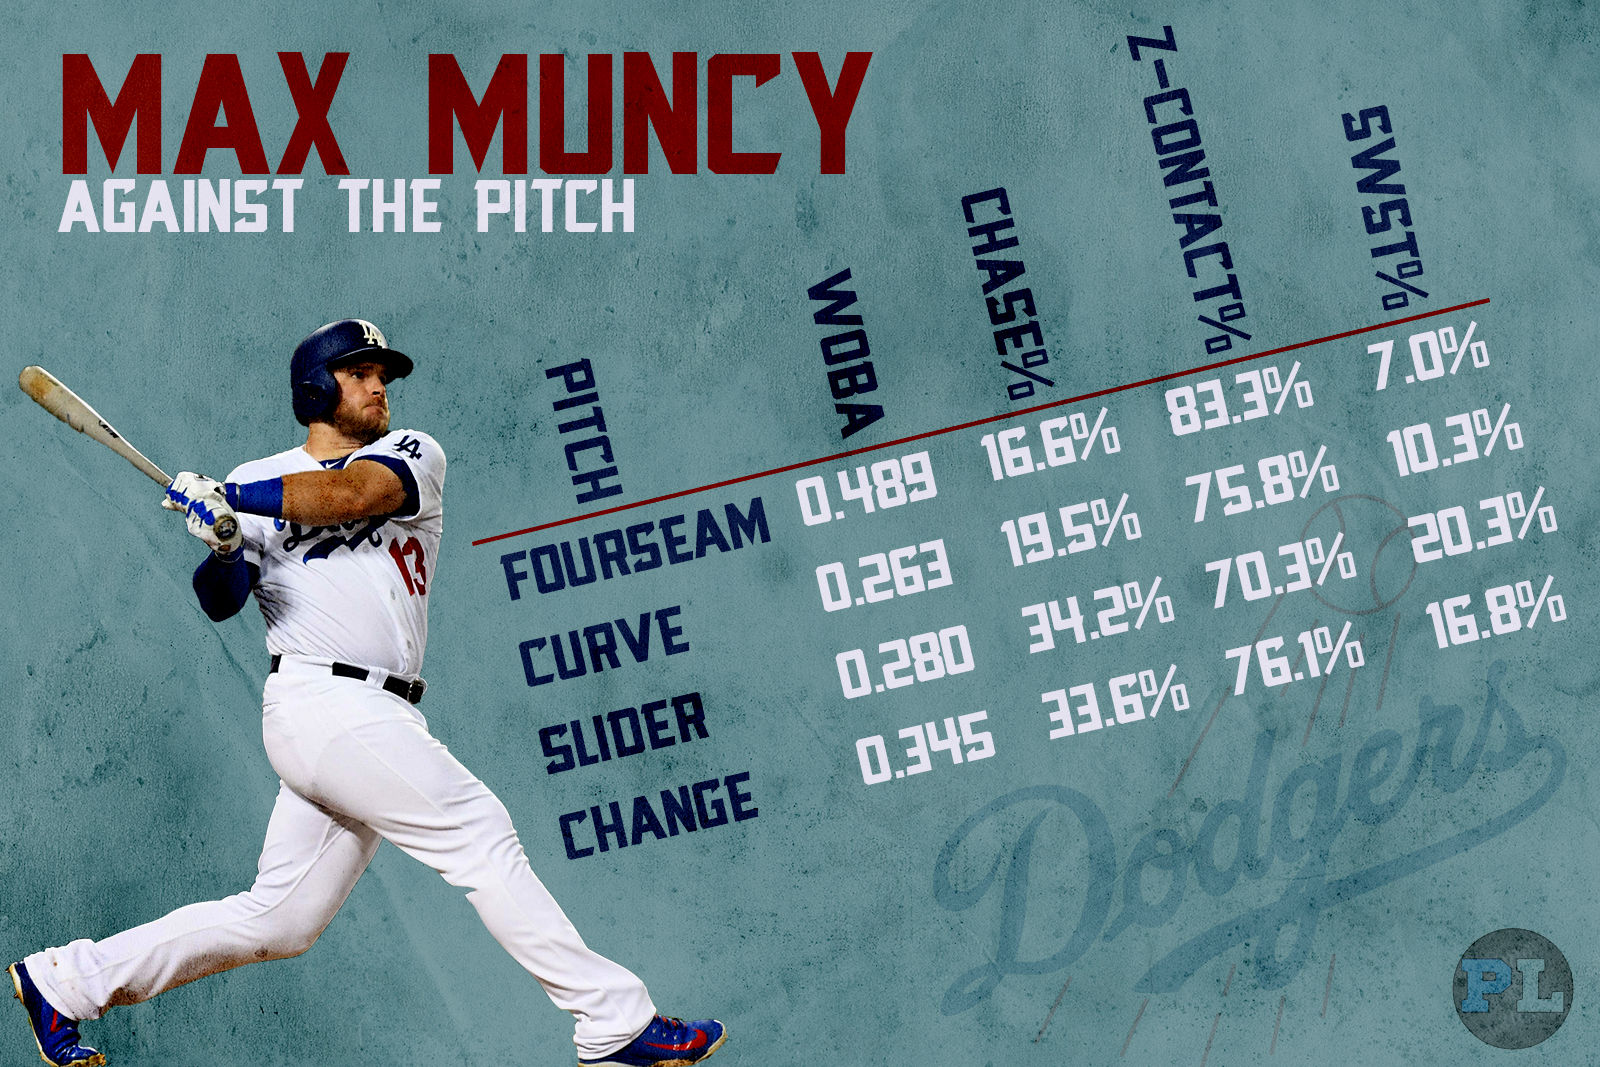
There’s a lot of data there to digest. When taking a look at the graphic, keep in mind Muncy’s elite overall plate discipline numbers. The results against the four-seam fastball absolutely jump off the page. A wOBA approaching .500 proves that there’s no doubt, Muncy can handle the fastball. The focus on Muncy for opposing pitchers should be the secondary offerings. The results against the curveball were less than stellar for Muncy in 2018. While he doesn’t chase the pitch very often, he’s getting weak contact on his batted balls against the curve. The changeup, on the other hand, yielded positive results in Muncy’s favor, but his tendency to chase this pitch outside the zone may pose a problem for him moving forward. On a positive note, Muncy punished mistakes on changeups in the zone, but recognizing this pitch is another adjustment Muncy will have to make to continue his success in 2019.
Now for the slider. The slider is Muncy’s number one weakness. That’s not a surprise; the slider induces the most swings and misses on a per-pitch basis than any other pitch in Major League Baseball. In fact, the MLB average swinging strike rate against sliders is 16.7%. But Muncy had a 20.3% swinging strike rate against the slider in 2018. That’s nearly four percent worse than league average. Muncy’s season-long swinging strike rate was about one percent better than league average on all pitches. Similar to the changeup, Muncy appears to have issues recognizing and making contact with the slider.
Pitch Mix
Early in the season, Muncy was the beneficiary of catching teams and pitching coaches off guard with his instant success. The scouting report on Muncy coming into 2018 was likely non-existent or at least lacking depth, giving him the element of surprise. This created an adjustment period for MLB teams on how exactly to attack Muncy. Let’s see how teams approached Muncy as the season progressed by looking at the percentage of pitch-types against.
| Date Range | Four-seam% | Slider% | Curve% | Change% |
| 4/17 – 7/15 | 55.9% | 12.1% | 12.6% | 12.4% |
| 7/20 – 9/1 | 51.0% | 15.5% | 13.4% | 11.0% |
| 9/1 – 10/1 | 48.5% | 16.4% | 13.7% | 11.0% |
It turns out, Major League teams are pretty smart. There was a clear adjustment made as to how Muncy was attacked by opposing pitchers. Throw fewer fastballs and more sliders (and curveballs). It’s no surprise that Muncy’s strikeout rate jumped to over 30% in the second half of the season. It’s also noteworthy that Muncy struggled with whiffs in the playoffs, striking out 23 times in just 62 plate appearances. Of course, the level of talent is heightened in the postseason and hitters rarely see a pitcher more than once in the same game unless it’s an ace. What does this mean for Max Muncy moving forward?
2019 Outlook
Max Muncy came into 2018 with a bang (several actually), and owners were reaping the benefits. With more experience brings more data for teams to analyze. I’m confident that the pitch mix Muncy will see in 2019 will more similarly mirror what he saw in September and October of 2018. The usage of sliders has been on the rise in recent years per Mike Petriello of MLBStatcast. It’s going to fall on the shoulders of Muncy as to how he wants to adjust. Keep in mind Muncy’s elite quality of batted balls upon contact mentioned earlier. I liken Muncy to Rhys Hoskins in terms of approach and batted ball profile. Hoskins quality of contact dipped in 2018 compared to his breakout, but he still managed to hit 34 home runs.
There’s a difference though. Hoskins compiled 660 plate appearances in 2018. While it gives his owners positional flexibility, Muncy’s lack of a stranglehold on any defensive position could limit his plate appearances in 2019. He will also never be confused for a defensive stalwart, which makes him susceptible to late-inning defensive replacements. That being said, Muncy does have elite power and has shown the ability to make successful adjustments throughout his Minor League career. Per NFBC, Muncy’s average draft position is currently around 97 overall, more than 50 spots behind the aforementioned Rhys Hoskins. The increased strikeout rate and playing time risk appear to be baked into the price. As critical as I may have been with Muncy, I feel there is value in a player that could hit 30 or more home runs in the middle of a solid Dodgers lineup. Steamer isn’t so optimistic, projecting Muncy for only 22 home runs in 537 plate appearances. I’ll gladly take the over, but will be watching how pitchers attack him early on in 2019.
(Photo by Chris Williams/Icon Sportswire)
Terrific article Max! I’m a big Muncy fan so it was great to see such a thoughtful and accurate take.
I’m glad you touched upon Muncy’s opposite field power. That, along with his strong performance against left-handed pitching, indicates to me that he has a well-rounded enough profile to carry over the performance into 2019.
The other thing is how Muncy bounced back after pitchers adapted to him. He never posted an OPS below 870 in any month, and he had his second highest OPS of the season in September.
Thank you Nick!
Those are very good points. He did sustain very good power metrics despite the elevated K rate. I really do hope the Dodgers let him play every day. His power was insane last year. Excited to see how he follows up last season.
In a 6×6 no average, yes OBP and SLG league. Muncy was a pickup last year so I can keep him this year for $3, two years for $8, three years for $13 etc. It’s on this type of structure that I’ve got Bellinger for $17 for 3 more years and Lou Castillo on his last year of a $2×8. I usually don’t keep pitchers long-term but messed up with Castillo last year. I’m debating keeping Muncy for 2 years but the league figuring him out is definitely a worry. How confident should I be that Muncy will be a $15+ player not this year—but next year?
I love Castillo but in an OBP + SLG league, I’m going with Muncy. He gets a massive bump in a league w/ those categories. There may be some struggles but his batted ball quality is great and his low batting average will be nullified because of his patience. He’s a solid 4-5 category guy in your league. The only real question is playing time but I think he gets enough to provide good value the next couple seasons.