


Were you like me last Friday, just calmly sitting at your desk watching the minutes go by and waiting for the weekend when suddenly you felt a chill? It was a feeling you just couldn’t put your finger on, and then something just drew you to your web browser, where you started typing: F-A-N-T-A-S-Y-B-A-S-E-B-A-L-L-O-P-E-N-2-0-1-9.
And voila! The signal you’ve been waiting for: Fantasy baseball platforms are beginning to open. ESPN opened up on Friday, Fantrax doesn’t really close, and Yahoo is at the end of January. The draft season will be in full swing before we know it, and soon enough, it will be time to start looking through your ranking sheet trying to identify players who will take you all the way to the championship.
Without further ado, let’s dive into the top FIP improvers from the first half to the second half of 2018. FIP is designed to remove the effect of balls hit into play and uses events over which a pitcher has the most control: strikeouts, unintentional walks, hit batters and home runs.
| Name | ERA | FIP | ERA | FIP | Diff |
|---|---|---|---|---|---|
| German Marquez | 4.81 | 4.44 | 2.61 | 2.25 | 2.19 |
| Jakob Junis | 5.13 | 5.51 | 3.35 | 3.47 | 2.04 |
| Masahiro Tanaka | 4.54 | 4.91 | 2.85 | 2.98 | 1.93 |
| Kyle Hendricks | 3.92 | 4.58 | 2.84 | 2.78 | 1.80 |
| Homer Bailey | 6.68 | 6.29 | 5.28 | 4.51 | 1.78 |
We see German Marquez with the largest difference between halves, sporting a fantastic 2.25 FIP in the second half. Not far behind is Jakob Junis sitting in the second spot followed by Masahiro Tanaka, Kyle Hendricks, and Homer Bailey. Now that we have our names, it’s time to start digging into the data and identify the reasons (if any) for the sudden turn around in their seasons.
Pitch Information
In order to get pitch information for these players, I used the baseballr package to scrape some Statcast data from last season. I figured a good place to start would be to look at differences in pitch velocity from the first to the second half. I was expecting to see some velocity jumps where these guys might have been throwing harder in the second half, but things look pretty stable. The one that really jumps out at me from the five pitchers is Bailey, as he was throwing his fastball slightly harder and took something off his offspeed stuff. Marquez must have been playing around with his curveball because he was throwing it 2 mph harder in the latter half of 2018.
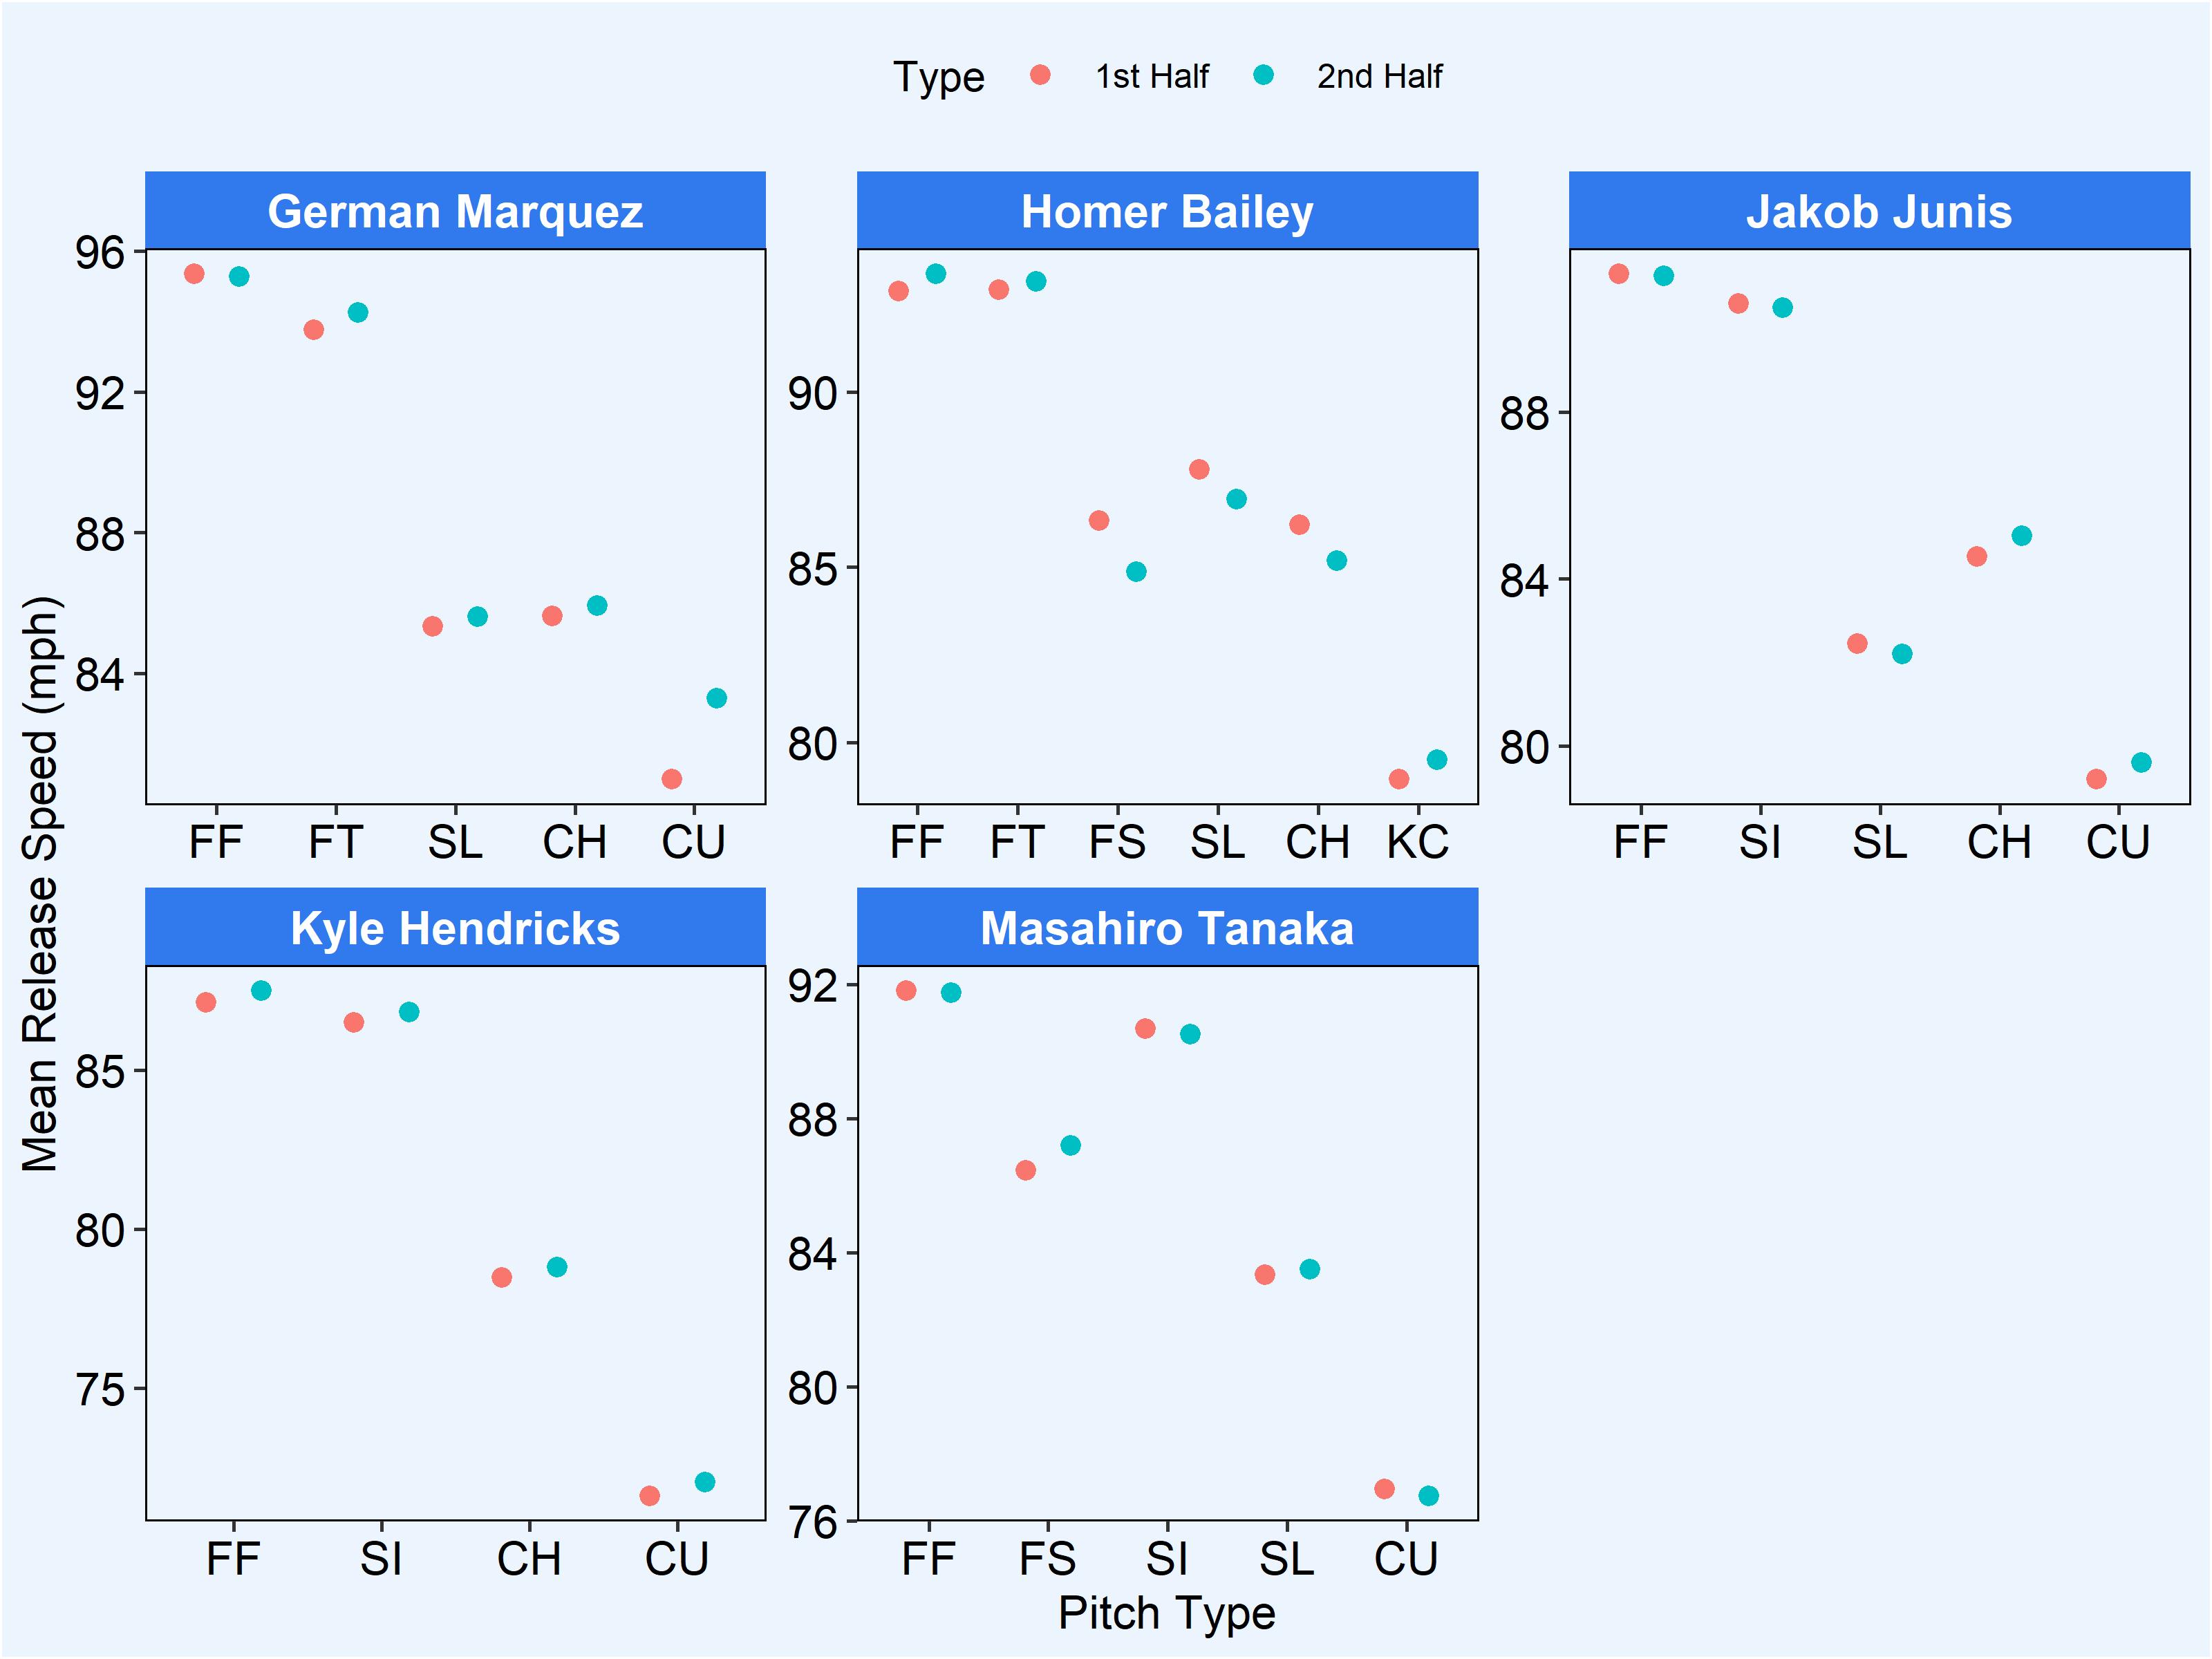
Other than Bailey, I didn’t really see any major differences between the first and second halves, so maybe the key lies in changes in pitch usage. Junis could potentially benefit from matching the velocity between this change-up and slider a bit more, but everything looks pretty standard. Below is a plot showing changes in pitch usage between the first and second half:
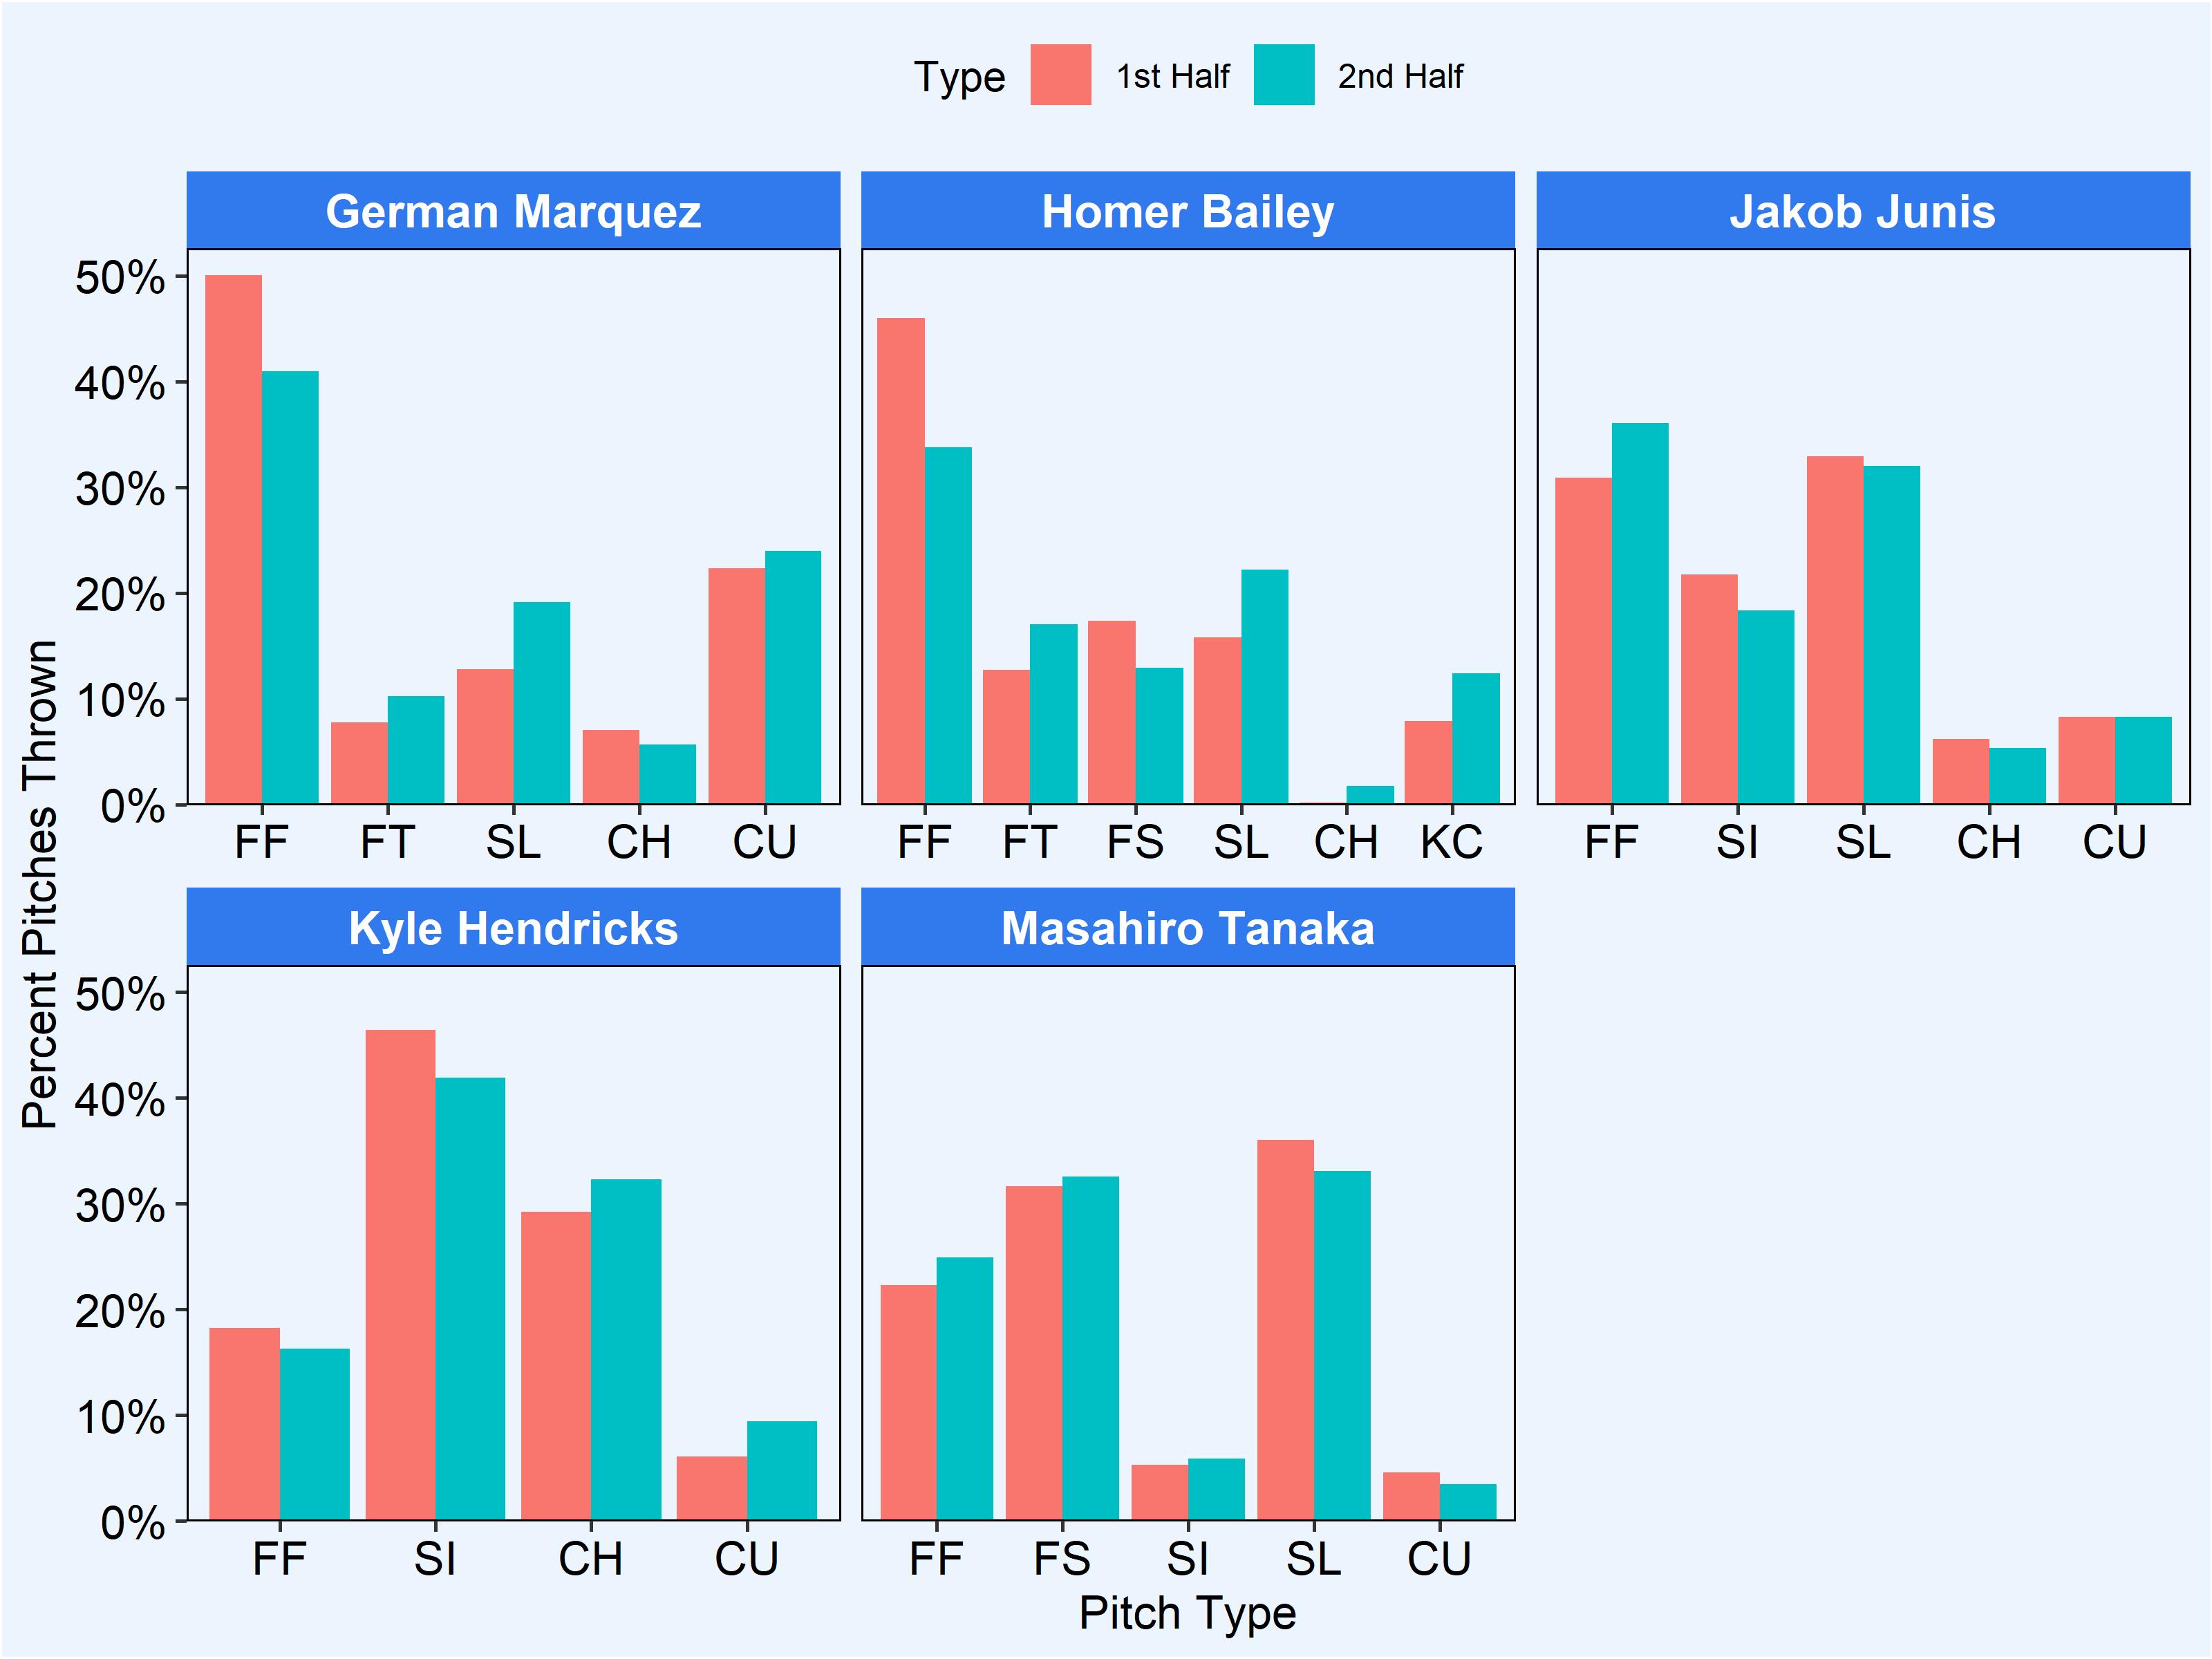
Now we’re cooking! I think you can identify some pretty significant changes for each of the pitchers, except for maybe Tanaka, who looks like he just continued to trust his stuff.
And before we dive into the pitch mix stuff, let’s take a look at Marquez’s slider just because it’s pretty:
Marquez made big changes to his pitch mix, notably a large drop in four-seam fastball use and an increase in his slider. His slider has been getting him a lot of attention lately, and it was largely credited as the pitch that helped turn him into a potential ace.
Bailey made the biggest change on this list, where he dropped his four-seamer use by 12% from the first to second half. He offset his fastball usage with a higher dependency on his slider, knuckle curve, and a tailing two-seamer.
Junis usually sits in the low 90s with his four-seam fastaball, and the team must have thought it was working for him better than his sinker. However, both pitches were considered negative by pitch value, and his sinker was a better pitch than his four-seam (-3.1 to -6.9).
Long been a champion of the sinker, Hendricks made some adjustments and threw some more offspeed pitches in the second half, which as we will see in a bit must have been effective at keeping hitters off balance.
Now that we have identified some interesting changes, we will see how those changes translated to the pitcher controlled stats. The black lines represent league average for each category.
FIP Influencers
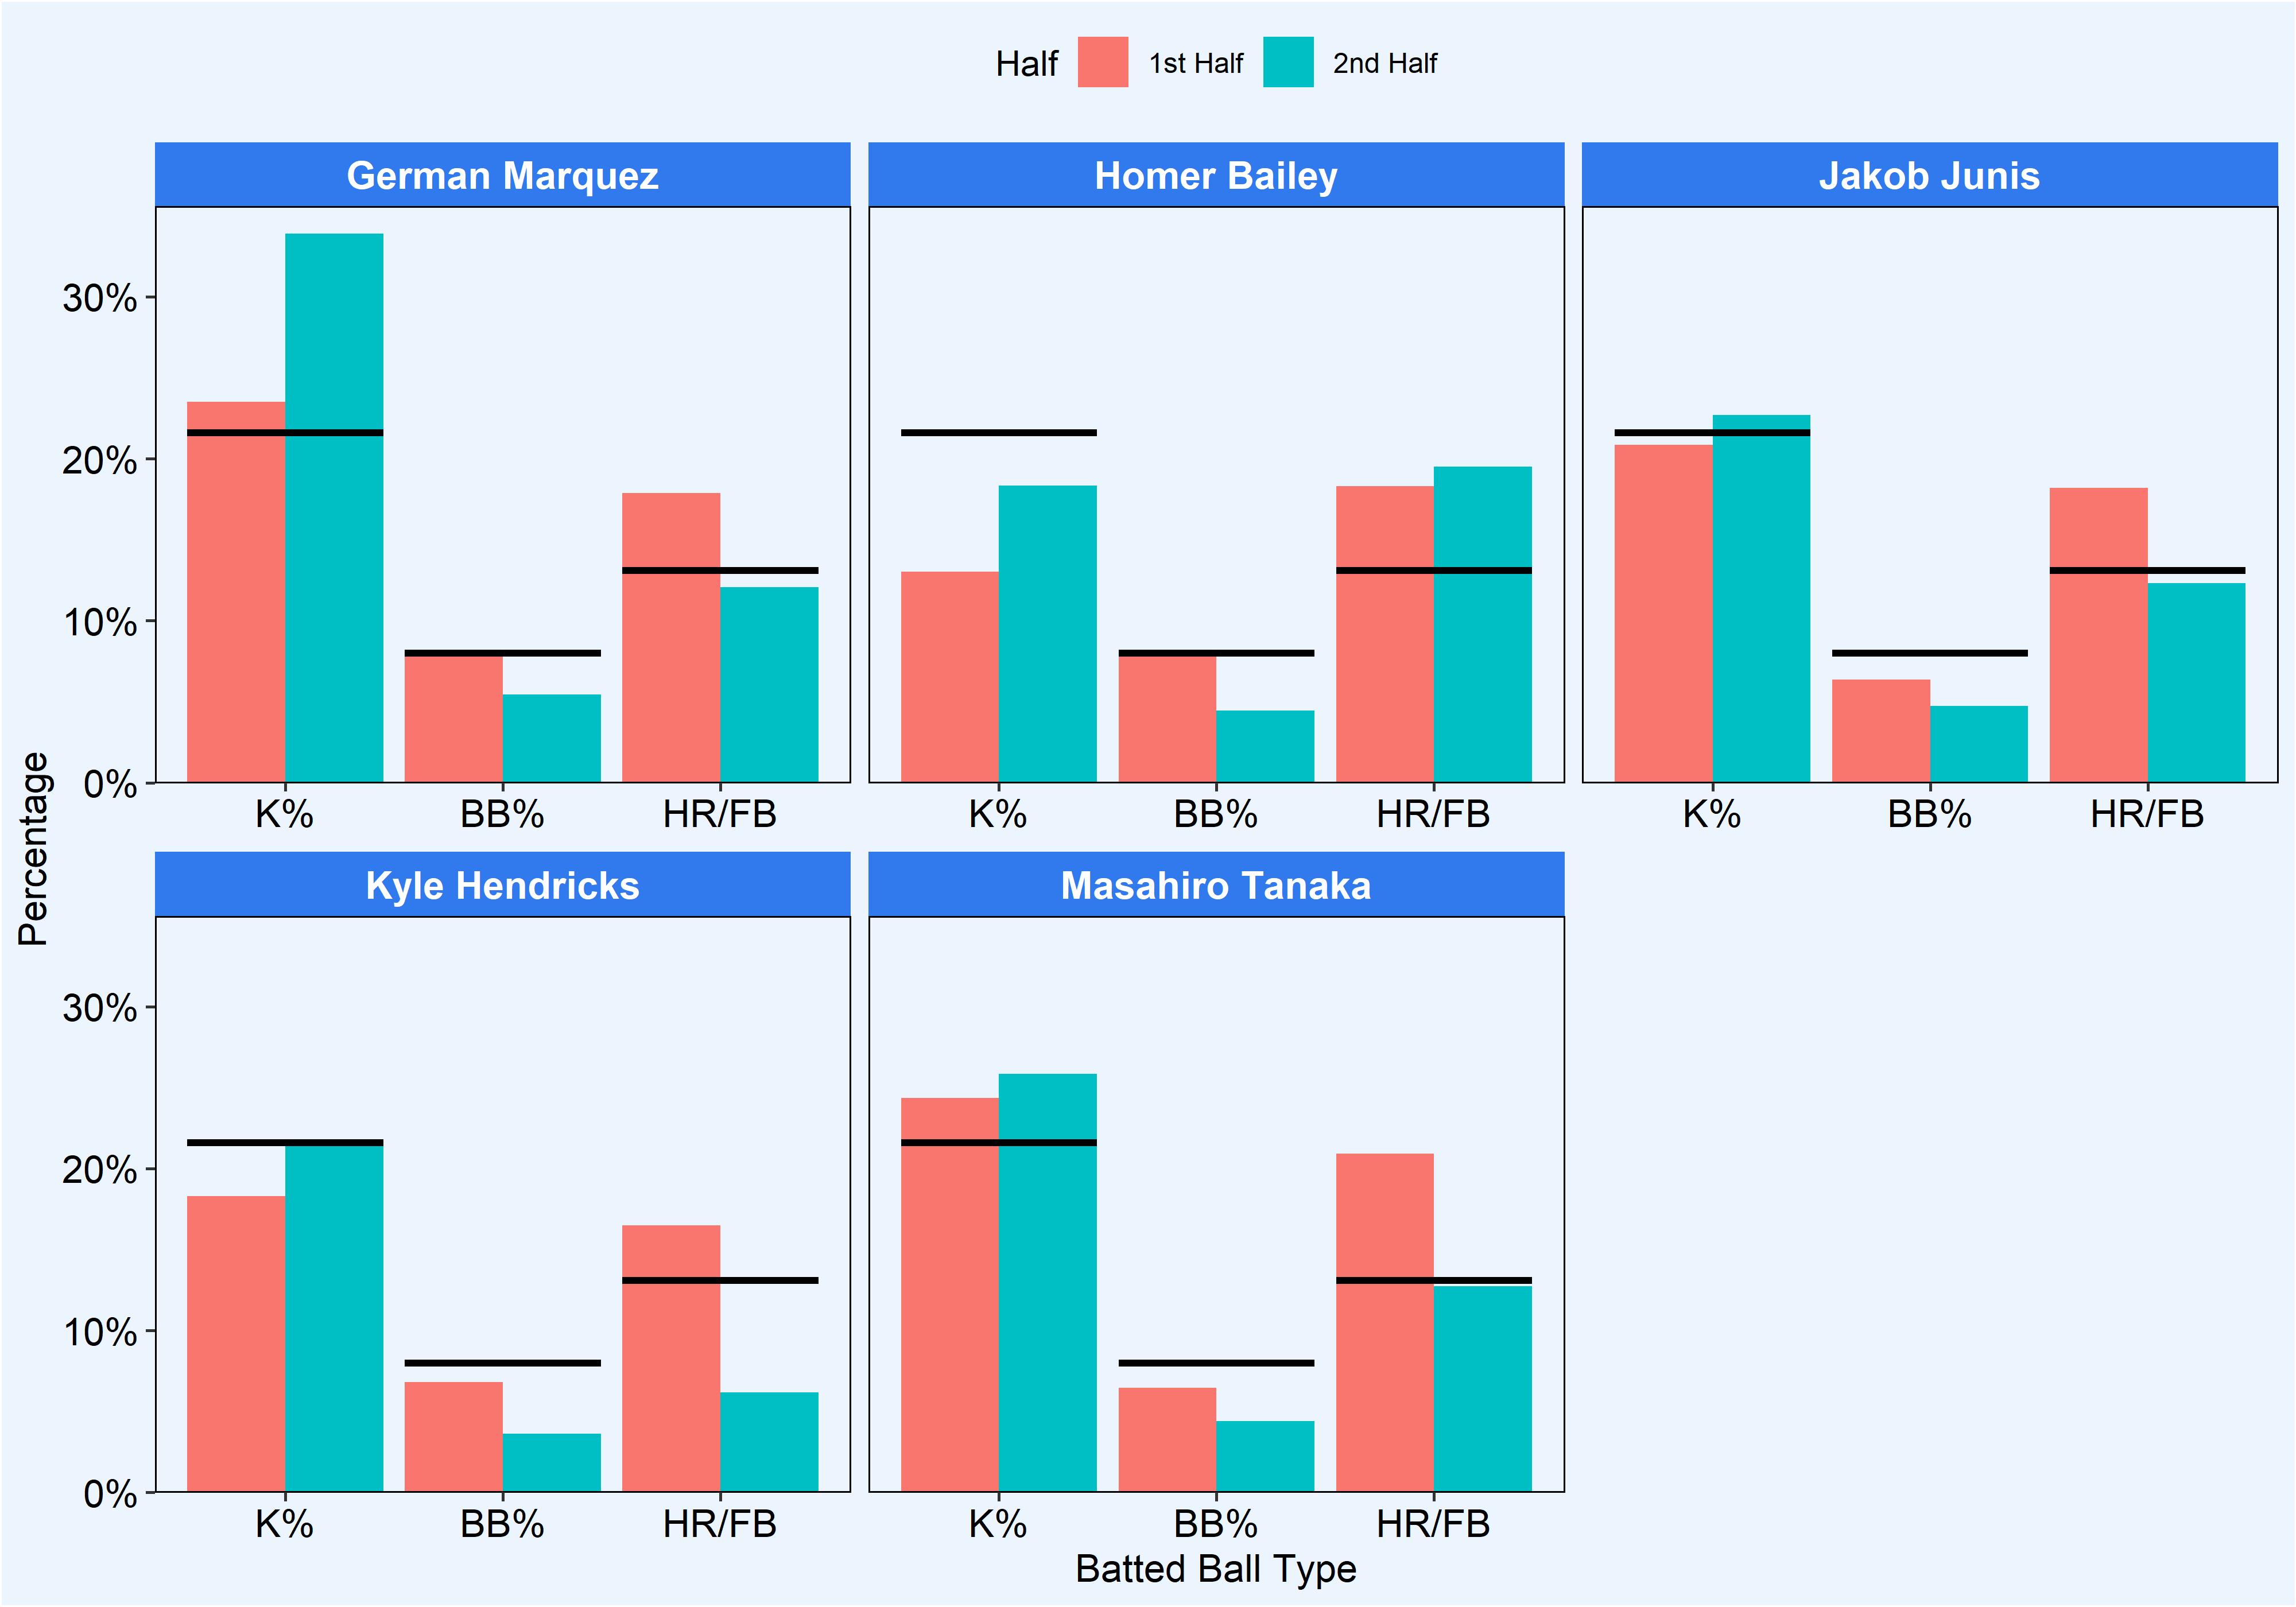
I think the first thing you notice from those plots is that there is clearly a common theme among the pitchers: increase K%, decrease BB% and HR/FB. As these three categories are those that affect FIP, it makes intuitive sense as to why these pitchers were able to improve their FIPs in the second half.
Marquez turned it way up in the second half, with his K% going all the way to 33.9% which is good enough to be ranked fifth among starting pitchers in the second half. Bailey was actually the only pitcher listed who was not able to decrease his HR/FB rate in the second half and actually had an 18.7% HR/FB rate in 2018, well above his career average of 12%. With such a high HR/FB rate, his xFIP looks far more attractive than his FIP for 2018 as a whole (5.55 FIP vs 4.65 xFIP).
There was a crazy drop in HR/FB for Hendricks, so I took a quick look his the exit velocity for all hits classified as line drives:
| Pitch Name | BB Type | Half | Mean EV | Mean LA | Num |
|---|---|---|---|---|---|
| 4-Seam Fastball | Line Drive | 1st Half | 100.40769 | 15.87277 | 13 |
| 4-Seam Fastball | Line Drive | 2nd Half | 102.22500 | 20.73500 | 4 |
| Changeup | Line Drive | 1st Half | 86.83462 | 19.01462 | 26 |
| Changeup | Line Drive | 2nd Half | 87.07812 | 18.98984 | 32 |
| Curveball | Line Drive | 1st Half | 92.67500 | 19.14275 | 4 |
| Curveball | Line Drive | 2nd Half | 88.10000 | 24.05650 | 2 |
| Sinker | Line Drive | 1st Half | 93.04419 | 16.09453 | 43 |
| Sinker | Line Drive | 2nd Half | 94.98387 | 16.68142 | 31 |
The funny this is, line drives were actually getting hit a bit harder in the second half. However, the number of balls classified as line drives decreased in the second half, and with no obvious changes in SwStr%, it may have been a case of better stuff in the second half.
VPR and kVPR
Finally, we get to the good stuff. The PitcherList specials, VPR and kVPR. I’ve added in two extra columns called Stability and kStability, they are calculated by (ES + NS)/(ES + NS + PS) to give those neutral starts some love. What the Stab% and kStab% should tell you are the proportion of starts in which pitchers threw a excellent or neutral start.
Marquez was everything you want your pitching studs to be and more. His numbers were really, really good in the first half, but his second half numbers really make you forget Jacob deWho. OK, well maybe not that good, but he was on fire. A VPR of 10 is fantastic. I would gladly take 10 ES and suffer through one clunker.
Even with his second half resurgence, Bailey was still not a viable fantasy option. With a second-half VPR stability of 37.5% and his all-or-nothing kVPR stats, it was probably not in your best interest to roster him.
In relation to strike outs, and removing Marquez from consideration, I wouldn’t put a ton of faith in the rest of the group. However, the last three on the list did perform well in the VRP category. They all posted VPR values greater than 1, and with Stab% all above 65%, you could have been fairly confident in them to go out and post some quality innings later in the season.
| Name | Half | ES | NS | PS | VPR | Vol | Stab | kES | kNS | kPS | kVPR | kVol | kStab |
|---|---|---|---|---|---|---|---|---|---|---|---|---|---|
| German Marquez | 1st Half | 8 | 3 | 8 | 1.00 | 84.21 | 57.89 | 4 | 4 | 11 | 0.36 | 78.95 | 42.11 |
| German Marquez | 2nd Half | 10 | 3 | 1 | 10.00 | 78.57 | 92.86 | 8 | 1 | 5 | 1.60 | 92.86 | 64.29 |
| Homer Bailey | 1st Half | 2 | 1 | 9 | 0.22 | 91.67 | 25.00 | 1 | 0 | 11 | 0.09 | 100.00 | 8.33 |
| Homer Bailey | 2nd Half | 2 | 1 | 5 | 0.40 | 87.50 | 37.50 | 2 | 0 | 6 | 0.33 | 100.00 | 25.00 |
| Jakob Junis | 1st Half | 5 | 5 | 7 | 0.71 | 70.59 | 58.82 | 2 | 3 | 12 | 0.17 | 82.35 | 29.41 |
| Jakob Junis | 2nd Half | 4 | 6 | 3 | 1.33 | 53.85 | 76.92 | 3 | 3 | 7 | 0.43 | 76.92 | 46.15 |
| Kyle Hendricks | 1st Half | 6 | 6 | 7 | 0.86 | 68.42 | 63.16 | 3 | 6 | 10 | 0.30 | 68.42 | 47.37 |
| Kyle Hendricks | 2nd Half | 8 | 2 | 4 | 2.00 | 85.71 | 71.43 | 5 | 3 | 6 | 0.83 | 78.57 | 57.14 |
| Masahiro Tanaka | 1st Half | 5 | 3 | 7 | 0.71 | 80.00 | 53.33 | 5 | 3 | 7 | 0.71 | 80.00 | 53.33 |
| Masahiro Tanaka | 2nd Half | 7 | 1 | 4 | 1.75 | 91.67 | 66.67 | 4 | 1 | 7 | 0.57 | 91.67 | 41.67 |
There’s no guarantee that any of this success is going to translate into next season, but it should be encouraging to see the adjustments and subsequent improvement. People are already on the Marquez hype train for next season with his ADP on Fantrax currently sitting at the 81st player off the board. Hendricks and Tanaka are being valued very similarly going at 126 and 131 respectively. Junis is sitting back a few tiers and is being drafted at 308. Bailey is currently not going in the top 1000, but he doesn’t really have a team at the moment.
Stay tuned over the next couple weeks as the PitcherList team begins rolling out our 2019 season ranking, and check out Austin Bristow’s top 300 rankings that he released earlier this winter.
The number of line drives decreasing is more important than the average velocity of those line drives increasing a little.
Some of those “line drives” may have had a decreased velocity to the point where they became grounders or fly balls, but those velocities disappear from the average.