


There are myriad statistics that analysts can use to gauge the success of a pitcher. When I’m piecing together why a pitcher is performing a certain way, one of the metrics I’ll start with is F-Strike. For those unfamiliar with the metric, it’s a quick way to see who is having success going from 0-0 counts to 0-1 counts and can be found on FanGraphs here, with more information here.
Getting ahead in the count is important for a pitcher’s success. To no one’s surprise, wOBAs differ drastically when a pitcher gets behind and when he gets ahead:
| Count | wOBA |
| Through 0-1 | .269 |
| Through 1-0 | .363 |
Because getting ahead is so important, one would think the F-Strike leaderboard would be a good place to start when analyzing a pitcher. The more frequently a pitcher is able to get into those 0-1 counts, the more success they should theoretically have. Here are the F-Strike leaders as of my writing this piece:
| SP | F-Strike |
| Chris Paddack | 74.4 |
| Clayton Kershaw | 70.9 |
| Masahiro Tanaka | 70.4 |
| Max Scherzer | 70.1 |
| Madison Bumgarner | 69.6 |
| Zach Eflin | 68.5 |
| Kyle Hendricks | 68.4 |
| Kenta Maeda | 68 |
| Tyler Mahle | 68 |
| Rick Porcello | 67.8 |
| Kyle Gibson | 67.6 |
| Miles Mikolas | 67.5 |
| Chris Sale | 67.3 |
| Blake Snell | 66.8 |
| Zack Greinke | 66.8 |
At first glance, this makes a lot of sense. Chris Paddack has the second-best Zone% in baseball, Clayton Kershaw has another sub-3.00 ERA, and Zack Greinke is putting up the best BB/9 of his career. Remember, this leaderboard doesn’t mean that Miles Mikolas isn’t having slider issues—he is—or that Blake Snell is having the same success as last year—he isn’t—but I’m not looking for it to do that. I utilize this leaderboard as a starting place and, typically, if I see a name here, I think “getting ahead” may not be what’s behind a pitcher’s struggles. This, as is turns out, is the wrong way of thinking.
The Trouble With F-Strike
As mentioned, F-Strike includes every instance in which the count goes from 0-0 to 0-1. The important caveat? Batted balls count as a strike. If a pitcher gives up a hit in an 0-0 count, this positively benefits his F-Strike, giving you the impression that he’s having success getting ahead when in fact he could be getting hit hard in 0-0 counts. That’s a pretty significant caveat, especially considering the league is trending toward more aggressive hitters.
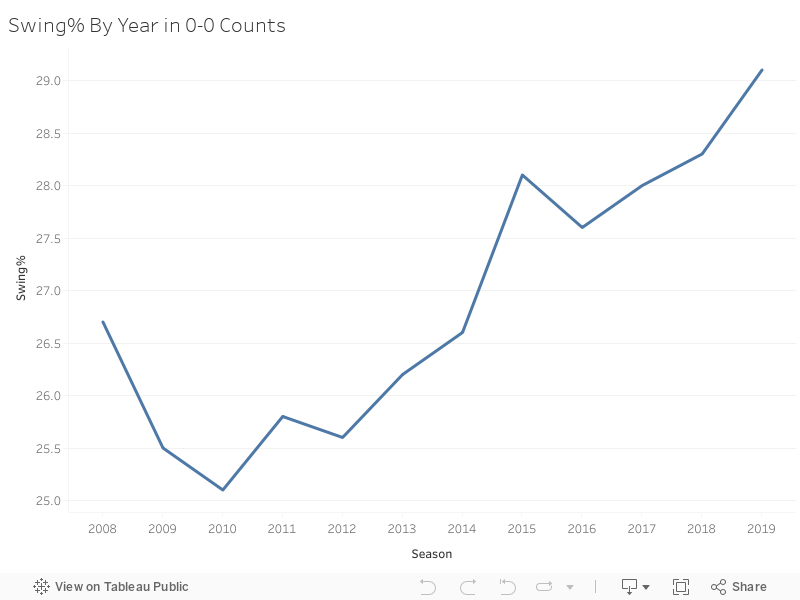
This season, hitters are being more aggressive in 0-0 counts than they have since at least 2008 (as far back as the Baseball Savant database goes). It isn’t just the fact that hitters are swinging more, though, it’s the fact that they’re having more success in those counts as well.
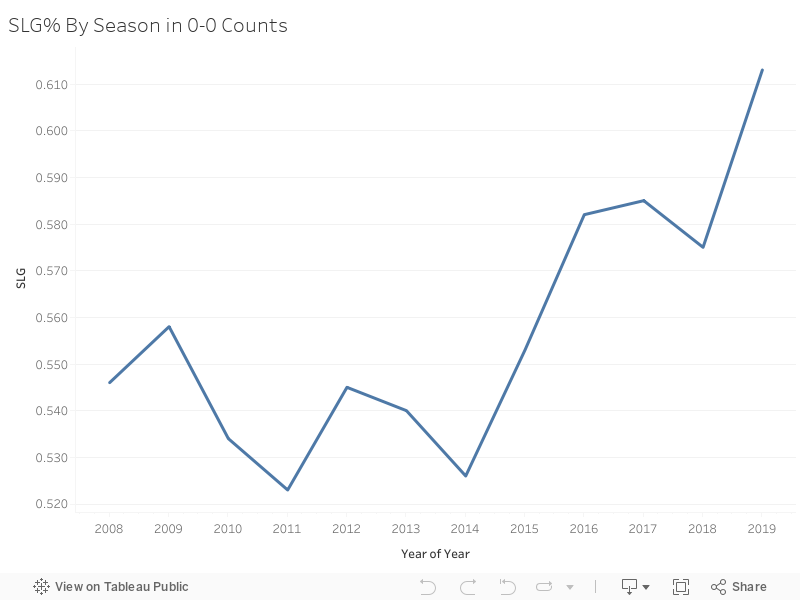
Slugging percentage is higher in 0-0 counts than it’s ever been. (For those curious why I used slugging percentage over wOBA, the latter includes walks, which wouldn’t be beneficial to look at in 0-0 counts. For what it’s worth, though, the same trend appears in wOBA). If batters are swinging and having success more than ever in 0-0 counts, then there should be a larger weight given to those who successfully get to 0-1 counts. Due to F-Strike including batted balls, though, the metric could be relaying some false information and therefore not necessarily helping us find what we’re looking for. If we remove batted balls from the equation and instead focus on called strikes and whiffs—or CSW rate—in 0-0 counts, perhaps we could get a clearer picture of who is really having success.
| SP | CSW in 0-0 Counts |
| Kyle Henricks | 49.6 |
| Kenta Maeda | 49.4 |
| Blake Snell | 49 |
| Chris Sale | 47.5 |
| Max Scherzer | 47.4 |
| Chris Paddack | 46.9 |
| Tyler Mahle | 46.6 |
| Kyle Gibson | 46.4 |
| Masahiro Tanaka | 45 |
| Homer Bailey | 44.6 |
| Caleb Smith | 44.4 |
| Domingo German | 44.3 |
| Stephen Strasburg | 43.9 |
| Justin Verlander | 43.8 |
| Mike Minor | 43.7 |
There’s a lot to unpack here. First and foremost, the percentages are far lower, which makes sense as we’re removing all batted balls from the equation. Second, while there are some names that remain present in both top-15 leaderboards—Paddack, Max Scherzer, Snell, etc.—there are a good amount of names missing as well. Most noticeably, Kershaw, who has dropped from second on the F-Strike list to 88th on the CSW in 0-0 counts leaderboard.
88TH!
That’s a pretty noticeable drop. Considering the only thing we removed from the equation was batted balls, the reason for the stark drop shouldn’t be too difficult to find.
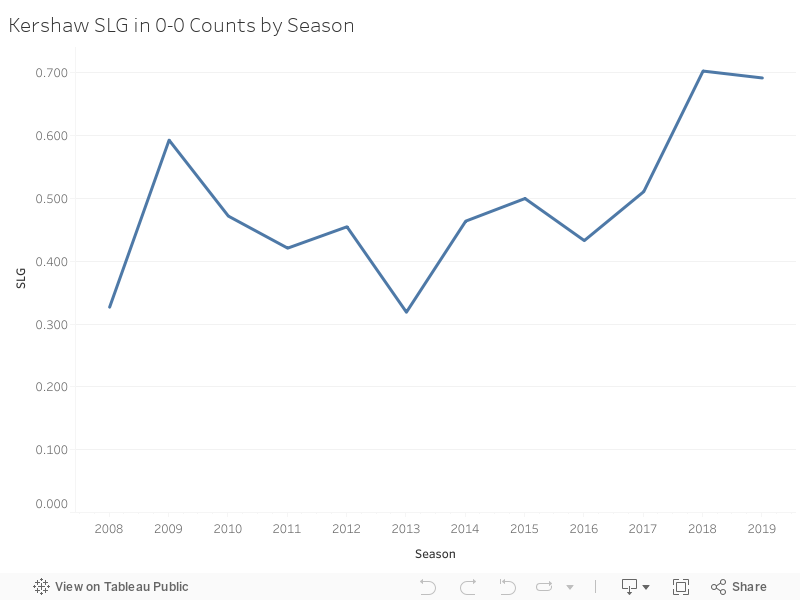
For the past two seasons, Kershaw has been getting shelled in 0-0 counts. Coincidentally, the last two seasons are the first in which Kershaw has posted a 70% F-Strike, too.
Theoretically, I could end this article right here. TL;DR: If you want to know simply who is doing well at getting ahead in the count, CSW in 0-0 counts may be more valuable to look at than F-Strike. By removing batted balls from the equation we can get a better idea of which pitchers are actually getting ahead in the count more. If that’s the only thing that you take away from this article, then I consider that a win.
But.
There seems to be more here.
Next Steps
We can assume that the pitchers who appear high on the F-Strike leaderboard but low on the CSW leaderboard are likely getting hit harder in 0-0 counts, but who is that happening to and why? Let’s start by taking a look at the F-Strike-minus-CSW leaderboards:
| SP | F-Strike – CSW |
| Clayton Kershaw | 35 |
| Jacob deGrom | 28.7 |
| Mike Soroka | 28.4 |
| Zack Wheeler | 27.8 |
| David Hess | 27.6 |
| Chris Paddack | 27.5 |
| Carlos Carrasco | 27.3 |
| Madison Bumgarner | 27.2 |
| Anibal Sanchez | 26.6 |
| German Marquez | 26.5 |
| Yonny Chirinos | 26.5 |
| Martin Perez | 26.2 |
| Ivan Nova | 25.9 |
| Michael Wacha | 25.8 |
| Adrian Sampson | 25.7 |
While it’s not a surprise to see Kershaw leading this list—let’s not forget he went from second on one leaderboard to 88th on the other—it does come as a shock to me to once again see Paddack in the top 10. One would think a large disparity between F-Strike and CSW would indicate that the particular pitcher was getting hit harder in 0-0 counts, but Paddack’s slugging allowed in those counts is pretty run-of-the-mill.
But wait. What about foul balls?
Paddack leads the league in foul-ball rate at 24.8%, and behind him is Jacob deGrom at 24.5%. It seems that foul balls are accounting for a lot of the disparity we’re seeing above. By adding foul balls to CSW, which only takes foul tips into account, we may be able to get an even more accurate version of who’s getting ahead in counts.
We’ll call this CSW + F or CSWF% for short.
(I’d be remiss if I didn’t bring up an important conversation the addition of foul balls sparked with my colleagues: Are foul balls good or bad? I was hesitant to include foul balls because I couldn’t make up my mind as to whether they were good for the pitcher. If they weren’t, I felt they shouldn’t be included as it would make the metric misguided. After some in-depth conversations with colleagues and after reading the work Alex Chamberlain’s recently done over at FanGraphs, I came to the consensus that while there’s no binary answer, foul balls would best to be included in the analysis.)
| SP | CSWF% in 0-0 Counts |
| Max Scherzer | 63.3 |
| Chris Paddack | 60.7 |
| Kenta Maeda | 59.4 |
| Blake Snell | 59.3 |
| Kyle Hendricks | 58.4 |
| Chris Sale | 57.1 |
| Tyler Mahle | 57.1 |
| Gerrit Cole | 56.2 |
| Masahiro Tanaka | 56.1 |
| Rick Porcello | 55.9 |
| Madison Bumgarner | 55.7 |
| Jeff Samardzija | 55.2 |
| Justin Verlander | 55 |
| Jose Berrios | 54.4 |
| Mike Leake | 54.4 |
The above leaderboard correlates better than F-Strike to two very important metrics: ERA and two-strike rate (a metric by Nick Gerli). As a result, I believe CSWF% is the best metric to use when trying to determine who is getting ahead in the counts. If you want to see a full leaderboard, you can check the link here.
Before we wrap up, let’s once again take a look at those with the biggest positive and negative difference between CSWF% and F-Strike to see if we can find a reason for the disparity. We’ll start by taking a look at whose CSWF% most closely resembles their F-Strike. We can safely assume that these players are not giving up that much contact in 0-0 counts:
| SP | (F-Strike) – (CSWF%) |
| Max Scherzer | 6.8 |
| Sonny Gray | 6.8 |
| Gerrit Cole | 6.9 |
| John Means | 7.4 |
| Blake Snell | 7.5 |
| Charlie Morton | 7.7 |
| Jack Flaherty | 7.8 |
| Domingo German | 7.9 |
| Jeff Samardzija | 8.3 |
| Kenta Maeda | 8.6 |
| Brandon Woodruff | 8.6 |
| Pablo Lopez | 8.6 |
| Caleb Smith | 9.1 |
| Walker Buehler | 9.1 |
| Tyler Skaggs | 9.3 |
The below list is the pitchers whose CSWF% is furthest away from their F-Strike:
| SP | (F-Strike) – (CSWF%) |
| Clayton Kershaw | 18.7 |
| Michael Wacha | 17 |
| Mike Soroka | 16.7 |
| Zach Eflin | 16.5 |
| Jon Gray | 16.2 |
| Kevin Gausman | 15.6 |
| German Marquez | 15.4 |
| Carlos Carrasco | 14.9 |
| Ivan Nova | 14.9 |
| Anibal Sanchez | 14.7 |
| J.A. Happ | 14.6 |
| Adrian Sampson | 14.4 |
| Kyle Gibson | 14.3 |
| Masahiro Tanaka | 14.3 |
| Jose Quintana | 14 |
As much as I wish I could provide you with a concrete answer as to why some of the names are on the list above, there isn’t one. While Kershaw’s slugging allowed has drastically increased in 0-0 counts, the same isn’t happening for Mike Soroka, who has a much better SLG in those counts. While Kevin Gausman is also high on this list, it doesn’t show that his BABIP in 0-0 counts is actually an unsustainably high .500. I thought perhaps names with low CSWF% rates would have higher slugging allowed all the time, but they don’t. Zach Davies has the second-worst CSWF% rate but his slugging allowed is below league average in 0-0 counts. I thought maybe this could be a BABIP issue, but no—Davies’ BABIP in 0-0 counts is at .298. Perhaps he’s getting behind and giving up walks? As his 2.73 BB/9 can attest, he’s not doing it all that much.
I even tried to rationalize everything by pointing to the fact that four-seam usage in 0-0 counts is at an MLB high (true), and that hitters are hitting 0-0 four-seamers better than they ever have (true), which could lead you to believe that the pitchers above are throwing a lot of first-pitch fastballs and getting burned. While that would be incredibly convenient, it isn’t true.
And, to be honest, I’m glad it isn’t.
It’s vital to reiterate that while getting ahead in the count is very important for a pitcher, there’s still plenty more for a pitcher to do. While CSW and CSWF% in 0-0 counts correlates better to ERA than F-Strike, none of those metrics correlate very strongly to ERA or FIP or SIERA, for that matter. That doesn’t mean CSWF% isn’t worth looking at, it’s still—I believe—the best tool for figuring out who is getting ahead, but figuring out what’s happening with a pitcher is never going to be explained by a single metric. Rather, it’s a slew of different metrics coming together to paint one larger picture. One could be viewing CSWF% rate in 0-0 counts in correlation with CSW overall or a pitcher’s two-strike rate to get a better picture, for example. I merely want to provide you with a more accurate puzzle piece to help you in your analysis, and I firmly believe CSWF% does that better than F-Strike. By having a better sense of who is getting ahead, you now have a better starting point for analyzing what is actually going on with a pitcher.
Featured image by Justin Paradis (@FreshMeatComm on Twitter)
Good stuff, Alex. You mention that the correlations are stronger with CSWF% than F-strike to ERA and two strike rate. I know they’re not very strong correlations but what I’m curious, what are they? And how do they correlate with something like say, SwStrk%?
Hey! Thanks for reading. I’d have to double check my notes when I get home but the r2’s were like .03 for F-strike to ERA and .07 to CSWF if I recall correctly. And were you curious to see how they correlated to SwStrk overall or just in 0-0 counts?
SwStrk% overall please.
Also, accounting for 7% of variance with a univariate model is nothing to sneeze at. Particularly, when your explanatory variable is a true peripheral stat (as opposed to running some kind of time series on year-over-year results). But that’s why I’m curious how it stacks up against something like SwStrk%.
Thanks again.