


Two primary traits dictate the success or failure of an MLB hitter: 1) ability to make contact with the ball and 2) capacity to hit the ball hard. The first skill relates to a hitter’s skill at avoiding strikeouts, which are the worst possible outcomes of at-bats. The second involves how likely the ball, once contact is made, to result in a hit.
Consequently, the goal of every batter is to make contact and maximize the exit velocity on that contact. But achieving this harmony is a complex affair and largely unattainable for most hitters because of a distinct inverse relationship between hitting the ball and hitting the ball hard.
No Free Lunch
Economist Milton Friedman popularized the expression, “There is no such thing as a free lunch,” in a similarly titled 1975 book. Friedman used the phrase to highlight how it’s impossible to get something for nothing, indicating that every action, decision, or policy comes with an opportunity cost. It turns out that the underlying skill set and hitting strategy of MLB batters is bound by similar principles.
Most baseball fans are familiar with the behavioral adjustments hitters make in two-strike counts. They’ll choke up on the bat and put shorter, more compact swings on the ball in order to avoid whiffing their way into a strikeout. This adjustment increases the odds of making contact but severely decreases the likelihood of a deep, well-hit drive.
Think of the two-strike approach as a microcosm of how different players hit. Rather than making more contact through some type of voodoo sorcery, players with low whiff rates simply choose to employ a more conservative approach at the plate. This enables them to whiff and strikeout less but at the cost of making hard contact. The opposite is true for free-swingers, who put violent hacks on the ball that result in home runs as well as swings and misses.
While I suspect most baseball fans would agree that there is some type of trade-off between smacking home runs and making contact, I doubt they understand the robustness of the relationship. I certainly didn’t until writing this article. Take a look at the top 10 and bottom 10 players in whiff percentage from 2016 to 2018, along with their associated barrel rates, a proxy for hard contact.
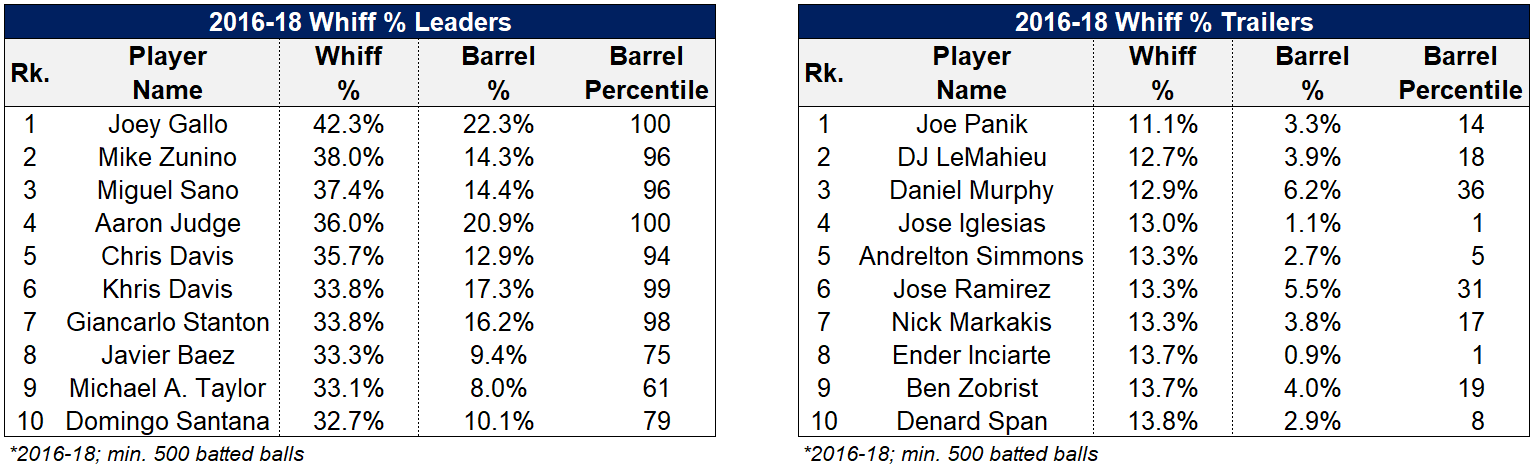
The top seven players in whiff rate all posted barrel rates in the 94th percentile or higher. There wasn’t a single player in the top 10 below the 61st percentile. Meanwhile, among the 10 players that make the most contact, Rockies first baseman Daniel Murphy paced them with a 36th percentile barrel rate. These players are clearly making a choice to hit a certain way.
Further, of the players with the 25 highest whiff rates, the median barrel percentile was 84th, with no player below the 45th percentile. Of the 25 lowest whiff rate players, the median barrel percentile was 18th, with the highest barrel rate tracking at 54th.
Re-read the last two paragraphs and munch on those numbers for a second. Extreme high whiff rate players are almost guaranteed to barrel the ball at an above average rate, while extreme low whiff hitters are guaranteed not to. Forget innate raw power — on either end of the extreme, whiff rate is explaining most of what you need to know about the overall level of a player’s barrel rate.
Establishing the Relationship
Before delving further into the analysis, it’s important to outline the variables we’re using to approximate contact ability and batted-ball authority.
Whiff rate, measured as swings and misses divided by swings, is the best measure of contact ability, given its extremely tight relationship with strikeouts. Other stats such as swinging-strike rate and chase rate have either a much lower relationship or no relationship at all with strikeout rate.

There are several relevant stats from which to choose to estimate quality of contact. Barrel rate, calculated as barrels divided by batted-ball events (Brl/BBE), has the strongest whiff rate relationship with a correlation of 0.69 and r2 of 0.47. Stats such as slugging percentage on contact (SLGcon) and exit velocity on flies and liners (EV FB/LD) have similar, albeit slightly weaker, relationships as barrel rate.
Note that launch angle and whiff rate exhibit almost no relationship, an interesting finding given the consensus that uppercut, fly-ball-centric swings make players prone to striking out. Additionally, batting average on contact (BAcon) displays a much weaker correlation to whiff rate than SLGcon and ISOcon. This shows that the biggest differentiator in offensive performance between low- and high-whiff players is not necessarily their ability to get a hit — it’s to make that hit go for extra bases.
While SLGcon and BAcon correlate more strongly with overall offensive production than barrel rate, they are also biased by ballpark factors. As a result, this analysis will continue to focus on the relationship of barrel rate, a relatively park-neutral metric, and whiff rate, which is highlighted in the graph below.
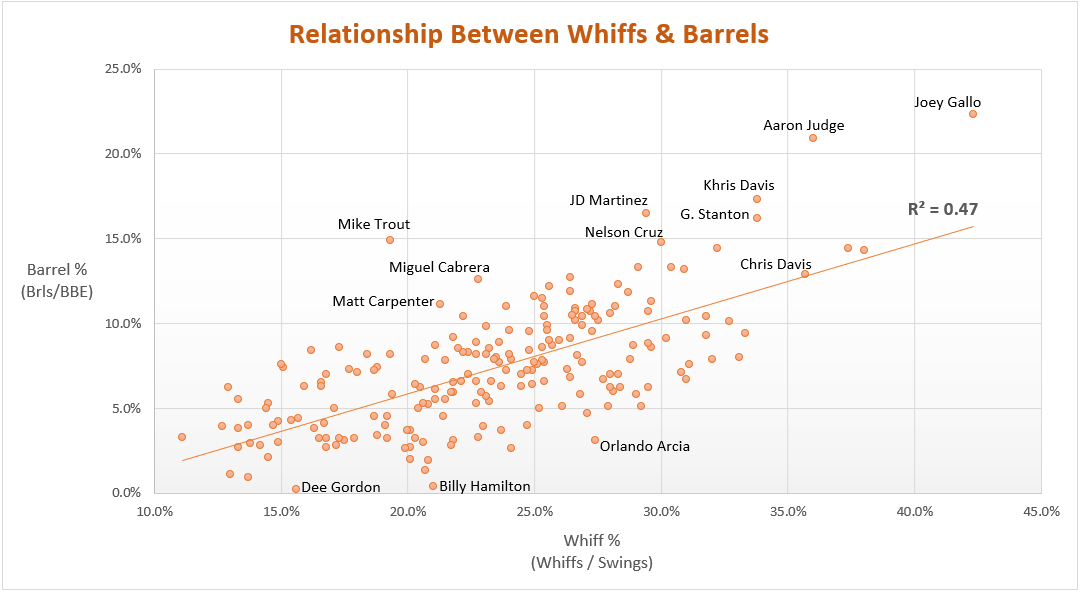
The cluster of dots on the graph, derived from 2016-18 performance, along with the best fit line drawn through them, indicate a direct relationship between whiff rate and barrel rate. An r2 of 0.47 stipulates that variance in whiff rate explains 47% of the change in barrel rate.
Thus, nearly half of the skill underlying barrel rate is dictated by a player’s plate approach. And one approach isn’t necessarily better than the other. Free swingers will hit more barrels, but whiff and strikeout more, while conservative hitters will shun extra-base hits in favor of fewer strikeouts.
Good hitters are capable of deriving more barrels than expected given their whiff rate. The best fit line in the graph serves to demarcate these hitters. Those that place above the line are achieving an accretive balance between whiffs and barrels while those below the line are not. It’s no surprise that Mike Trout exhibits the largest positive distance above the line, while hitters like JD Martinez, Khris Davis, Aaron Judge, and Nelson Cruz also trend far above the line.
Moreover, the relationship between whiff rate and barrel rate becomes exponential after a certain point, meaning that as whiff rate increases, the barrel rate needed to sustain success goes up. Note how there are no hitters below the best fit line after a roughly 33% whiff rate. The fewer balls a hitter puts into play, the more they rely on extra-base hits to derive value.
Whiff Rate Gainers and Losers
While cumulative performance over multiple years certainly indicates a strong relationship between whiff rate and barrel rate, what about when individual players change their approach? To test this, I surveyed the 20 players with the biggest two-year decline in whiff rate from 2016 to 2018.
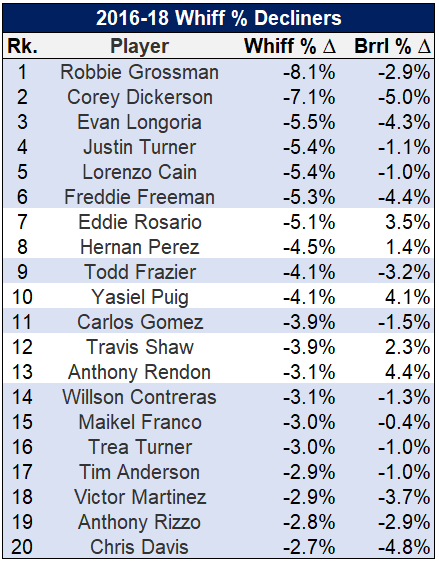
Fifteen of the 20 players experiencing the biggest decline in whiff rate also experienced a decline in barrel rate, highlighted by the blue rows. The movements at the top were particularly pronounced, with Robbie Grossman’s 8.1% whiff rate decline hitched to a 2.9% barrel rate reduction. Pirates outfielder Corey Dickerson underwent a similar change, with his whiff rate decreasing by 7.1% and barrel rate by 5.0%. Evan Longoria and Freddie Freeman also experienced large declines in barrel rate to go along with their whiff rate improvement.
The progress of Eddie Rosario, Yasiel Puig, Travis Shaw, and Anthony Rendon is particularly impressive, as they are the rare hitters to improve both their contact and batted-ball quality. However, both Puig and Shaw are struggling severely in early 2019. It will be interesting to see if these players can hold the gains they made over the previous two years.
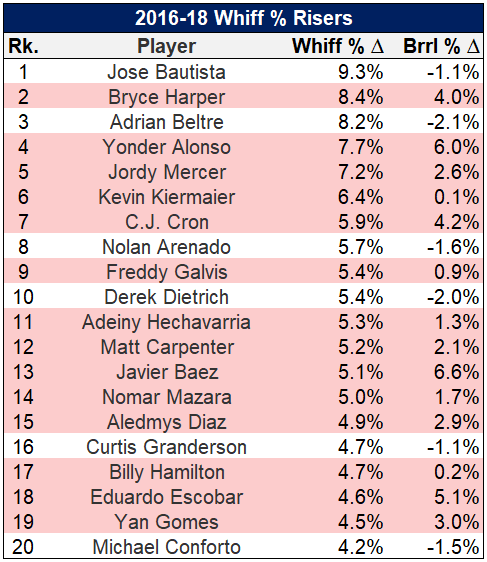
The other side of the ledger tells a similar story, with 14 of the top 20 whiff rate risers also experiencing increases in barrel rate. And that’s with three of the players failing to achieve barrel increases — Jose Bautista, Adrian Beltre, and Curtis Granderson — profiling as aging players with deteriorating skillsets.
Yonder Alonso and CJ Cron provide perfect test cases of players with limited natural power retooling their approach to hit more home runs at the expense of striking out more. Cardinals third baseman Matt Carpenter also typified this approach, ascending the ranks from a 15% strikeout rate, .150 ISO hitter to a 24% strikeout rate, .240 ISO hitter.
Bryce Harper’s appearance on this list is an interesting one. His 4.0% increase in barrel rate is a bit overstated by an injury-plagued 2016 season that depressed his power output. However, he’s displaying a very real trend of trading whiffs for barrels, with his 2019 whiff rate increasing another 8.1% above his 2016-18 change and his barrel rate going up an additional 3.3%.
The Exceptions
Are there are any players who deviate significantly from the whiff rate, barrel rate relationship in a positive way?
Of the 204-player sample I analyzed from 2016-18, there was one true positive outlier: Trout. Trout ranked in the 76th percentile in whiff rate and 98th in barrel rate and was the only player to exceed the 75th percentile in both metrics.
Dropping the threshold to 65th percentile for whiff rate and barrel rate adds another four players to the mix: Carpenter, Mike Moustakas, Justin Turner, and Joey Votto. Going further down to the 50th percentile only results in 29 players (14%) passing the test.
In fact, in order to have 50% of the league exceed the limits on both whiff rate and barrel rate, the threshold would need to be lowered to the 25th percentile. That’s indicative of some serious performance polarization.
Conclusions and Further Research
There is a very real trade-off between hitting for contact and power. Armchair analysts tend to compartmentalize these aspects of player ability, bemoaning increases in whiff rate and celebrating improvements in barre rate. However, as Friedman exclaimed, there is no free lunch! If a player is hitting more barrels, it’s likely that he’s swinging and missing more too. If his contact ability improves, it’s likely that his power output goes down. Understanding this relationship will help fans have a better perspective on the complex recipe that determines a hitter’s overall success.
As an additional test of the relationship’s robustness, I analyzed the monthly variation in whiff rate and barrel rate among 74 hitters who took at least 150 swings and hit 25 batted balls every month in 2016. The average r2 for each hitter was 0.24, a fairly significant result given all of the inherent noise in month-to-month player performance.
Further research should explore why this relationship holds so strongly. I suspect that the dynamics of a hitting a 95 mph baseball more than 375 feet are exceedingly difficult and complex. Sacrifices must be made in order to achieve desired outcomes. And while hitters might be able to game the system in short intervals to improve in both contact and contact quality, pitchers eventually find ways to exploit whatever adjustments those hitters made.
Illustration by Justin Paradis (@freshmeatcomm on Twitter)
Interesting article, thanks! Setting aside Trout, Carpenter, Moustakas, Turner, and Votto, who were the other 24 hitters in the top half of both metrics 2016-18?
Thanks!
Abreu, Correa, Y. Alonso, Haniger, McCutchen, Yelich, M. Cabrera, Longoria, S. Perez, Granderson, Arenado, Machado, Shaw, Braun, Ramos, K. Seager, C. Santana, Blackmon, Beltre, Rizzo, Cano, Betts, Rendon.
Swing hard in case you hit it! You don’t really need further research – its definitely not complex, although I am sure you could make it out to be if you wanted to. The further you get from the field, the more complicated it gets to see what is actually happening. I wouldn’t say that pitchers adjust to win, but that it is an approach that is inherently going to provide inconsistent results. Its a great strategy to climb the Statcast leaderboards – on-field results will vary.