


Recently I wrote about the proper usage of ERA indicators based on their relative predictive value in light of the fact that I found myself using them without a deeper understanding of why. I think this is something a lot of casual fantasy baseball players can appreciate. A friend insults a pitcher you like based on a high ERA, so you run to his Fangraphs page, find the SIERA, xFIP, or FIP (whichever’s lowest), and spit it back out at your friend. Worse yet, you’ll do it on Twitter in the midst of an argument.
I, for one, am guilty of this.
But it’s not just ERA indicators. We do this with hitting statistics too. First, it was Hard% from Baseball Info Solutions. A player’s not performing to expectations? Never fear, his Hard% is astronomical!
The latest fad in the fantasy community is to quote Statcast metrics from Baseball Savant, which will be the focus of this article. First, it’s important to understand where that data comes from:
Statcast is a combination of two different tracking systems — a Trackman Doppler radar and high definition Chyron Hego cameras. The radar, installed in each ballpark in an elevated position behind home plate … captures pitch speed, spin rate, pitch movement exit velocity, launch angle, batted ball distance, arm strength, and more. Separately, each ballpark also has a Chyron Hego camera system, where six stereoscopic cameras are installed in two banks of three cameras apiece down the foul line. The camera system tracks the movement of the people on the field, which allows for the measurement of player speed, distance, direction, and more on every play.
There’s a lot to unpack there, but this isn’t an article about the accuracy of the Doppler radar or camera system. Instead, I want to test a curated list of the most popular Statcast hitting metrics, generated from the radar and cameras, to determine which are most predictive of a hitter’s power.
To make those determinations, I’ll regress these metrics against HR/FB% and ISO. The former is more relevant from a fantasy baseball perspective because we want to know whether a hitter will continue hitting home runs. Initially, I considered regressing Statcast metrics against raw home run totals, but they don’t represent an accurate measure of hitters’ power because those totals vary based on a hitter’s number of plate appearances. Accordingly, I considered HR/PA%, but that sweeps in a lot of plate appearance results that are not influenced by Statcast power metrics, such as strikeouts and walks. I eventually landed on HR/FB%, as that metric only considers balls in play, specifically fly balls, and most home runs come on fly balls anyway.
ISO is more useful from a real baseball perspective than HR/FB%, as it includes doubles and triples. The other metric I considered was SLG, but ISO is better for measuring a player’s raw power than SLG because it excludes singles. As a result, I’ll regress Statcast metrics against ISO too.
For my analyses, I conducted linear and multiple regressions. By “regression,” I mean I found the coefficient of determination, or r^2, which shows the extent to which an independent variable (e.g., launch angle) explains the variation in the sample of a dependent variable (e.g., HR/FB%). The higher the r^2 (which will always be between 0 and 1), the greater the dependent variable predicts deviations in the independent variable.
For my sample, I selected all players with a minimum of 150 batted-ball events (BBEs) in each season from 2015-18. First, I regressed each Statcast metric year over year to see which were “sticky” and to what degree. Next, I regressed Statcast metrics against HR/FB% and ISO. Finally, I did a little more digging to provide you with some bonus analysis.
Let’s get started.
Definitions
To begin, I should provide some handy definitions from the Statcast glossary for the metrics I’ll be testing so that you have a frame of reference:
- Batted ball event (BBE): represents any batted ball that produces a result. This includes outs, hits and errors. Any fair ball is a batted ball event. So, too, are foul balls that result in an out or an error.
- Exit velocity (EV): Exit velocity measures the speed of the baseball as it comes off the bat, immediately after a batter makes contact. This is tracked for all batted ball events — outs, hits and errors.
- Launch angle (LA): represents the vertical angle at which the ball leaves a player’s bat after being struck. Average launch angle is calculated by dividing the sum of all launch angles by all batted ball events.
- Hard-hit rate (HH%): Statcast defines a “hard-hit ball” as one hit with an exit velocity of 95 mph or higher, and a player’s “hard-hit rate” is simply showing the percentage of batted balls that were hit at 95 mph or more.
- Barrel: To be barreled, a batted ball requires an exit velocity of at least 98 mph. At that speed, balls struck with a launch angle between 26 and 30 degrees always garner barreled classification. For every tick over 98 mph, the range of launch angles expands. The barrel classification is assigned to batted-ball events whose comparable hit types (in terms of exit velocity and launch angle) have led to a minimum .500 batting average and 1.500 slugging percentage.
Below I will regress average EV, average LA, and HH%. In addition, I will examine EV on fly balls and line drives (EV on FB/LD), barrels per batted-ball event (Brls/BBE%), and barrels per plate appearance (Brls/PA%).
Year-Over-Year Stickiness
How well does a hitter’s HH%, for instance, in one year translate to the next? To what degree can we look at a hitter’s EV on FB/LD and say it will look similar in the following season? The answer to these questions and more are below.
| Statcast Metric | 2015-18 r^2 |
| Average LA | 0.6434 |
| Average EV | 0.61519 |
| EV on FB/LD | 0.6674 |
| HH% | 0.6185 |
| Brls/BBE% | 0.6344 |
| Brls/PA% | 0.5735 |
There are a few conclusions we can draw from these numbers. First, they’re all fairly similar, only ranging between 0.5735 and 0.6674. We know that the year-to-year predictiveness is, accordingly, relatively strong for each metric. Second, EV on FB/LD in one year will explain more variation in EV on FB/LD in the next than any of the other Statcast metrics. It is the “stickiest” of them all.
Third, though Brls/BBE% and Brls/PA% seem similar, they’re actually quite different. Those differences are reflected in the fact that Brls/BBE% is more predictive of itself across seasons. Brls/BBE% only considers barrels on batted-ball events, while Brls/PA% accounts for barrels as a function of all plate appearances. As there are significantly more plate appearance results than just batted-ball events, it’s not surprising that Brls/PA% is subject to more fluctuation across seasons. If a hitter improves on his strikeout or walk rates, his Brls/PA% will change in the following year, while his Brls/BBE% will remain unaffected.
Fourth, though not reflected in the table above, each of those statistics stabilizes after about 50 balls in play. We know this from some great research by Russel Carleton, which you can read here and here. These Statcast metrics are all derivations of LA, EV, and Barrels. Russel Carleton found that these three stats stabilize after 50 balls in play (approximately 18 games played).
Now that we know how sticky each metric is, and how quickly they stabilize, we know the degree to which we can be confident employing them. It’s time to regress them against HR/FB% and ISO.
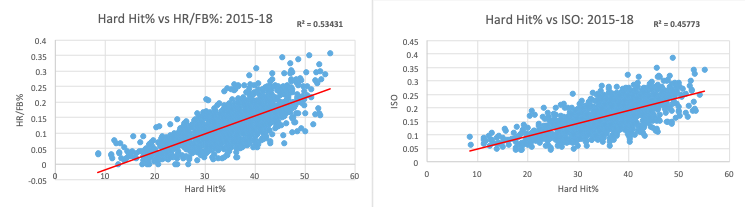
Hard%
First, I needed a control variable. One by which we could compare the results of our regressions to determine the relative predictive value of Statcast power metrics. I settled on Hard%, which is reported on Fangraphs player pages and collected by Baseball Info Solutions. According to Fangraphs:
Since 2010, the video scouts recorded the amount of time the ball was in the air, the landing spot, and the type of batted ball (fly ball, ground ball, liner, etc) and the BIS algorithm determines if the ball was soft, medium, or hard hit. Unfortunately, the exact algorithm (the exact cut points/methodology) are proprietary to BIS and we can’t share exactly what constitutes hard contact, but the calculation is made based on hang time, location, and general trajectory.
For years, Hard% has been quoted to determine whether a player will maintain high home run totals. So, for the same sample of hitters from 2015-18, I regressed Hard% against HR/FB% and ISO to test the veracity of that assumption.
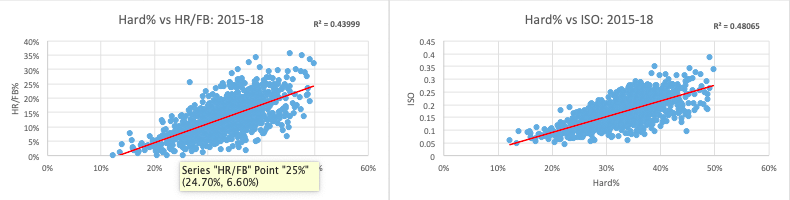
As you can see, Hard% does have a relatively strong relationship with both HR/FB% and ISO. Remember, we’re discerning the coefficient of determination, which is going to be lower than the Pearson correlation coefficient (r). Given the number of unknown variables that affect a player’s HR/FB% or ISO (e.g., ballpark, launch angle, quality of opposing pitcher, etc.), an r^2 of 0.44 or 0.48 is pretty strong. Put differently, 44% of the variance in HR/FB%, for example, is predictable from Hard%.
Average Launch Angle
Now that we have a control group, we can measure the extent to which Statcast metrics are predictive of our raw power metrics.
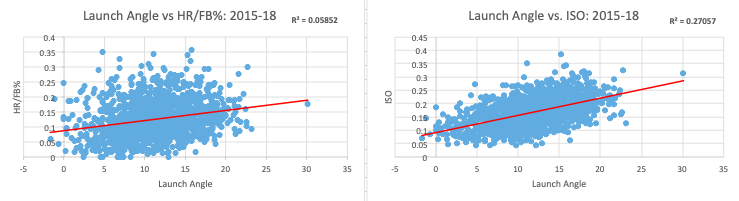
On the one hand, we see that, on its own, average LA is not predictive of HR/FB% given the r^2 of 0.05852. Intuitively, this makes sense. Whether a batter elevates more or less is irrelevant to whether he is able to muscle his fly balls out of the park. Taking the square root of 0.05852 yields a 0.2419 Pearson correlation coefficient, which means that average LA and HR/FB% are positively correlated to a degree. This makes sense too. Hitters who elevate more tend to be power hitters who have the ability to create home runs out of their fly balls. But elevating by itself does not cause more home runs on fly balls.
On the other hand, average LA is more predictive of ISO. ISO is a measure of total extra base hits over total at bats. A hitter that elevates more is more likely to have a greater percentage of his total at bats result in extra-base this.
Average Exit Velocity
Average EV is a different story. I expected it to be more predictive of HR/FB% and ISO as it is a measure of hitter’s raw power, as opposed to average LA, which is a measure of a hitter’s approach.
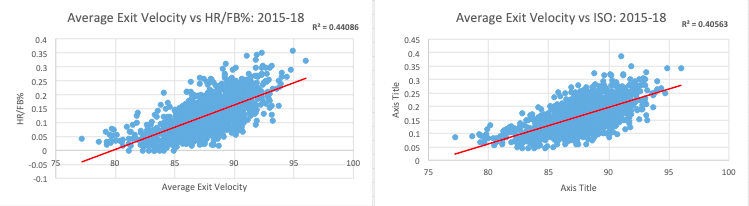
Unsurprisingly, my expectation is borne out in the regressions. With similar r^2 values to Hard%, average EV is about as useful for predicting raw power (as measured by HR/FB% and ISO) as Hard%. My guess is the reason it’s no better than Hard% is that, like Hard%, it’s measuring a hitter’s EV on ground balls as well as fly balls and line drives. This, in turn, is depressing the predictive value of average EV as a power metric.
Separately, it’s likely that average EV is likely more predictive of ISO than HR/FB% because its inclusion of EV on ground balls is actually useful for predicting doubles, as hard-hit ground balls can find grass in the outfield for doubles. Unlike HR/FB%, ISO includes doubles and triples.
Exit Velocity on Fly Balls and Line Drives
Next, I wanted to examine EV on FB/LD. From the outset, I expected EV on FB/LD to be one of the best, if not the best, at predicting HR/FB% and ISO. And why not? It’s simply a measure of how fast a batter’s fly balls and line drives leave his bat. The faster they travel, the more likely they are to become home runs. Thus, the metric should be predictive of at least HR/FB%, which is just a measure of how often fly balls become home runs.
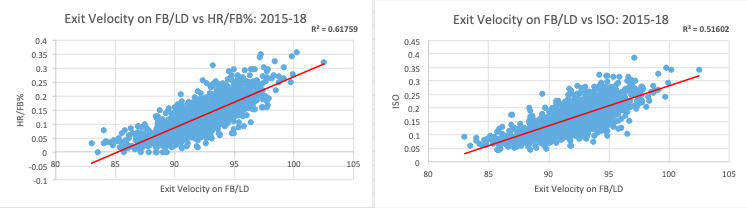
My expectation is partly reflected in the r^2 values above. For one thing, 0.6175 is a strong result. Particularly relative to our control metric (Hard%) and the other Statcast metrics we’ve tested thus far. Thus, you can comfortably look at a hitter’s EV on FB/LD to see whether his HR/FB% will regress.
Still, the same cannot be said as reliably for ISO. The reason is likely that ISO’s denominator includes all at bats and therefore sweeps in strikeouts and ground balls. Still, an r^2 of 0.5160 is a nice reminder that a hitter’s EV on FB/LD is important for both fantasy baseball and real-life baseball. Andrew Perpetua said it best two years ago: Exit velocity trumps launch angle.
Hard-Hit Rate
I’ve seen a lot of discussion around HH% and its value as a tool for estimating a hitter’s power potential. I was skeptical because HH%, like average EV, loops in all batted-ball types, including ground balls.
As you can see, with an r^2 of 0.5343, HH% is more predictive of HR/FB% than Hard%, average LA, and average EV but not as predictive of HR/FB% as EV on FB/LD. It’s even less predictive of ISO than Hard%.
I’ve heard the claim that HH% is useful because if a hitter were to make a swing change and elevate more, we would want to know what happened to those ground balls that are now becoming fly balls and line drives, and HH% captures the EV on those ground balls. My retort to that would be we should just look at EV on FB/LD, because it is a better representation of what would happen were those ground balls to turn into fly balls or line drives. This is reflected in the regressions.
That said, I’ve also heard the claim that HH% correlates strongly to xwOBA and xwOBAcon and may therefore be a better measure of a hitter’s true talent from a real baseball perspective. But that claim is beyond the scope of this article.
Brls/BBE% & Brls/PA%
I decided to treat Brls/BBE% and Brls/PA% in tandem as they are similar measurements with slightly different denominators. The former just considers barrels on balls in play, while the latter considers them as a function of all plate appearances. Which is the better measure of raw power?
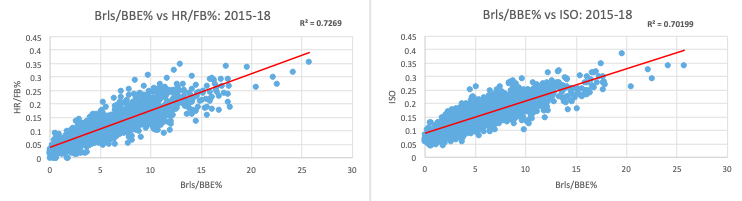
Beginning with Brls/BBE%, we see the r^2 to both HR/FB% and ISO is very high. It’s higher than any result we’ve had yet. As you’ll see in a minute, it is our best single metric to predict how well a hitter can muscle his fly balls out of the park, or whether his HR/FB% will regress.
The reason it’s better than EV on FB/LD is because it only captures those balls in play that are hit so hard as to be extremely likely to become home runs, whereas EV on FB/LD is a measure of average power and therefore can be skewed by outlier poorly or powerfully hit FB/LD.
Thus, as the regression tells us, the more a hitter can produce balls in play at the perfect LA and EV combinations (i.e., the more barrels he produces), the more likely he is to blast home runs. And the LA band considered by Brls/BBE% is narrowly tailored to the best power launch angles, so it’s not sweeping in all fly balls and line drives like EV on FB/LD. I hate admitting when I’m wrong, but Brls/BBE% is more predictive of both HR/FB% and ISO than EV on FB/LD.
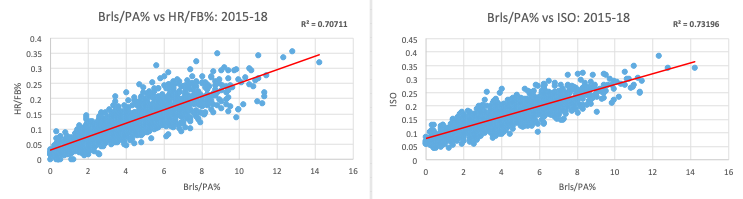
The same goes for Brls/PA%. It’s slightly less predictive of HR/FB% because, unlike Brls/BBE%, it considers more than just balls in play, and HR/FB% is just a measure of power on fly balls (a type of ball in play). And it’s more predictive of ISO because, unlike Brls/BBE%, it considers strikeouts, and ISO does too.
In sum, we have the following r^2 values:
| Statcast Metric | HR/FB% | ISO |
| Hard% | 0.4400 | 0.4807 |
| Average LA | 0.0585 | 0.2706 |
| Average EV | 0.4408 | 0.4056 |
| EV on FB/LD | 0.6176 | 0.5160 |
| HH% | 0.5343 | 0.4577 |
| Brls/BBE% | 0.7269 | 0.70199 |
| Brls/PA% | 0.7071 | 0.7319 |
After reaching the 50 ball in play stabilization points, your best bet is to look at Brls/BBE% to see if a hitter’s HR/FB% is sustainable, and Brls/PA% for ISO. Remember, HR/FB% and ISO are the best outputs we have to measure a hitter’s power production because they eliminate much of the noise (e.g., walks, foul outs, HBPs; strikeouts are also eliminated from HR/FB%) of other power metrics (e.g., HR/XBH totals or HR/PA%). Thus, Brls/BBE% and Brls/PA% are the best raw power inputs available.
Multiple Regressions
With that all said, I wanted to check my work with multiple regressions. In other words, testing two or more independent variables (e.g., average LA and average EV) against one dependent variable (e.g., HR/FB%). Perhaps two Statcast metrics together were more predictive of HR/FB% and ISO than they were individually.
To begin, I examined all six Statcast metrics together to see their combined predictive effect for HR/FB% and ISO. That yielded an r^2 of 0.7615 with HR/FB% and 0.7634 with ISO. In other words, when combined, all six Statcast metrics predicted about 76% of the variance in the HR/FB% and ISO samples.
Given that Brls/BBE% and Brls/PA% predicted about 73% of the variance in HR/FB% and ISO samples, no other Statcast metric added much predictive value on its own. For example, adding average launch angle to these two metrics pushed the r^2 with HR/FB% and ISO up to 0.7510 and 0.7578, respectively. But that’s really not much better. No other combination of two Statcast metrics moved the needle even that high.
Therefore, Brls/BBE% and Brls/PA% are powerful metrics. They’re pretty sticky year-to-year, too. Looking across the rest of the Statcast leaderboards actually may not tell you anything you wouldn’t get from them, and may be misleading. Knowing that we pretty much just need to look at Brls/BBE% to predict HR/FB%, let’s put what we’ve learned in practice.
A few hitters we can identify who are due for HR/FB% improvement include: Adalberto Mondesi (9.1 HR/FB%, 17.3 Brls/BBE%), Avisail Garcia (11.8 HR/FB%, 16.7 Brls/BBE%), and Freddie Freeman (5.6 HR/FB%, 15.1 Brls/BB%). Some of the surprising HR/FB% leaders that I believe have earned their elevated HR/FB rates include: Mitch Moreland (27.8 HR/FB%, 20.9 Brls/BBE%), Luke Voit (26.7 HR/FB%, 20.9 Brls/BBE%), and Yoan Moncada (22.7 HR/FB%, 19.2 Brls/BBE%).
Swing Changes and Statcast
Finally, I wanted to examine which Statcast metric would be most useful for portending a power breakout based on a swing change. As we’ve just learned, success in the power department depends on better Brls/BBE% and Brls/PA% marks. Is there a way we could identify hitters that could improve on those and, in turn, improve on HR/FB% and ISO? If so, which hitters would benefit most from such a change?
We know that barrels are comprised of LA and EV. Only the former is really within a hitter’s control. Sure, he could put on more muscle and start hitting the ball harder. But we can’t really predict that. Instead, if we were to assume he’s going to elevate more, which is more a matter of conscious choice, then will he be successful after doing so? Perhaps a player made a statement to the media that he intends to elevate the ball. Would that actually benefit him? To answer all of these questions, I determined which non-LA Statcast metrics were most predictive of Brls/BBE% and Brls/PA% by, you guessed it, running linear and multiple regressions.
| Statcast Metric | Brls/BBE% | Brls/PA% |
| Average EV | 0.5374 | 0.5737 |
| EV on FB/LD | 0.6936 | 0.7024 |
| HH% | 0.6178 | 0.6447 |
| HH% + EV on FB/LD | 0.6999 | 0.71226 |
| EV on FB/LD + Average EV | 0.6186 | 0.6459 |
Rather than make each graph and considerably extend the length of this article, I decided to just put the r^2 values in a comprehensive table. Accordingly, you can see that EV on FB/LD is the most predictive of Brls/BBE% and Brls/PA%. So much so that adding in HH% or average EV lends no value to the sample and, in some cases, actually makes it less predictive. This result makes me giddy too because EV on FB/LD is not only predictive, but it’s also the stickiest of our Statcast metrics. It’s a great way to find your swing-change breakouts.
This is most valuable in the hypothetical scenario in which a hitter maintained excellent EV on FB/LD, but hasn’t hit a lot of fly balls and line drives, leaving him room to improve. But instead, everything’s best illustrated by an example.
Take Josh Bell, for instance. I was out on him going into the season, in part, because he wasn’t elevating. Last year, his average LA was 9 degrees, and he hit only 34.6% fly balls and 41.7% ground balls, which limited his Brls/BBE% to 7% (151st overall of those with 150 BBEs) and his Brls/PA% to 4.8% (150th overall). This was despite his much better EV on FB/LD of 94.2 mph (84th overall). This year, it appears he’s making a concerted effort to elevate, and given his latent power, it could support a breakout. Now, he’s hitting 37.5% fly balls and 41.7% ground balls to an average LA of 12 degrees. Don’t be surprised if his barrel rates remain elevated at 14.6 Brls/BBE% and 10.3 Brls/PA% (and, in turn, so could his 16.7 HR/FB% and .276 ISO).
Thus, if we know who’s going to elevate more, we can easily separate the wheat from the chaff. It’s not by looking at their HH% or average EV; instead, just take a quick glance at their EV on FB/LD.
Conclusion
Hopefully, people will start using Statcast metrics appropriately. If you see a fantasy baseball analyst quote a hitter’s Hard%, HH%, or average EV to suggest a power breakout, check his barrel rates. You know they’re predictive of HR/FB% and ISO, and that they’re sticky. Then, check his EV on FB/LD. You know that could portend more in the power department if he starts elevating, and that it’ll stick around too. Let’s not just assume metrics like Hard%, HH%, or average EV are best because we have access to them.
This is just the beginning. In Part II, I’ll check the relative value of Statcast metrics against BABIP. Stay tuned for more.
Featured Image by Justin Paradis (@freshmeatcomm on Twitter)
I have no idea why there are no comments on this.
This is a gold standard article that should be pinned to every fantasy fanatic’s forehead. This is the type of work I absolutely LOVE digging into, great work mate. Also a Yankees fan from the tristate
Thanks, Dan! Really appreciate it. Not to worry though. Tom Tango and Chris Towers read this which garnered some attention for my Twitter account (@drichardsPL).
In any event, glad to hear from a fellow Yankees fan!
Has part two been posted yet? And do you have a similar article for predicting pitcher performance?
Not yet but soon! I got distracted with Jose Ramirez’s terrible start.
Just search my name and you’ll see all my articles. I did something similar with ERA indicators recently
This is pure gold