


(Photo by Frank Jansky/Icon Sportswire)
The Cleveland Indians are on pace to win about 94 games currently. The projections think it won’t be quite that good, but it’s not too far off. However, it has felt like they haven’t played all that well so far, despite a completely acceptable 7-5 start. The reason for the disappointment surrounding Cleveland is an offense averaging just 2.8 runs per game and hitting .158 on the season. You can’t hit that poorly solely from bad luck, but to hit that poorly, you also have to suffer some bad luck. I want to focus on the considerable amount of bad luck that the Indians have faced.
Luck or bad-luck reactions tend to immediately gravitate toward BABIP. Batting average on balls in play is not an all-telling statistic, but if someone or some team is suffering a form of luck, BABIP can give you a good initial idea. The Indians have a BABIP of .174, the worst in baseball. The Royals are 29th with a BABIP of .263. Let’s have some small sample size fun. I plotted each team’s BABIP (x-axis) vs their batting average (y-axis) for every season beginning with 2013:
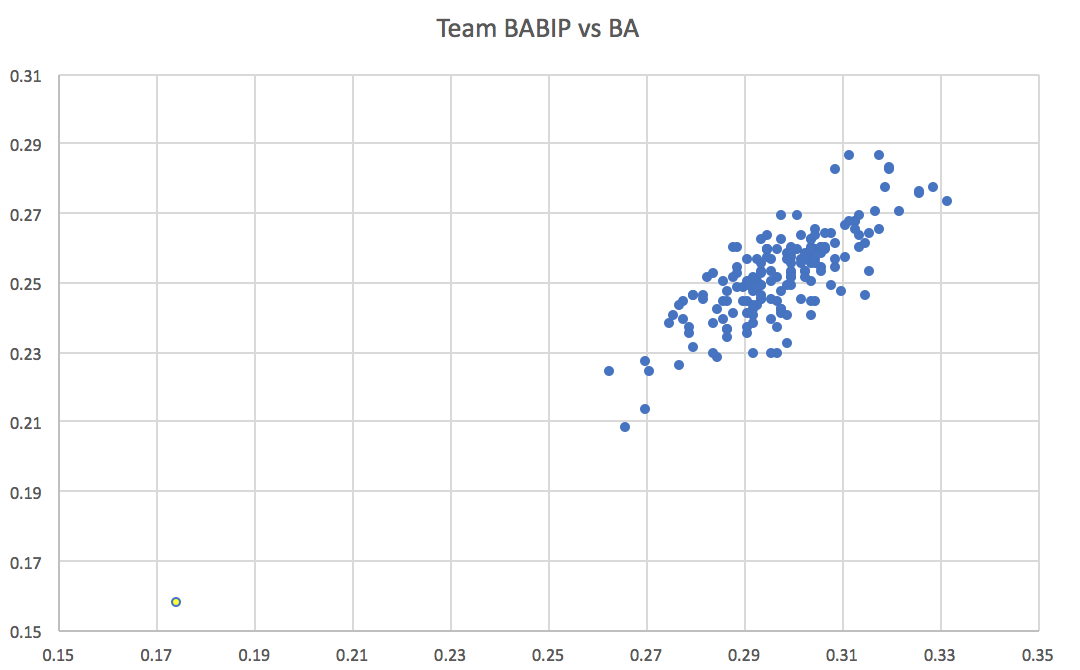
It’s pretty clear which one is Cleveland. Due to the laws of regression, obviously the Indians will significantly positively regress towards the mean. Keep in mind that there are 29 other teams from 2018 that are on this plot, though. This ridiculous extremity can easily be set aside for small sample size, but how extreme are they in small sample recent history?
I don’t have the technological power to filter for every two week time period, but I went back to that 2013 year again and found the BABIP and batting average for every one of those same teams through the first two weeks of the season and plotted it:
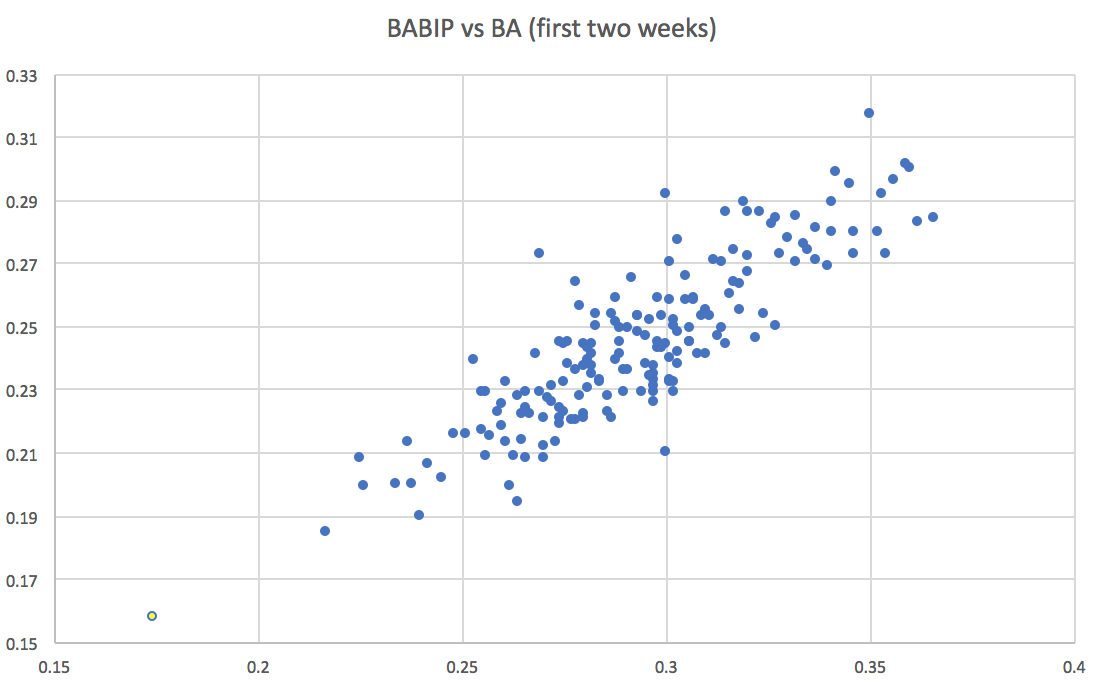
Cleveland is again in that bottom corner. No team in the last six seasons has gotten off to as poor of a start as the Indians this year, and I imagine it stretches even farther than that. The bad luck on balls in play is incredibly extreme, but you would expect an offense that has hit this poorly to have bad peripherals as well. Cleveland does not at all.
The Indians 10.1% walk rate is tied for 9th, their 22.8% strikeout rate ranks 12th., and they are even hitting the ball out of the park consistently, with their 12 long balls tying for 10th in the majors. Statcast offers an expected weighted on-base average (xwOBA) that creates a wOBA based on the exit velocity and launch angle of balls in play. Cleveland’s actual wOBA thus far is 32 points lower than second to last at .238. Their expected wOBA? .343, which is 12th in the league. The data suggests their weighted on-base average should be more than 100 points higher than it actually is. The peripheral numbers for Cleveland are not just better than the actual ones, and they are not just ok – they have actually been above average. A team batting .158 has produced advanced numbers that suggest it has hit like a top 12 team. How is this possible?
I mean, just look at some of these field outs:
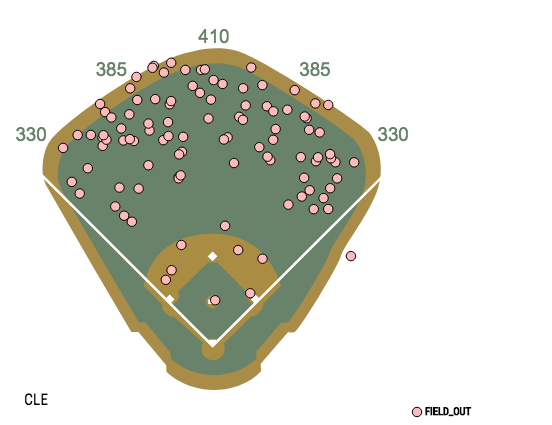
By my count, Cleveland flew out to the warning track 15 times in 11 games. 15! It happens, and I don’t exactly have fly outs to the warning track data, but that sure feels like a lot.
They haven’t exactly played in hitter friendly parks. Their home stadium, Kaufman Stadium in Kansas City, and Safeco Field in Seattle, ranked 17th, 22nd and 23rd, respectively, in park factor runs scored last year. They have also been exposed to some pretty extreme cold weather for baseball, which is not exactly helping the flight of the ball. But they have also had things like this:
[gfycat data_id=”PerkyWarpedAtlanticsharpnosepuffer”]
And this:
[gfycat data_id=”BadFlashyLice”]
That is just a couple. Cleveland has hit eight balls in play this year that have produced expected wOBA’s north 1.500 and did not even land for a hit. Both GIFs come from the table below. Bradley Zimmer hit a ball that expects a 2.000 wOBA, the highest possible figure, and that didn’t even leave the park:
| Player | EV | LA | xwOBA | Result |
|---|---|---|---|---|
| Bradley Zimmer | 109.4 | 35.4 | 2.000 | Fly out to center |
| Yonder Alonso | 105.9 | 27.5 | 1.914 | Fly out to center |
| Francisco Lindor | 106.4 | 35.4 | 1.905 | Fly out to center |
| Yonder Alonso | 103.8 | 27.6 | 1.897 | Fly out to center |
| Yonder Alonso | 101.8 | 27.2 | 1.816 | Fly out to left |
| Jason Kipnis | 100.8 | 28.4 | 1.658 | Fly out to center |
| Francisco Lindor | 101.6 | 25.0 | 1.588 | Fly out to right |
How does a team hit .158 over two weeks? The most extreme bad luck of bad luck. The Indians have done a lot of things right on the offensive side of the ball. They have hit the ball hard, drawn their walks, and limited swing and misses. Cleveland’s pitching is certainly holding up their side of the bargain, as they rank 7th in the league in ERA. Cleveland’s hitting has not held up their side of the bargain, but evidence says that should change soon.
Why This Is Believable
These numbers come from before yesterday’s game against the Detroit Tigers, a game in which the Indians put up five runs on ten hits. The batted .357 on balls in play! If you need anything to tell you what was happening through the first two weeks of the season was incredibly flukey, well, yesterday should go a long way towards convincing you.
What are your thoughts on Encarnacion? I took him pretty early (4th round) He’s been one the best offensive producers for a long time so I couldn’t pass him up. Thanks!
He’s in the same boat as the rest of the team. .125 BABIP, xwOBA is 50 points higher than actual wOBA. But also, his hard hit rate is down 12% and his line drive rate has plummeted to 11%. The 8.3% BB% would be his lowest since 2011 and a sharp decline from recent years, which has gone hand in hand with a K% that has rocketed to almost 30%. His contact rate is falling for the fourth year in a row and the production is doing the same. All those numbers will trend in a more positive direction with more time, and the home runs and RBIs will no doubt be there in a protected Cleveland lineup, but I think Encarnacion is almost certainly on a steady decline.
Reading this as Lindor homers and Kipnis doubles. Great article.
Timely article as JD mentioned above, Lindor blasted an oppo taco to left! According to your EV chart above, Alonso is due for some homers. I just traded for him at a discount so I’m feeling better about that!
I think it boils down to one definitive metric….. Chief Wahoo is not happy to be leaving! Loved the article!
Looks like I’ll be betting CLE -1.5 tomorrow (Clevinger on the mound vs Stroman)
You jinxed Fulmer’s start! :-P
You cited that Kauffman was the Indian’s home field, where it’s actually progressive field. KC played the Indians in CLE. But, the temperature’s during the opening day series for the Indians were in the 30s, which definitely did not help the ball carry at all. I believe only two or three balls left the yard, where a ton made it to the track.
Now that the weather warmed up, the ball is flying a bit better and hitting the wall, finding a gap, or flying out.