


(Photo by Nick Wosika/Icon Sportswire)
If you look at Win Probability Added for relief pitchers this year, you see two clear outliers from the same team. One I’m sure you’re familiar with, the other maybe not so much. The familiar one, Josh Hader, has been one of the best pitchers in baseball this season. His outrageous 56.9% K-rate is downright amazing. His FIP and tERA (from Fangraphs) are essentially identical meaning Hader’s pitching is (for now) legitimately real. His ERA is about 30 points higher than the previously mentioned metrics, but even with that jump, he’s is still elite. But Hader isn’t who I want to talk about right now.
The Brewers have the best bullpen in baseball according to WAR (3.3), ahead of the much-touted New York Yankees pen (3.0). The largely unknown factor is the contributions of one Jeremy Jeffress, who has had a mostly ignorable career. Through nearly 300 innings in his eclectic 9-year career, Jeffress has produced a 2.7 WAR, a 3.08 ERA (3.65 FIP), a 2-1 K/BB rate, and an 11.6 HR/FB rate. For a relief pitcher, that’s not bad, but not great either. In 2018, he’s been really, really good.
One thing Jeffress has been doing is slowly incorporating a split-finger fastball to compliment his four-seamer. Its usage has gone from 2.9% in 2016 to 18.7% in 2018. He’s done this at the expense of his sinker while balancing out his fourseam and (knuckle) curveball. For most of his career, Jeffress has used the sinker much more than any other pitch in his arsenal. It’s still his most-used pitch but to a much lesser extent.
The sinker wasn’t good for Jeffress in 2017 as it was called a ball almost twice as much as a strike. Posting a .302 BAA, an ISO of .233 and negative pitch value (vSI), it was used almost exclusively when the count was even or in the batter’s favor; more so with right-handed hitting. You can figure out that when the batter was ahead, and Jeffress threw a sinker more often for a ball, he got himself into trouble; 1.007 OPS-level trouble.
But it wasn’t his worst pitch; that honor belonged to his four-seam fastball.
The spin rate on his fourseam fastball has been somewhat telling; it went from an average of 2211 RPM in 2016 to 2153 RPM last season. Both figures are right at the edge of league average; last season he was literally on the cusp of below average. It might not seem like a significate difference at face-value, but what you have to know about the spin rate for fastballs is the higher the rate, the more it appears to ‘rise’ and can throw off hitters. The less spin makes the pitch break a lot more. Somewhere in between (league average) dictates less movement and unless you can spot your pitches perfectly, you’re going to widen the eyes of a hitter ready to explode on a basic fastball. Essentially, you want to have either a lot of spin or very little depending on what you want to do with the pitch. Here is a perfect example of an issue relating to spin rate from MLB.com.
Jeffress fourseam fastball BAA was a staggering .417 in 2017. There is something to be said about the placement of that fastball as well. Look at the graphic below and you’ll see the difference in movement from last season.
CHART 1
Again, his spin rate was below average and he was delivering the ball basically right over the plate. This season there is much more cut to it as well as an increase in average spin rate (2239), producing an impressive .111 BAA. Have a look at his fourseam heatmap from 2017 (Chart 2) and his current fourseam heatmap (chart 3), which shows better location and control.
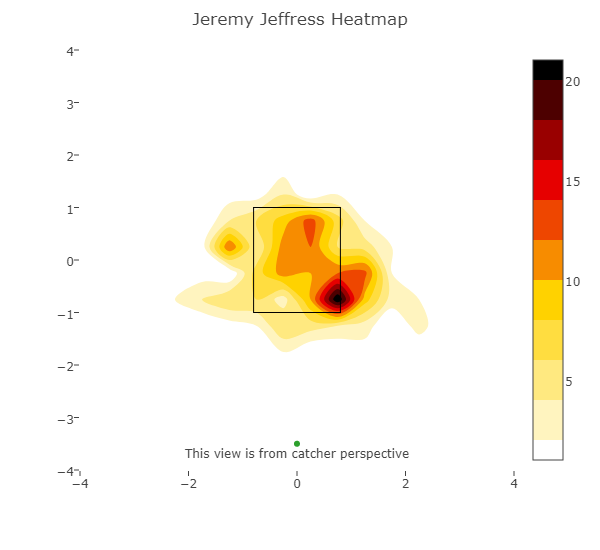
CHART 2
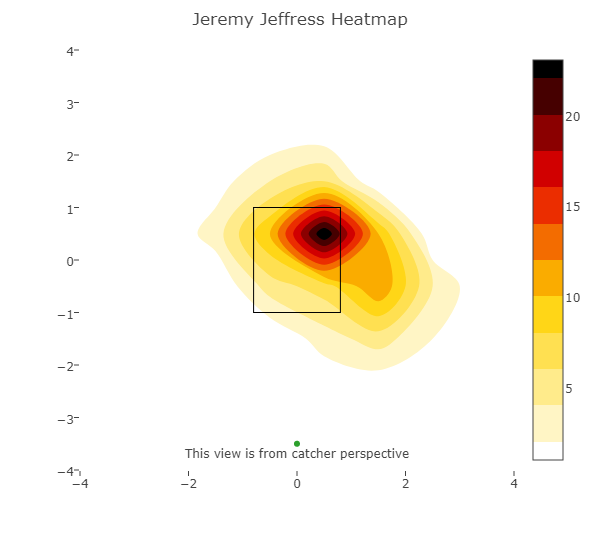
CHART 3
However, the thing that stands out the most is Jeffress’s incredibly low 2018 BABIP; a clear indication that regression is on the horizon. Yet, Chart 4 shows an interesting trend that allows us to figure out how Jeffress is able to be such a statistical outlier in 2018. For his career, 60% of his balls in play contact are grounders; that figure holds true in 2018 as well. Do grounders lend themselves to low BABIP? Using pitch data from 2013-present, the average BABIP for ground balls is .244.
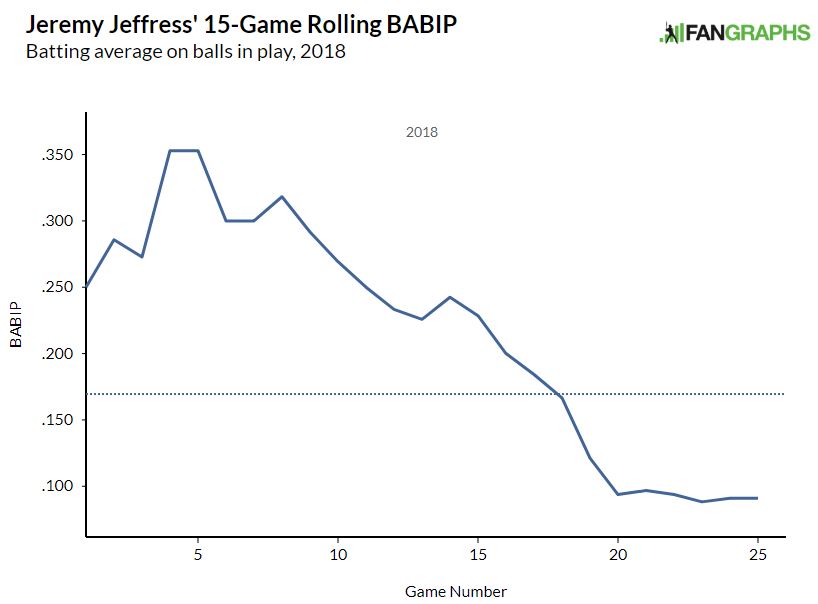
CHART 4
Through the first ten games, Jeffress was pretty erratic when it came to his BABIP though kept it close to league-average. But by game ten is when it falls off a cliff; from .310 down to .103. You certainly could chalk it up to nothing more than luck, especially since he’s a relief pitcher (fewer innings, smaller sample, more volatile). Regardless, that low BABIP is no way sustainable and there will be some regression for Jeffress, but how much is the question.
I need to point one other thing out; he’s missing bats a lot more this season. His Z-Swing% is up and his Z-Contact% is way down; nearly 10% less than his last two seasons and about 5% higher than league average. He’s also inducing more contact out of the zone; hitters are just 2/23 (0.87). That can also be a bit misleading as his xBA shows a .161 but that’s still really good, regardless. The development and inclusion of the split-finger fastball have been a major benefit for Jeffress. He’s using it mainly as his put-away pitch.
Jeffress is varying his pitches up more this year than he has in the past. Hitters are/were expecting to face a certain type of pitch from him and now he’s able to mix them up more. It appears that he has tightened up his fastballs and is now leaning more on his breaking (or off-speed, whatever you like) pitches to great results. That variety, and the results, are showing that Jeffress can be a huge asset to the Brewers’ bullpen, even if he regresses a fair amount.