


We all know catcher is a barren wasteland. If you didn’t draft Gary Sanchez (a healthy Gary Sanchez) or J.T. Realmuto, it’s easy to feel somewhat hopeless about your chances for production at the position. Some jumped at the middle tier (Wilson Ramos, Yasmani Grandal, Willson Contreras, Yadier Molina, etc.) but others punted the position as a whole, settling for guys like Welington Castillo, Willians Astudillo, or even Omar Narvaez. That last group of owners found some reason for excitement this past week with the power surge of Austin Barnes. Today, I’d like to take a deep dive into Barnes’ hot start and his past two seasons and attempt to assess his value moving forward in 2019.
A Red Hot 2017 and an Ice Cold 2018
It’s easy to see why many (including myself) were excited about Austin Barnes coming into 2018, as he posted an awesome line in 2017.
| PAs | BABIP | AVG | OBP | SLG | R+RBI | HRs | SBs | Hard-Hit% | |
| 2017 | 262 | .329 | .289 | .408 | .486 | 83 | 8 | 4 | 36.6 |
| 2018 | 238 | .287 | .205 | .329 | .290 | 46 | 4 | 4 | 30.6 |
Yes, I see the low plate appearances, but the triple slash is gorgeous. Since 2013, there have only been qualified 13 catcher seasons with a .289 average or above (four of them belonging to Buster Posey), zero with an OBP of .408 or above, and just four with a SLG of .486 or above. In short, Barnes put together a phenomenal season by catcher standards, although in a part-time role.
However, as you can see, Barnes regressed heavily in 2018. The entire triple slash cratered and it’s easy to think that his phenomenal 2017 was just a mirage. There are a few places I like to look when asking this question, primarily plate discipline data and xStats data.
What Did You Expect?
For those who don’t know, the wonderfully talented Andrew Perpetua had to discontinue xStats this year because he took a job with the New York Mets. We’re sad that the resource is gone, but overjoyed for him. However, we still have access to xStats data from prior to 2019, which is where we’re looking anyway.
xStats pegged Barnes for an xAVG and xOBP right in line with his actual numbers, but a 36-point deficit in slugging. This is somewhat concerning, but it still left him with a serviceable slugging percentage regardless. We see the same in 2018: Despite abysmal stat lines, his xStats are right in line with his performance. So his batted ball data was not out of line with his production, which leads me to believe it was a plate discipline issue.
A Master of Discipline, Perhaps Too Disciplined
As evidenced by his elite OBP, Barnes posted phenomenal plate discipline numbers in 2017, but to the surprise of most, that dominance continued into 2018.
| BB% | K% | O-Swing% | Contact% | SwStr% | Z-Swing% | |
| 2017 | 14.9 | 16.4 | 17.4 | 87.2 | 4.7 | 58.4% |
| 2018 | 13.0 | 28.2 | 20.5 | 83.5 | 5.8 | 52.0% |
For the uninitiated, here is my article from last year on plate discipline metrics and how to contextualize them. Following the summary of that piece, I’ve highlighted the three most important Fangraphs metrics, as well as Z-swing rate, which I’ll come back to in a second, to understand Barnes’ 75% increase in K-rate; the result is that it does not make sense on the surface. Let’s look further.
Now it’s time to look at Z-Swing, which tells us how often a player swung at pitches in the strike zone. Upon initial glance, you might think Barnes’ numbers might seem extremely low and you’d be right about that. In 2018, Barnes only swung at a little over half of pitches in the strike zone. Just how low was that?
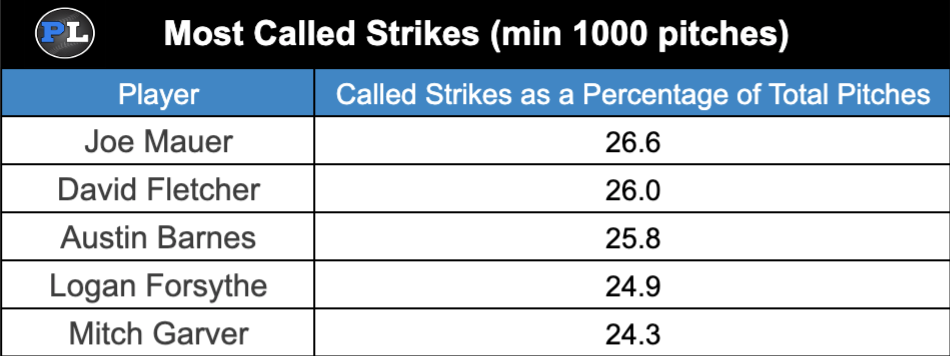
Barnes took the third most called strikes (as a percentage of total pitches) in all of baseball. While taking strikes isn’t inherently bad, it means fewer opportunities for Barnes to make contact and drive up his average. Combine that with the second-highest zone rate in baseball at 47.9% and it’s clear that pitchers knew Barnes wasn’t swinging and could easily not only get him down 0-1 (he ranked in the top 15% of hitters in percentage of 0-0 pitches taken for a called strike), but also ring him up on strike three.
So how bad was the strikeout problem?
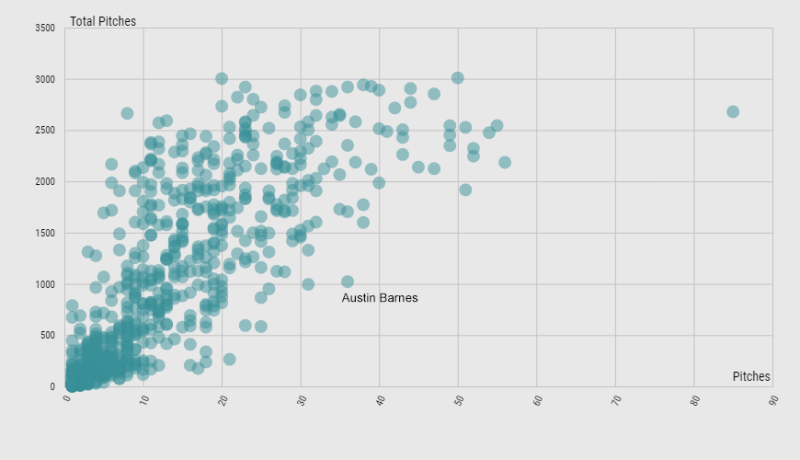
Chart from Baseball Savant; edited by Justin Paradis (@freshmeatcommr on Twitter)
Along the X-axis here, we have called third strikes and total pitches seen along the Y-axis. Don’t be fooled by the data point all the way out to the right (Yoan Moncada, 3.2%); Barnes’ 3.5% called strikeout rate was highest in baseball. To point out how extraordinarily high that is, only 20 players registered marks above 2.0% and Barnes and Moncada were the only ones above 2.7%. Given this, it’s not surprising that Barnes’ stats cratered in 2018 — his flaws were very apparent and pitchers began to take advantage.
2019 Outlook
So how does Barnes improve moving forward? It’s simple: Swing more, particularly at strikes on the edge. Last season, Barnes ranked third in baseball in called strikes on the edge of the strike zone. So far, he’s off to a great start with that. Take a look at the changes he made relevant to years past.
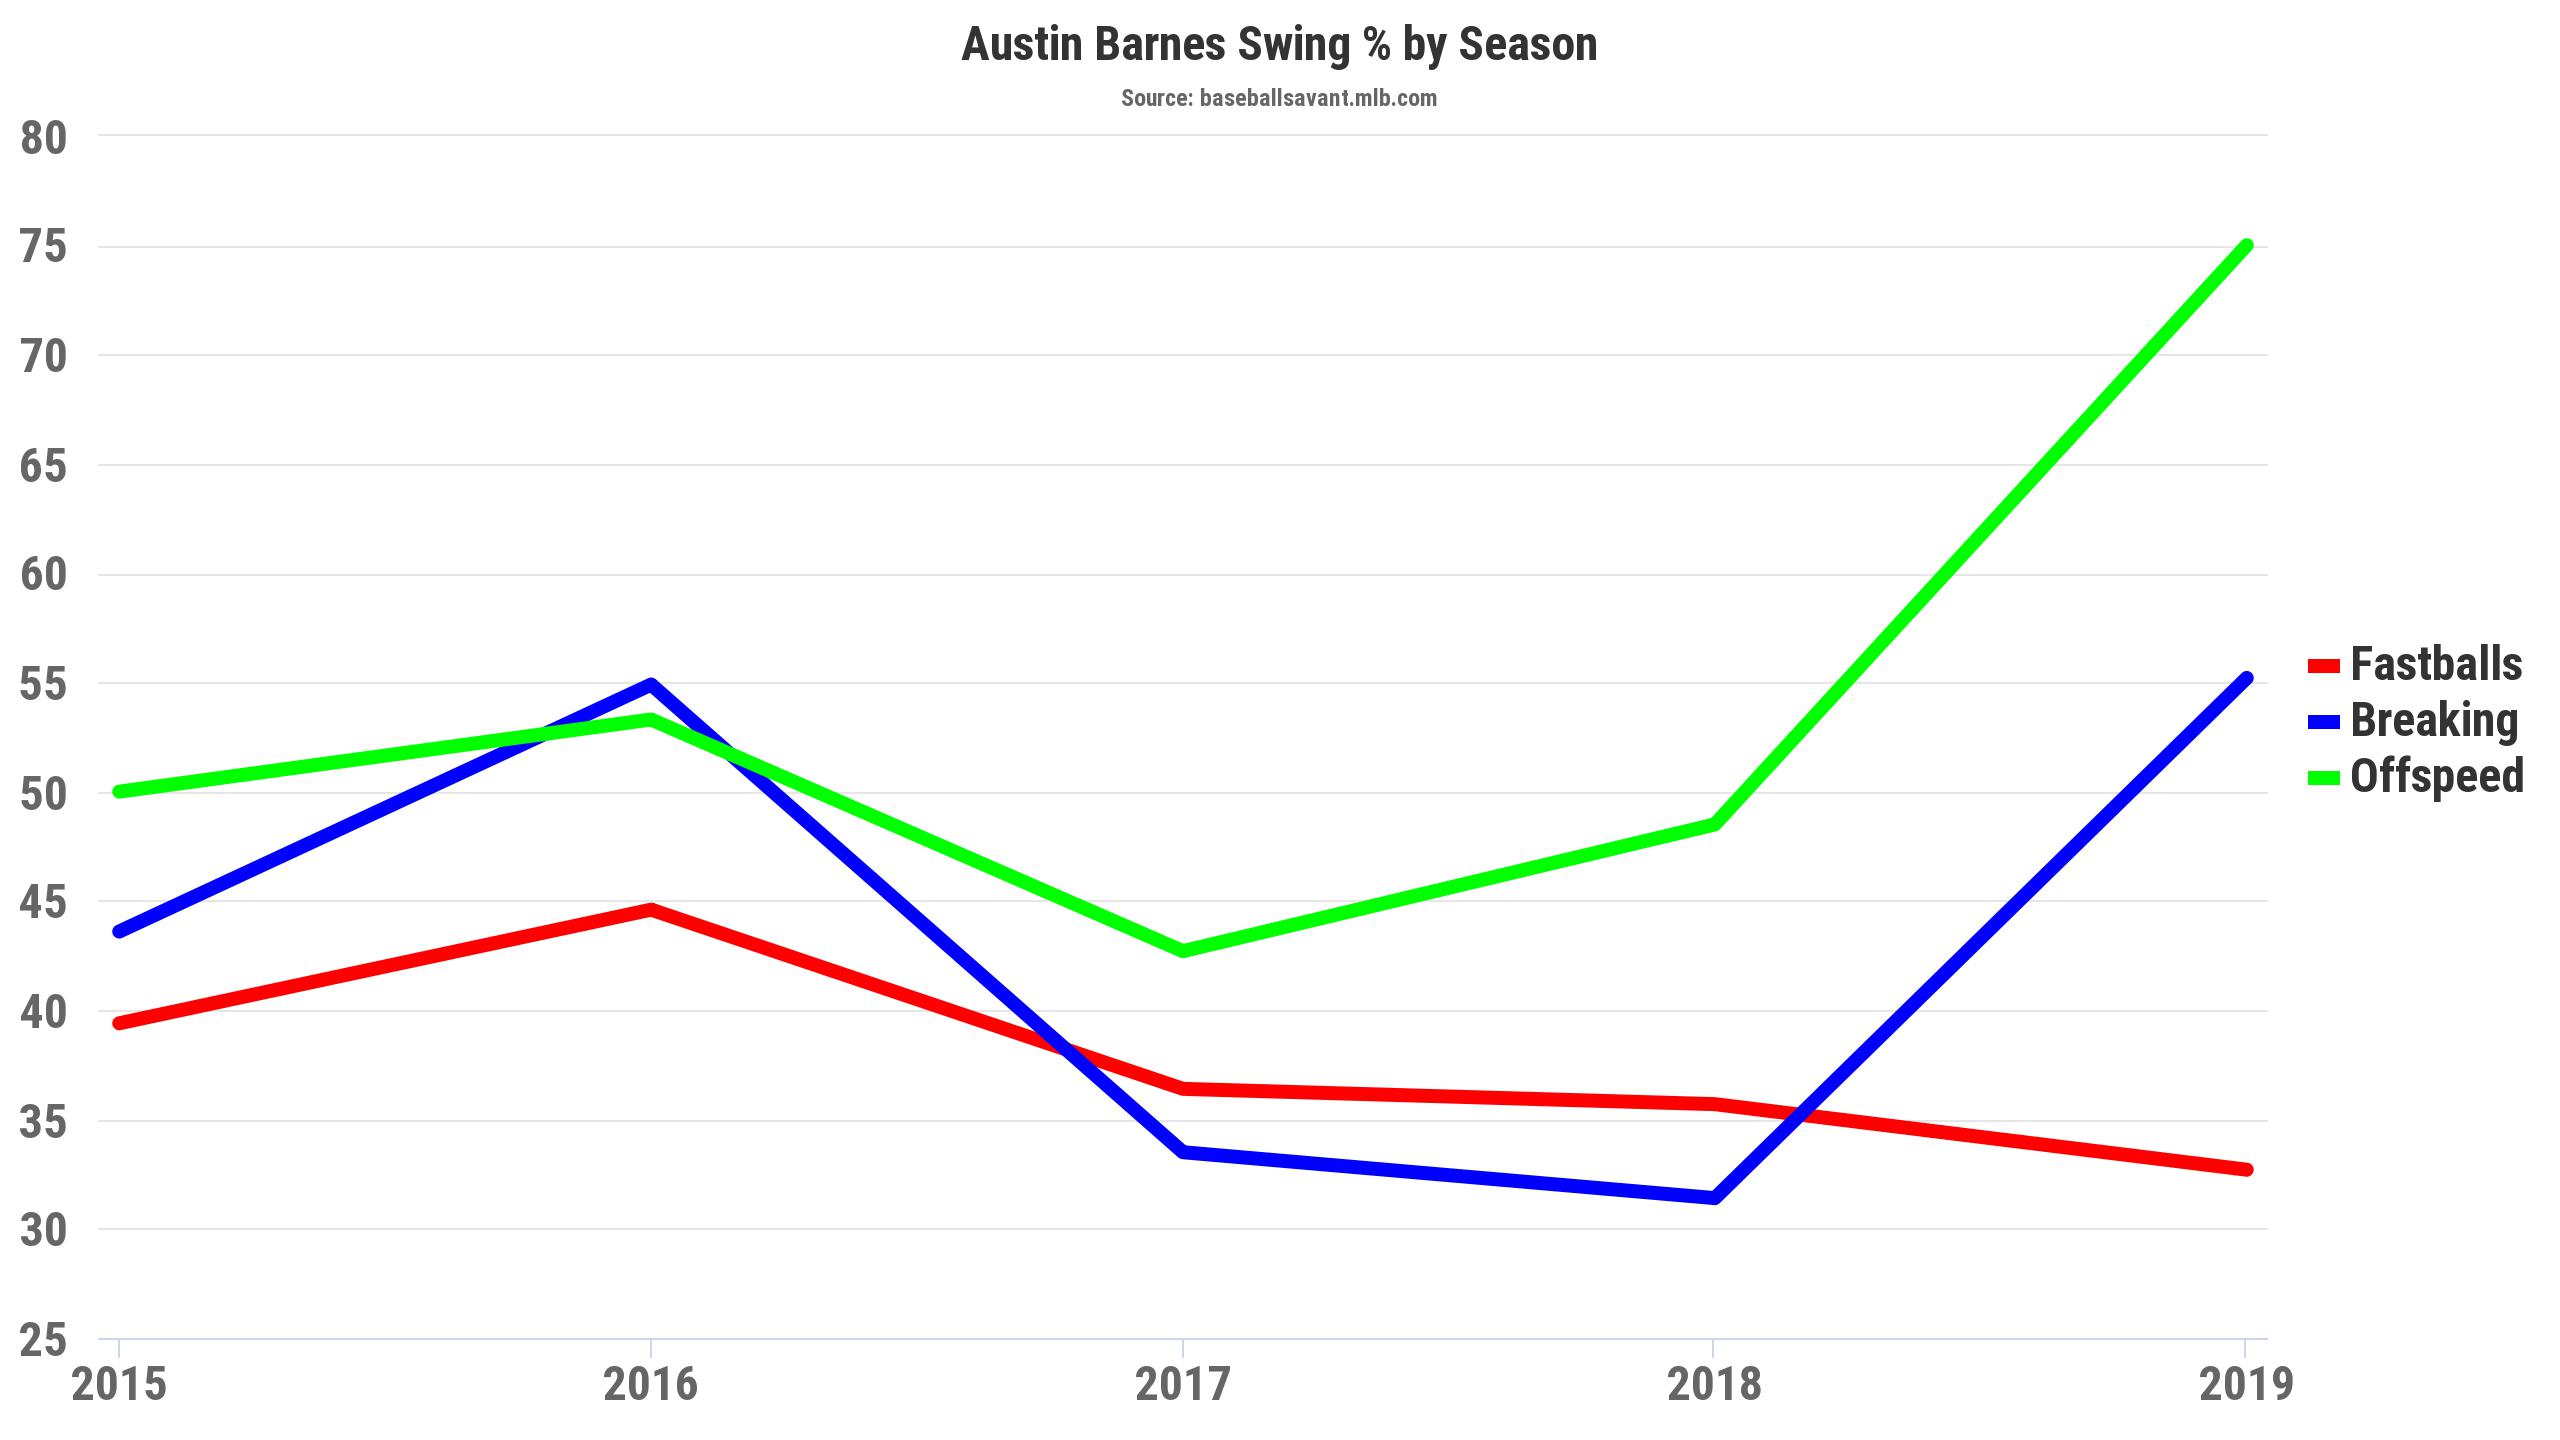
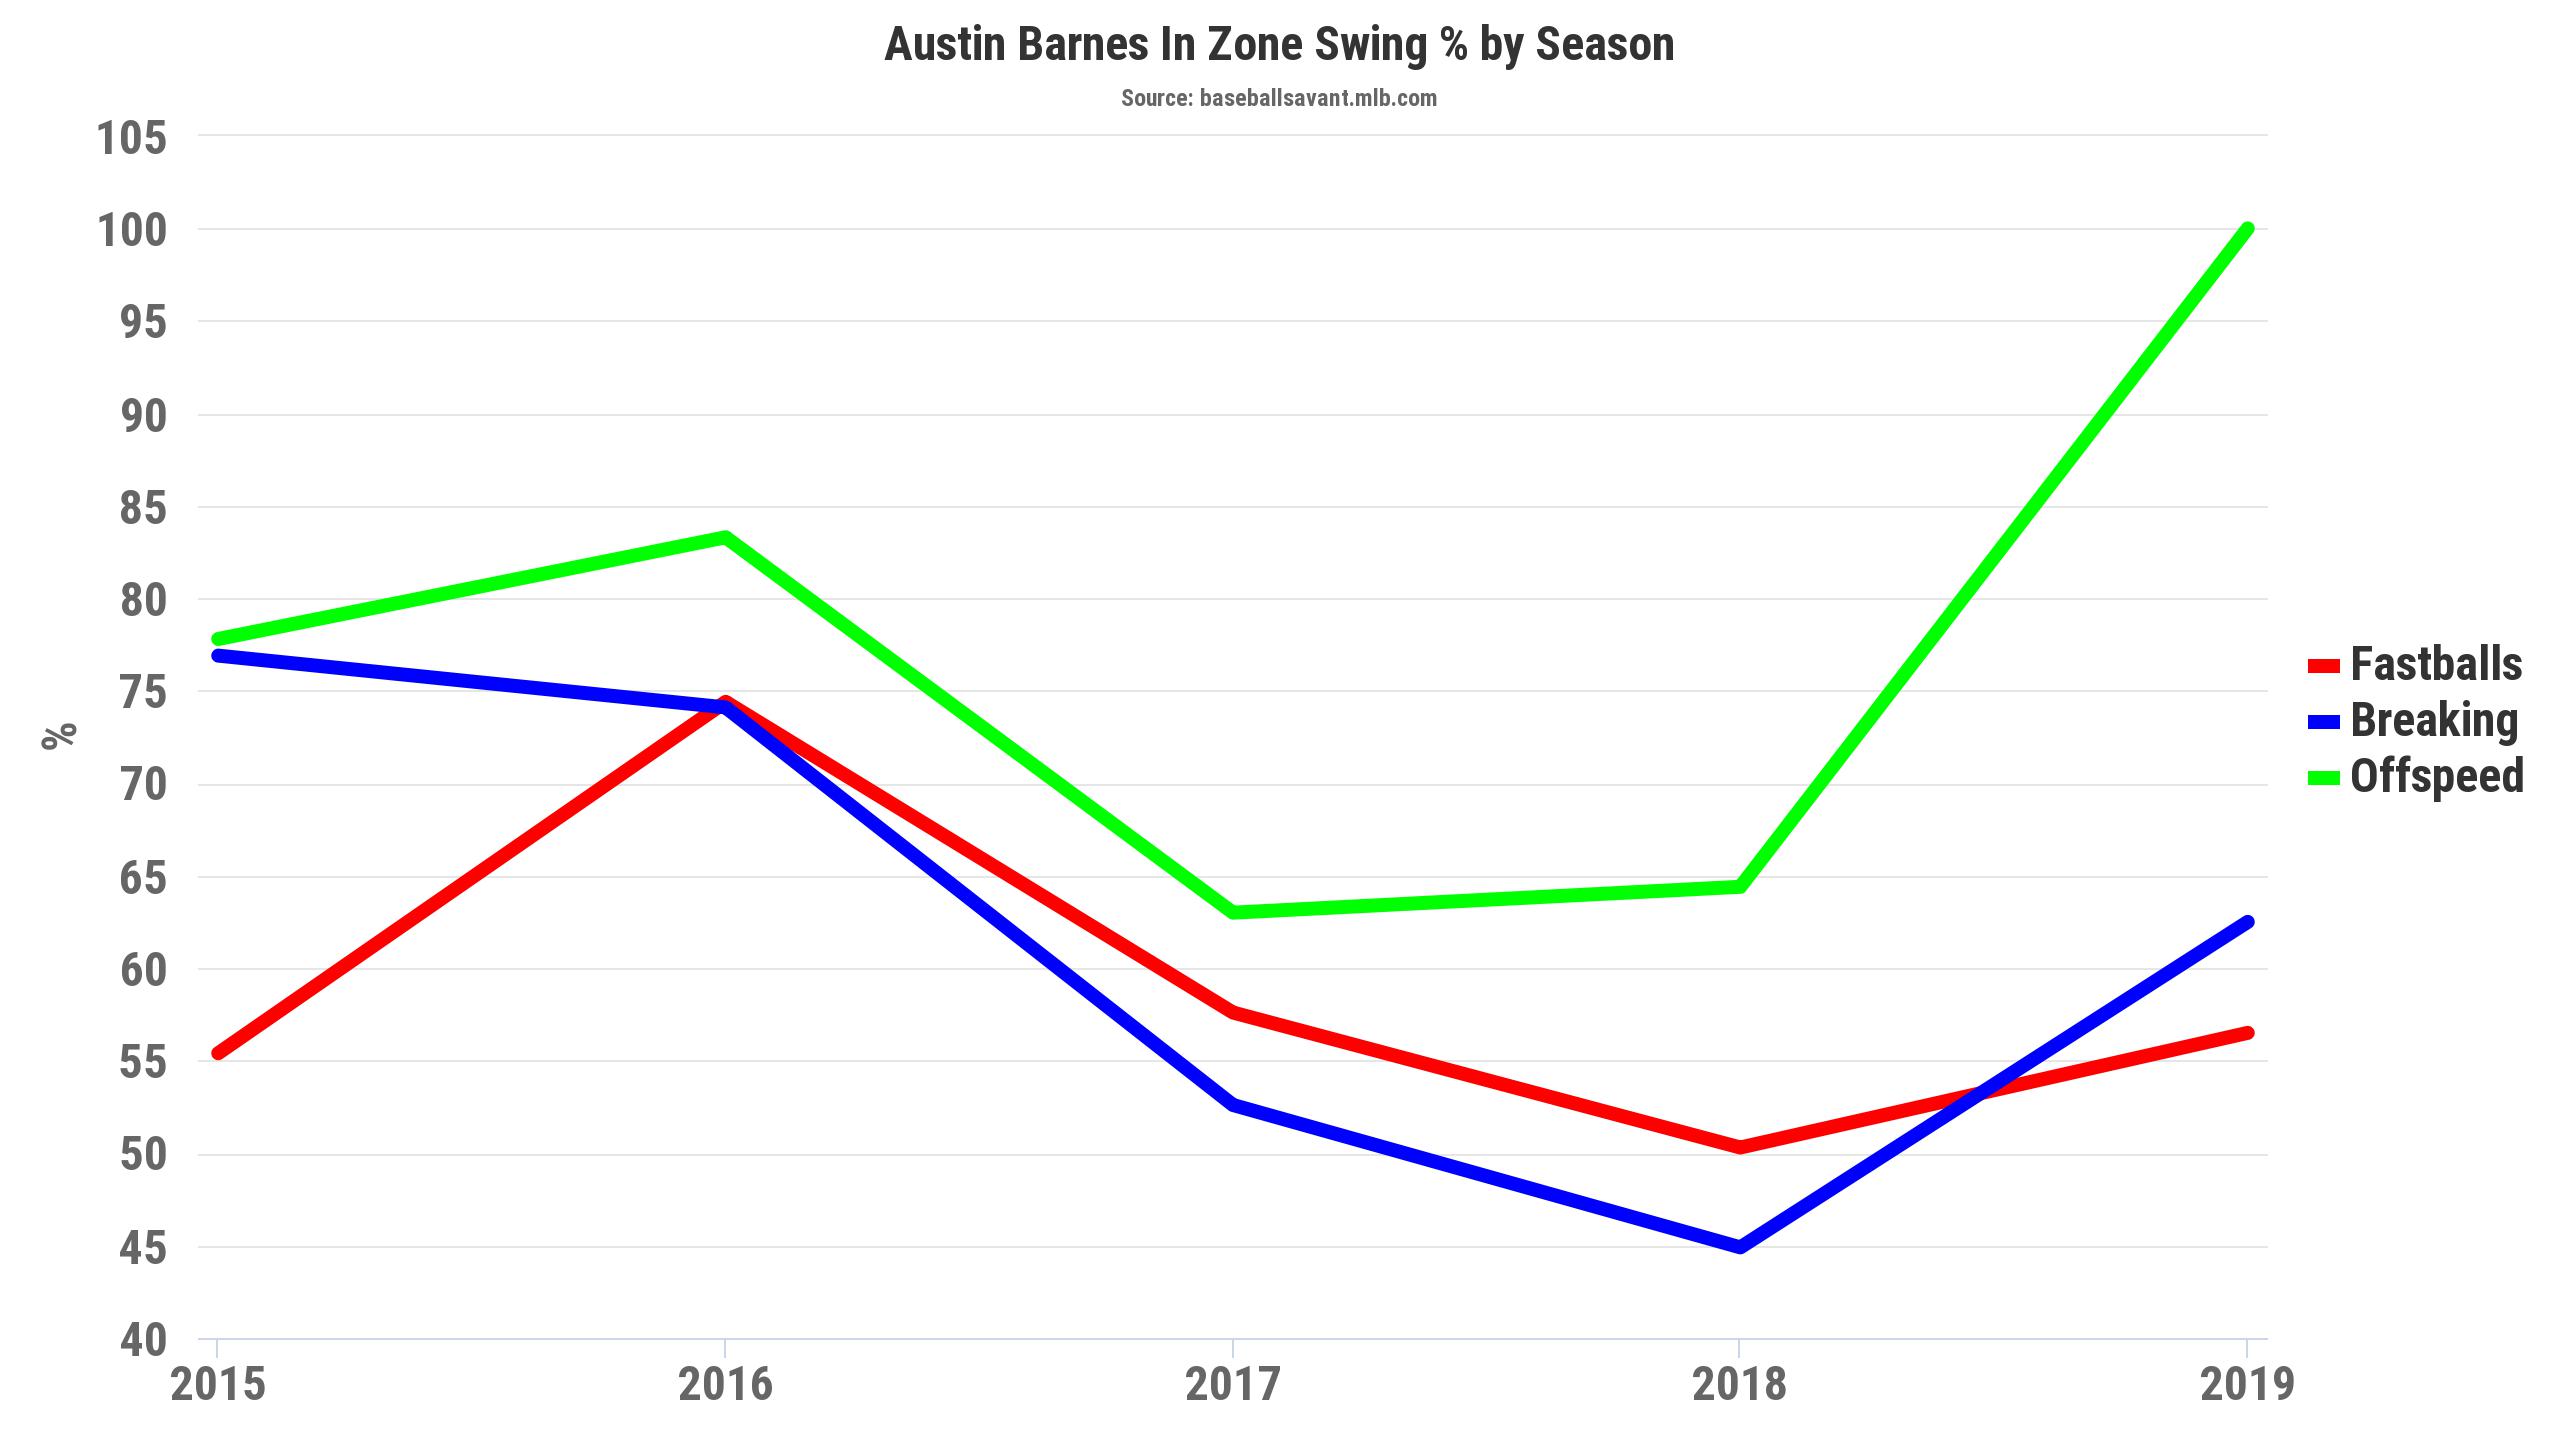
On top of that, Barnes has cut his pitches per plate appearance by over 8% and his called strike rate on the edge from 13.5 to 10.3 (as a percent of total pitches).
Granted, this is only through 21 PAs (not even 100 pitches) and there’s still plenty of room for more growth in those rates. Couple that with the potential for high-level R+RBI production and, if the trend continues, we could see another high-average, elite-OBP campaign with more staying power than his 2017 season. To really return that value, he’ll have to earn significant playing time from Russell Martin. So far, he started seven of ten and I see no reason for the Los Angeles Dodgers to give Martin significant playing time over Barnes moving forward. While Martin is an excellent pitch framer, Barnes ranked in the top 12 pitch framers in the game in Framing Runs Above Average in both 2017 and 2018 and is clearly a strong framer himself. Don’t expect 20+ homer power or even for him to put up double-digit steals as he did in the minors, but if you’ve got the room on your roster, he’s worth an add — just in case.
Photo by Keith Birmingham/Zuma Press/Icon Sportswire
The Clash reference? Austin can’t fail!
Good stuff, Dave!
Barnes is another example of how we should start analyzing a hitter’s plate discipline in a deeper way than just looking at SwStk%. Certain guys backdoor their way into appearing patient and disciplined, but they are probably hurting their overall production by letting good pitches sail by.
Barnes’ career line – 14 HR, 60 RBI, 247 / 371, 9 SB – is probably a good bet for his prorated full-season production moving forward.
It’s a good bet, but I think the average can be closer to .270 if he really commits to the swing change. I’m less bullish on the SB numbers because he’s yet to post even 5 in a season yet. Could be this year though!