


(Photo by Brian Rothmuller/Icon Sportswire)
Not just New York Yankees‘ fans but baseball fans, in general, have been wondering when outfielder Giancarlo Stanton is going to break out. Well, last night’s 3-2 victory over the Boston Red Sox saw Stanton hit two big home runs, draw one walk, and he didn’t strike out once. While under normal circumstances that could be considered condescending but with what Stanton has shown us during the last several weeks, his look in pinstripes hasn’t been great.
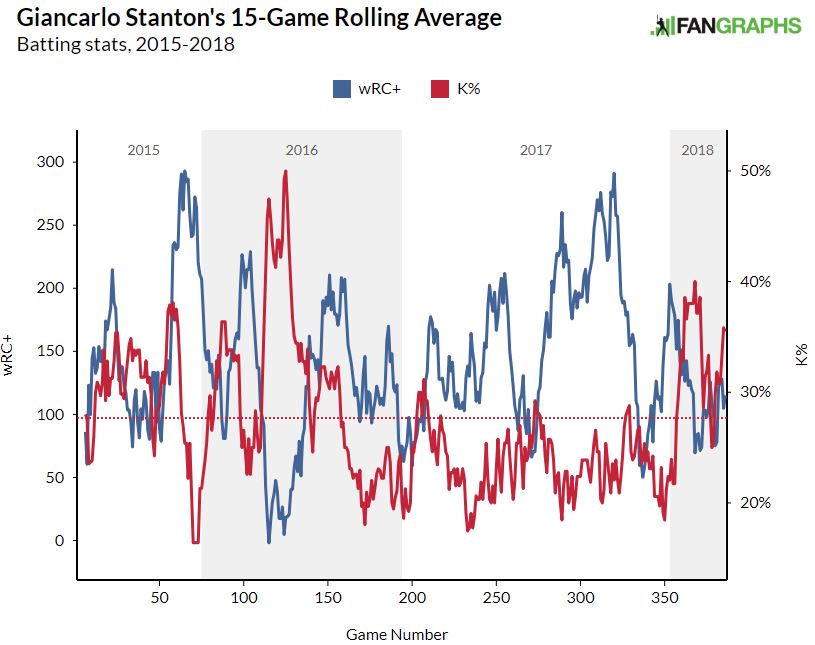
He’s given us hints and teasers throughout the first month and a half of baseball, but nothing has appeared to truly stick. See the chart below and you’ll find the obvious reason for his sluggish start (the red represents 2018).
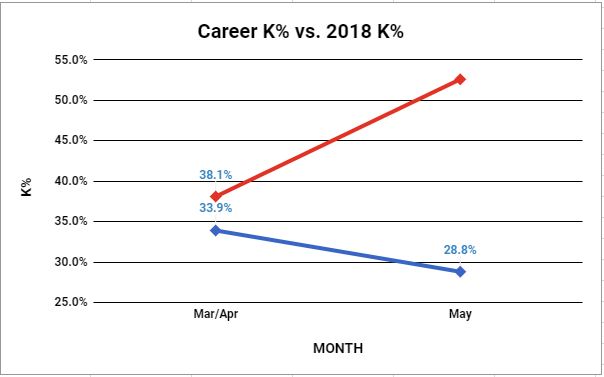
CHART 1
Right now, only two other hitters are striking out more than Stanton (34.4%); Yoan Moncada (37.1%) and Lewis Brinson (35.5%). There is a (mostly) foregone conclusion that Stanton simply strikes out a lot and is streaky; that’s what he does. Can his struggles to be chalked up to nothing more than his propensity to strike out a lot (his career 27.9% K-rate is several points above league average)?
Stanton has kept his K% essentially in the same range throughout his career; no major fluctuations. The exception is that he’s eclipsed the 30% K-rate twice in his career; his rookie year in 2010 (31.1%) and this season. There has to be more to it than that.
Looking over Stanton’s historical contact data compared to what he’s doing in 2018, it bears no real significant issues. His contact rates aren’t deviating much at all from his historical data. He’s hitting a few more ground balls (47%) than normal (and a tad more line drives) at the expense of his flyball rate (34.9%). Only three aspects of Stanton’s plate discipline are skewed; zone contact is way down (-8%), there is a jump in SwStr% (+2.9%), and he’s seeing more first-pitch strikes than he has in his career (+6%). The latter is in line with league-average but its curious because of how much higher it is for him this season. It could simply be the case of pitchers knowing he’s been off since the start of the year ergo they take more chances with him.
So why isn’t he swinging at the first pitch more? Well, his career batting average when offering at the first pitch is .413; the only average that bests that is under a 1-0 count (.437). This season, keeping in mind he only has 9 plate appearances with first pitch contact, Stanton’s swinging first strike BA is just .250.
Two good things; his infield popups are way down and his hard-hit rate is elevated. When he is hitting fly balls, home runs are coming at a rate in line with his normal production. Yet it follows that if his fly ball rate is down, his home run production suffers. Even his BABIP is normal; no issues with luck it would seem and no need to explore his xStats. For the skeptics, looking for an imbalance between his wOBA and expected wOBA shows only a .013 difference; .359 xwOBA, .346 wOBA.
His directional hitting has evoked some eyebrow-raising as well. He’s always pulled the ball at a 40%-plus rate. This season, his pull rate is about 7% lower than his career mark and hitting to the opposite field 10% more than usual. Perhaps its advisable to figure out why that is but the lack of a sizable sample provides an excuse for random fluctuation. I also thought to look into whether his approach and/or demeanor at the plate changed, though it doesn’t appear so after a review of his batting stance over the last couple of seasons.
Is Stanton being pitched to any differently? Looking down at chart two, sort of. Note the appearance of increased changeups, which happens to be a pitch Stanton does really well against. It makes its appearance more often under a full count this season, which is odd considering his career OPS in that spot is .895; 1.404 in 2018 with 10 walks in 26 full count PAs. It gets more absorbing. You see a downward trend in sliders thrown, a pitch he is not good with. It tends to be thrown as much as the four-seam fastball in 3-1 counts; another situation Stanton works very well in. We can’t read into that too much because, keeping in mind the heightened K%, it may just be that pitchers don’t have to use it as often if they are able to get ahead and his swing is already off.
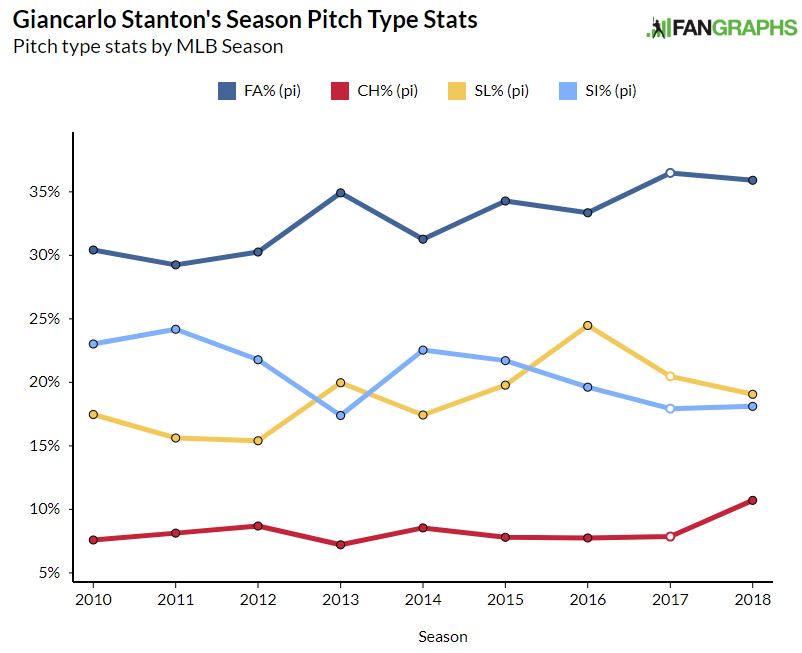
CHART 2
Have a look at both the raw number of counts he’s gotten himself into as well as what his batting average is under those conditions.
CHART 3
Chart three shows Stanton is allowing himself to get into a lot of pitchers counts (less than two out of every three PAs); you’re going to have a very hard time being successful when that happens. The reason can be drawn back to his swing tendencies, his O-Swings in particular. Is Stanton pressing too much? Can it be the lure of The Big Apple and the implied requirements for success? All viable assessments but with no tangible evidence.
Swinging at pitches out of the strike zone doesn’t always equate to being a bad hitter so long as there is a certain level of production and those swings aren’t under a two-strike count on a consistent basis. And no, historically, Stanton isn’t an outlier when it comes to chasing pitches. As mentioned, it is a bit elevated this year. Stanton is seeing just under 55% of his pitches out of the zone; 32.5% of which he’s offering at and 50% results in contact. Looking at chart four, Stanton is taking more chances than he needs to and hitting just .175 OOZ.
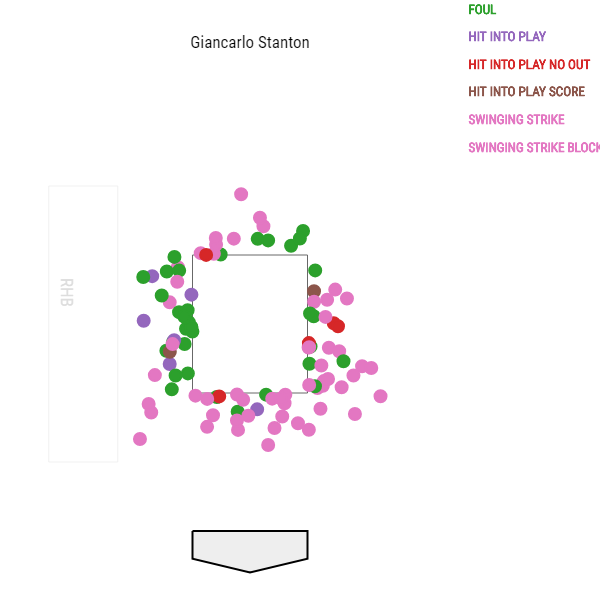
CHART 4
Stanton is also going for pitches in the zone slightly more as well. As mentioned earlier, his contact rate is way down yielding a .253 batting average on contact in the zone.
So far, from what we’ve reviewed, Stanton’s 2018 offense propensity has shown no discernable issue outside of simply striking out too much. It’s perplexing only because he’s never had this much trouble before in his career. Chart five represents his career monthly OPS. March and April are notoriously rough months for Stanton; keep in mind what is ‘rough’ for him is actually great for another player. What we need to key in on is that May has always been one of his best months, which gives the Yankees hope as he’s currently hitting .273 this month.
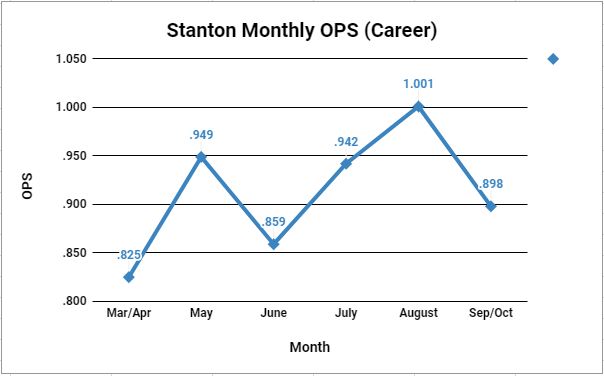
CHART 5
It is possible to have an elevated K-rate and still be productive. As of May 8th, using the top 30 highest strikeout rates, there are 17 hitters with a wRC+ of 100 or better; three more right on the edge at 90 or more. However, Stanton is one of those mutually exclusive hitters, statistically speaking. When he strikes out a lot, his wRC+ falls with predictability.
Despite all the concern and inspection, May is working out well so far for Stanton (.273/.385/.909). Yet the dark cloud of strikeouts has yet to clear (10 Ks in 22 ABs). Keeping on the ratio of his strikeouts this season in accordance with his at-bats this month, I am estimating roughly 61 more strikeouts occurring within his next 120 or so at bats. How well Stanton is able to tame his strikeouts (about one strikeout every four at-bats) will dictate how much his offense will flourish in the coming months.
Though we explored several avenues for clues to what is facilitating Stanton’s early offensive endeavors, perhaps it is as simple as a mental adjustment; needing time to settle into the Bronx. After his two-home run game last night, it’s tempting to assume he’ll climb out of this funk. It’s easy to be optimistic but this is something we’ve seen before prior to the bottom dropping out. Stanton will hit, and hit well, but will it be enough to warrant his bounty for coming to the Bronx?