


(Photo by Dan Sanger/Icon Sportswire)
Here is the second installment of the quality of contact series. If you missed the first article, refer back to it for a breakdown of how it works. The next group is the second basemen across the league. The charts will follow the same format as the last article. As a reminder, the players qualified only if they had 250 plate appearances at the position. Beginning with the American League second basemen, here is the contact quality chart:
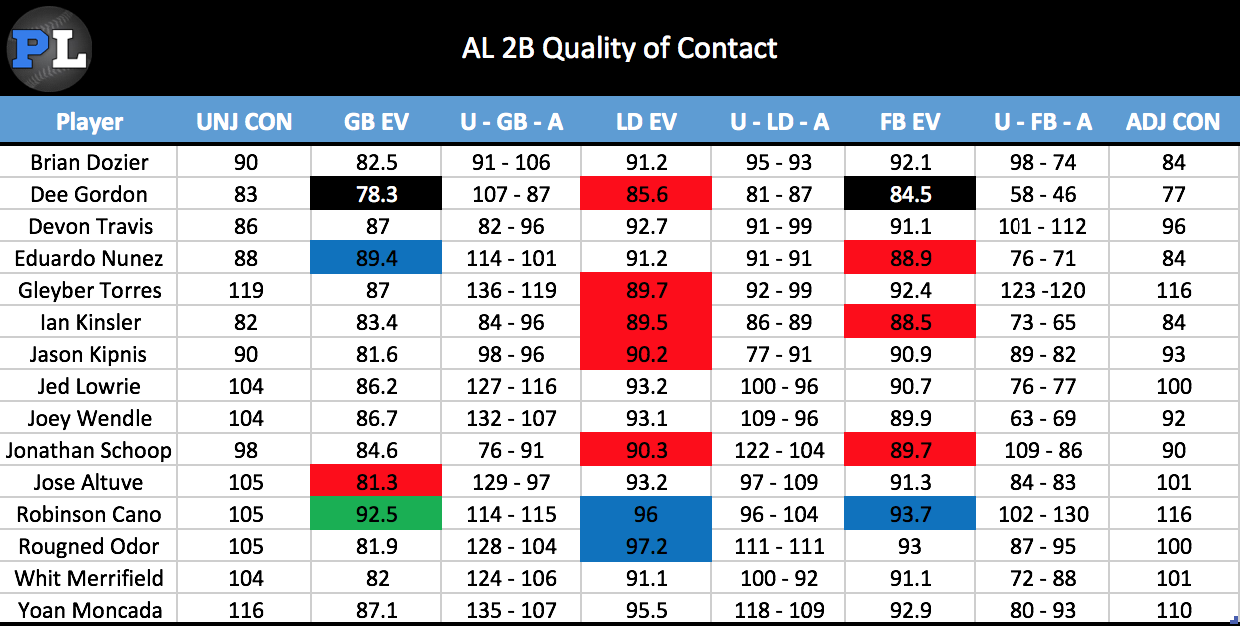
Green = Two deviations greater than average
Blue = One deviation greater than average
Red = One deviation lower than average
Black = One and a half deviations lower than average
The above chart is the Statcast contact quality data. It hold the unadjusted and adjusted contact scores overall and for the Statcast batted ball types, along with exit velocities for each type. Now, our frequency data:
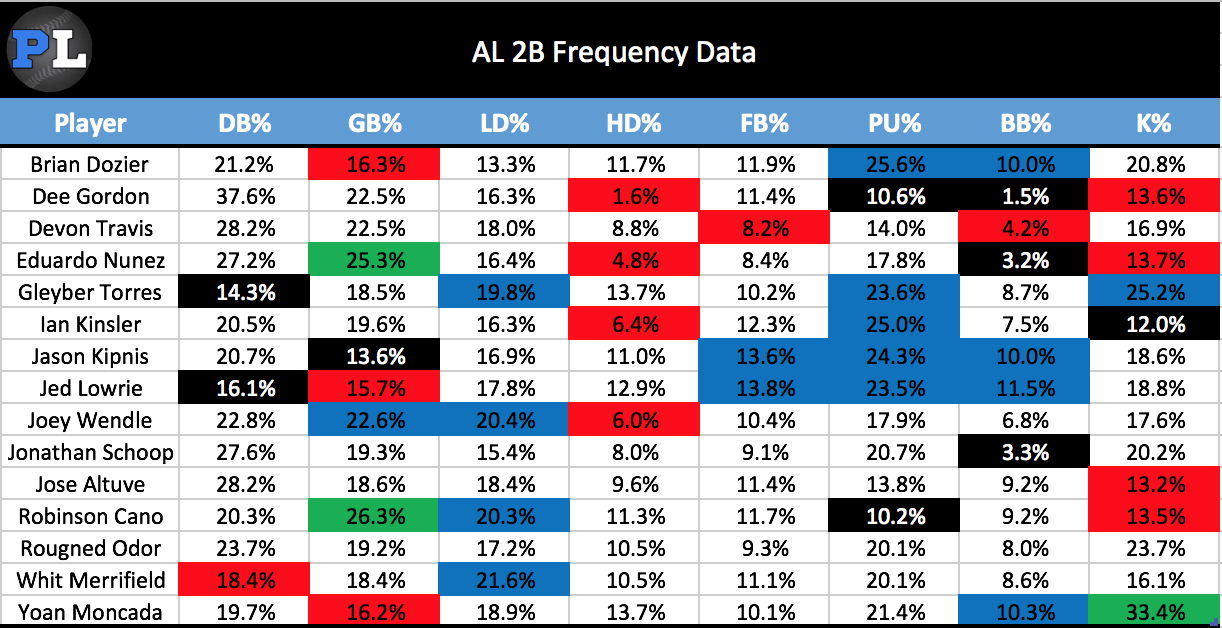
Green = Two deviations greater than average
Blue = One deviation greater than average
Red = One deviation lower than average
Black = One and a half deviations lower than average
The second above chart is the batted ball frequencies for the xStats data, along with walk and strikeout rates. I’ll include a chart from the last article to give reference between the Statcast and xStats categorization.
| Statcast | xStats | ||||
|---|---|---|---|---|---|
| Batted Ball | Launch Angle | Abbreviation | Batted Ball | LA Average | Exit Velocity |
| Ground Ball | Less than 10˚ | DB% | Dribbler | -19.3˚ | 73.6 mph |
| Line Drive | 10˚ – 25˚ | GB% | Ground Ball | -0.7˚ | 92.3 mph |
| Fly Ball | 25˚ – 50˚ | LD% | Low Drive | 12.8˚ | 94 mph |
| Pop Up | Greater than 50˚ | HD% | High Drive | 24.7˚ | 102.5 mph |
| N/A | N/A | FB% | Fly Ball | 29.4˚ | 88.9 mph |
| N/A | N/A | PU% | Pop Up | 46.2˚ | 84.6 mph |
Lastly, reiterating something from the first article – I noted that xStats batted ball categories help with quality of contact breakdown because they include more predictability year over year. To elaborate, high drives are the most predictable of the ability to hit the ball hard. Dribblers and pop ups are the most predictable of a lack of contact authority. Low drives are the biggest indicator of batted ball luck, as they have a very high BABIP but are the least predictable batted ball. Ground balls and fly balls also have very low predictability across seasons.
With the background being cleared up, let’s begin with the breakdown:
In a short season due to PED suspension, Robinson Cano still displayed his contact authority. Exceptional exit velocities for all Statcast BIP types placed him tied for first in the group for adjusted contact score. Elevated xStats ground ball and low drive rates likely contributed to some contact performance above his current skill level, but his constant high drive shows his lasting contact abilities. The rookie Gleyber Torres matched Cano in adjusted contact score, backing his great first season. A minuscule dribbler rate paired with a solid high drive rate further supported his contact performance.
Yoan Moncada is the only other member of the group with a largely above average adjusted contact score. Moncada held solid exit velocities in all Statcast batted ball types and an xStats profile with no red flags. However, with that ghastly strikeout rate, a more standout performance in contact authority would look better for Moncada.
Last year’s American League MVP didn’t quite have a season like previous years, but Jose Altuve was still superb. The contact figures don’t particularly like his season, but they rarely do. There are no standout issues in his profile compared to other seasons, so expect Altuve to keep producing. Whit Merrifield falls in the the same boat as Altuve. His xStats contact quality was actually a little better, with his dribbler rate being significantly lower. The contact numbers still don’t love him, though. However, they haven’t in previous years, and they don’t need to.
Brian Dozier leads the disappointments of the group. His raw exit velocities are not actually so poor, but they are mediocre enough to line up with his terrible overall adjusted score. Dozier’s elevated xStats pop up rate signifies some decreased contact authority, but the rest of his xStats profile actually isn’t so bad. His high drive rate only slightly fell and his dribbler rate was aligned with career norms. The lack of significant differences in his contact authority is definitely a head scratcher, but weaker performance within each category may explain it. For example, his high drive average exit velocity fell from over 100 mph in past seasons to 98.5 in 2018.
Dee Gordon will certainly challenge for the title of worst contact authority. Terrible exit velocities across the board. His high drive rate was mind-blowingly low, and he paired that with a massive dribbler rate. He doesn’t have the plate discipline to make up for it, either. Eduardo Nunez didn’t fare a whole lot better than Gordon in overall adjusted contact. His exit velocity is better, but a similarly terrible high drive rate puts him there with the bottom of the group.
With his current age and massive drop in high drive rate, Ian Kinsler‘s season makes us wonder how soon his career will come to an end. Poor air ball exit velocities and a too-large pop up rate only make it worse for Kinsler.
The contact authority numbers match the weak offensive production for Devon Travis. His exit velocity isn’t so bad, but the lack of air balls stunts power production and his overall contact performance. After a solid start to his career, Travis’ numbers have plummeted and his contact abilities prove to be limited.
Two veterans, Jed Lowrie and Jason Kipnis, posted quite similar contact profiles. Lowrie looks a little better in both Statcast and xStats, but both proved to be very wary of putting the ball on the ground. Lowrie and Kipnis posted some of the highest xStats fly ball and pop up rates while putting up lower dribbler and ground ball rates. Avoiding ground balls is certainly beneficial for power potential, but trading some of those fly balls for high drives would make a big difference in contact authority for the pair. Kipnis and Lowrie hit too few balls at the optimal exit velocities and launch angles to really celebrate their air ball tendencies.
A midseason hot stretch saved Rougned Odor from what looked to be another miserable season. His contact profile mostly reflects the average production he put up, with no significant deviations from average in his xStats profile. His contact authority was not poor, but it was far off from his great 2016 season. On a positive note, Odor finally started taking his walks.
Jonathan Schoop failed to follow up last year’s great season. His dribbler rate went back up and his high drive rate went back down, a combination that never culminates in positive results. Statcast backed this bad contact with his below average exit velocities on his air balls. Unfortunately, Schoop’s terrible plate discipline leaves him with nothing to fall back on.
Lastly, we have the breakout rookie Joey Wendle. His adjusted contact score reflects some luck in his actual performance, highlighted by his 132 unadjusted ground ball score. The xStats profile also backs the luck. Wendle had elevated xStats ground ball and low drive rates, both categories with high BABIPs but little year to year predictability. The contact authority from this season does not support such a successful performance next year, but Wendle still impressed as a rookie.
Next, we move to the National League second basemen. Our quality of contact chart:
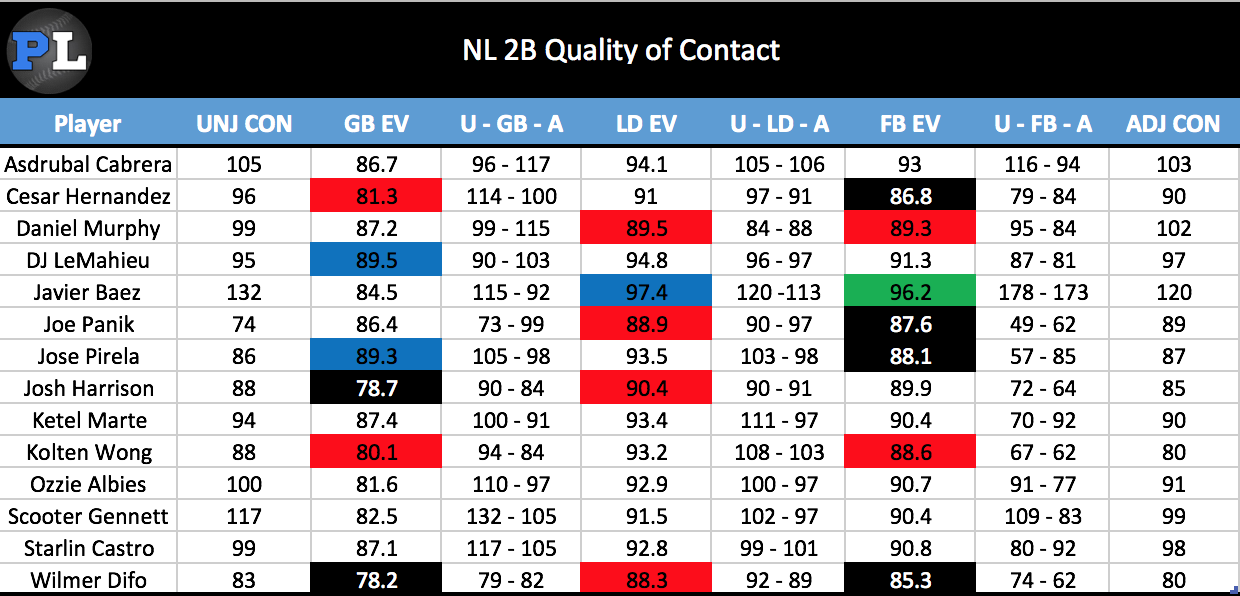
Green = Two deviations greater than average
Blue = One deviation greater than average
Red = One deviation lower than average
Black = One and a half deviations lower than average
And then our frequency data:
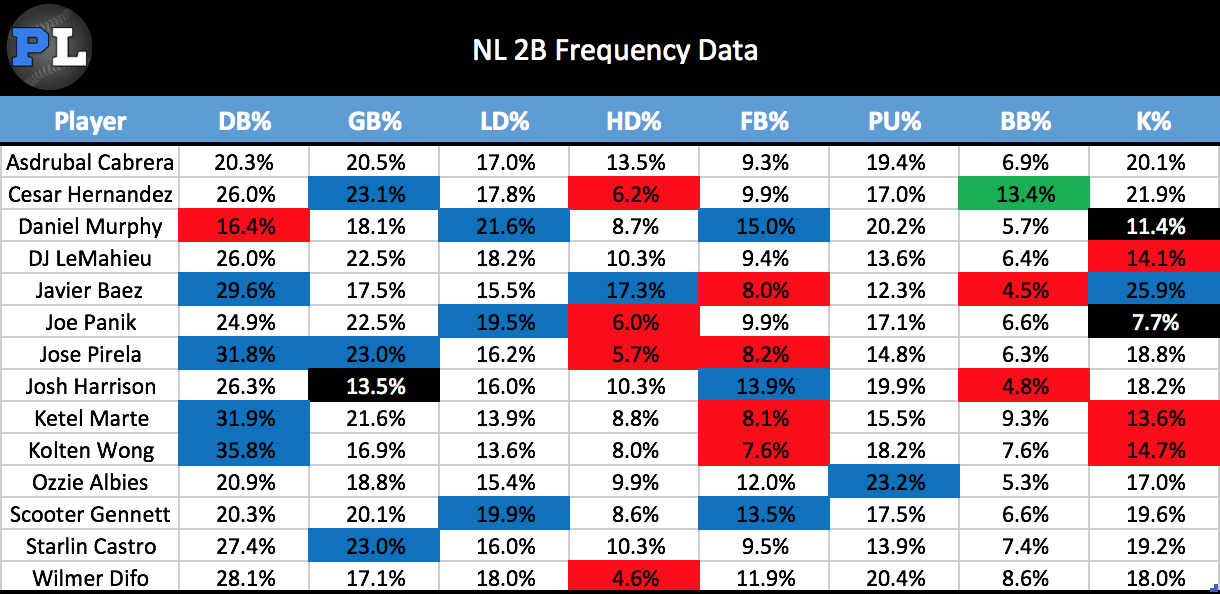
Green = Two deviations greater than average
Blue = One deviation greater than average
Red = One deviation lower than average
Black = One and a half deviations lower than average
There is only one standout of this group, and you could probably guess who it was before the data was shown. Javier Baez still lacks the plate discipline, but he sure made up for it with his contact this season. Baez demolished his air balls, posting superb exit velocities for his Statcast line drives and fly balls. He boasts an adjusted contact score of 173 on those fly balls, an absurd figure. His xStats high drive rate backs the air ball production and his contact authority. Despite the insane air ball production, Baez overall adjusted contact score is at a great but not exceptional 120. Why? Likely because of his high dribbler rate, which drags down the rest of his fantastic numbers. Baez’s combination of big high drive and dribbler rates is an uncommon one. It can likely be attributed to his free swinging nature: Baez can crush the ball, but swinging at a large amount of bad pitches results in some poor batted balls.
This group falls off a cliff after Baez, with Daniel Murphy and Asdrubal Cabrera being the only players grading above 100 in overall adjusted contact. It was a strange year for Murphy, but he still managed a positive season. Murphy wasn’t lacking in any xStats contact category, and his low dribbler rate points to his remaining abilities. Too many high drives were traded for fly balls, though, and he lost some exit velocity on his air balls. Cabrera quietly put together a nice season, grading nearly average across the board in his contact authority. His high drive rate significantly topped Murphy’s, but fewer balls in the xStats ground ball and low drive categories limited his BABIP to a degree.
Wilmer Difo and Kolten Wong bring up the rear of the group. Both posted poor exit velocities across all their Statcast BIP types. Wong exceeded Difo in his high drive rate, but made up for that by posting a massive dribbler rate. Neither would be expected to display impressive contact authority, and they lived up to those expectations.
Scooter Gennet built on last season’s breakout, but his contact numbers actually like him less than last year. His high drive rate crumbled and and a chunk of that ended up in the fly ball category, something you do not want to see. Gennett seems to be the beneficiary of an increased low drive rate, which handed him more singles than last season. Higher BABIP helped overall production, but his contact authority was actually rather disappointing based off last year.
Starlin Castro and DJ LeMahieu posted the two most unremarkable seasons of the group. Both sat right at average in their overall adjusted contact score and in nearly every batted ball type. The pair lacked the kind of fly ball authority to post big power numbers. LeMahieu did set a career high in high drive rate and home runs, though.
Cesar Hernandez impressed with his plate discipline this year, but his contact authority did not match in success. His Statcast fly ball numbers were terrible, and his low high drive rate further proved showed his lack of power. Hernandez simply puts too many balls on the ground and his air balls don’t lead to great results.
There is a three man group of Jose Pirela, Joe Panik, and Ketel Marte. These guys all did not fare well in the adjusted contact numbers as a result of too many balls hit on the ground. All three had high combined rates of their xStats dribbler and ground ball rates, while none of them posted an even average high drive rate. Marte shines in his plate discipline, but there is not much positive to say about the contact of this group.
Even in a terrible year, Josh Harrison actually posted a career best high drive rate. Still, that came with far too many weakly hit balls in the air. Most of his balls on the ground were dribblers rather ground balls, which limited his BABIP potential.
After such an exciting opening month of April, it was disappointing to see Ozzie Albies struggle in the second half. His quality of contact on the year does not look that bad, but it’s not strong enough to make up for his lack of walks. Albies popped the ball up too much and didn’t show much authority in his other air balls. He was missing too many balls at optimal launch angles and it resulted in a below average contact performance.
As expected for a position that generally does not come with an offensive premium, the second basemen performed mostly below average across the board. The National League held the best player at the position, but as a whole the American League second basemen outperformed their counterparts. As seen in their dribbler rates, many of the NL members had a knack for weak ground contact, which usually won’t result in positive overall production. Contact authority was poor for most second basemen in 2018, but not out of the ordinary for the position.
How does Statcast GB% compare with Baseball Info Solutions? Fangraphs uses BIS data for their record-keeping, and their GB% is much higher for everybody here. You recommend one as more useful than the other?
I’m curious about Jonathan Villar. Did he miss the cut by switching leagues?
For guys that recorded more than 250 plate appearances overall but not at a single position or not in a single league, there will be an article for that group at a later time. I’m not quite sure how BIS defines ground balls, but Statcast defines them as any balls hit below 10 degrees. I noted the xStats as more useful simply because the differentiation of the batted ball types is more descriptive because it is based off launch angle and exit velocity.
I also am curious about Jonathan Villar. Thanks.
Great post.
Gennett is a major candidate for regression. I’m surprised more people aren’t talking about his middling batted ball authority and xStats. With that said, his career wOBA is more than 30 points above his xwOBA, so maybe he’s managing to get hits in a way we don’t realize. His home ballpark probably helps.
I’m also very bearish on Wendle. Would not be surprised if he’s a bench player by June.
Keep these coming! Good job!
Where are you finding exit velo averages that differentiate by batted ball event? I can find average velo, but not per ground ball, line drive, fly ball, etc.
I know that the major bins (GB, LD, FB) vary a fair amount year over year for even the most consistent hitters. It is hard for me to imagine that the more granular bins won’t vary even more. I guess I don’t really understand how this isn’t simply a more elaborate summary of the events that already happened. Another way of putting it is that I already know that Javy Baez has a good season without the batted ball information. I already know that he crushes the ball. Is the idea that you are going to unearth unknown commodities? I don’t see a lot of surprises in the data. Nothing personal whatsoever, I wonder the same thing of most advanced metrics – I want to be clear about that. I am legitimately interested in anything baseball-related and I read this article just like I read many others, but I am wondering what this information is supposed to tell you. Is the idea that it verifies or nullifies a season of real outcomes? Personally, I will take the real outcomes. I don’t understand how a player could not get lucky/unlucky in terms of batted ball events any more or less than they could with real outcomes. Luck could be in the form of getting a bunch of meatballs that fuels batted ball stats just as much as it could be a weakly hit fly ball for a triple. I would reckon that for every overachiever, there is an underachiever. To loop back to my opening sentence, the smaller the bins, the greater the potential for fluky outcomes becomes. I am sure it doesn’t always seem like it, but I am here to try to help. I appreciate the work as it gives me something to think about which IMO is what this is all about.
I’d love to see what Jeff McNeil would look like. Too few PAs?