


This past offseason, the Minnesota Twins added Jonathan Schoop to replace Brian Dozier at second base. A month into the season, Schoop’s one-year, $7.5 million contract looks like a steal for the Twins, as the 27-year-old has hit .282 with 5 homers in his first 29 games. After a disappointing 2018, the question remains, is this version of Schoop legit, and what should we expect the remainder of the season?
As I started digging into Schoop’s advanced statistics, it quickly became clear that this wasn’t a clear case of “he’s doing everything right/wrong.” There is a mixed bag of good indicators and poor ones. I’ll do my best to break them down one by one.
The Good
The first things I look at when analyzing hitters’ performance is their batted ball profile. Specifically, I’ll check walk-rate, K-rate (and the highly correlated swinging strike rate), and their Soft, Medium, and Hard-hit breakdown. The majority of these are quite good for Schoop; he’s hitting the ball hard (42% hard-hit rate) and striking out less than usual (19.8% K-rate). His BABIP is at a reasonable .316 to support his .282 batting average. If we look to his flyball, groundball, and line drive breakdown, there isn’t much deviation from his career rates.
Digging deeper and looking at Schoop’s Statcast data, we find that his barrel-rate is at a career-high 9.9%. For context, that figure places him in the company of Yandy Diaz, Eric Thames, and Xander Bogaerts, all of whom have seen a fair amount of success in 2019.
So, Schoop is doing a lot of things well 29 games into the season, but there’s still room for improvement.
The Bad
Let’s stick with Statcast figures for a bit. Schoop’s expected statistics do show that some negative regression may be coming his way. While his xBatting Average of .274 is only 8 points lower than his actual .282 mark, the xSlugging percentage is notably lower, a .444 mark compared to his actual .505 SLG. These numbers aren’t a death sentence by any means, but they do indicate that Schoop may be producing a bit better than is to be expected.
Now for the actually concerning part: home-road splits. Schoop is simply not producing at home. Target Field has been determined to be a fairly neutral hitting environment, slightly tipped in the hitters’ favor, if at all. However, Schoop is slashing just .204/.232/.296 in Minnesota. He’s been getting almost all of his positive production done on the road, where he’s played at Yankee Stadium (NYY), Tropicana Field (HOU), Camden Yards (BAL), Citi Field (NYM), Citizens Bank Park (PHI), and one game at Kauffman Stadium (KC). Of these venues, the majority (NYY, BAL, HOU, PHI) are considered to be hitter-friendly ballparks.
Taking a closer looks at the game logs, we see that 4 of Schoop’s 5 home runs came in just two games. On April 9th, Schoop hit 2 home runs as the Twins beat the Mets 14-8 at Citi Field. The first was off Seth Lugo, and the second Jason Vargas, pitching in relief. On April 20th, in the night game of a doubleheader, Schoop once again double-donged en route to a 16-7 Twins victory at Camden Yards. The first was off Mike Wright, and the second off position player Chris Davis.
Clearly, the power production has been streaky at the very least, and downright absent for the majority of the season. Now, one thing that ought to be considered concerning his poor home performances: Schoop plays in Minnesota. For those unaware, Minnesota tends to be quite cold in March and April. A lot of players, especially those from Caribbean and South American countries, such as Schoop, a native of Curacao, tend to perform worse in cold weather. We may just have to wait for the summer heat to come to Minneapolis for Schoop’s home run production to come around.
Now, there were a few other interesting findings that don’t clearly fall in the good or bad categories, so we’ll call them odd.
The Odd
A clearer way of looking at power production is isolating line drives and flyballs, the only batted balls capable of going over the outfield fence. Looking at his balls in the air, he’s doing a great job of hitting them with authority, putting up a 46.7% hard-hit rate. What is interesting is the direction he’s hitting the ball in the air. These batted balls are going to the pull side, where most power is generated, 35% of the time, to center 24% and to the opposite field 40%. So, these batted balls that are the key to Schoop’s power output are more often going to the opposite field than the more-productive pull side.
| Line Drives and Flyballs (2019) | ||||||
| # of Instances | AVG | SLG | ISO | BABIP | wOBA | |
| Pull | 16 | 0.563 | 1.500 | 0.938 | 0.417 | 0.838 |
| Center | 11 | 0.455 | 0.818 | 0.364 | 0.288 | 0.316 |
| Oppo | 18 | 0.278 | 0.444 | 0.167 | 0.278 | 0.303 |
The sample may be small, but the numbers tell their story loud and clear. Schoop needs to be hitting balls in the air to left field, his pull side.
What makes this phenomenon even more interesting is considering the groundballs on their own. Schoop is pulling his groundballs at a rate of nearly 70%. The issue is that almost all of them find the glove of an infielder. Schoop has a .200 batting average when he hits the ball on the ground to the left side, yet this is one of his most common batted ball outcomes, as shown in the graphs below.
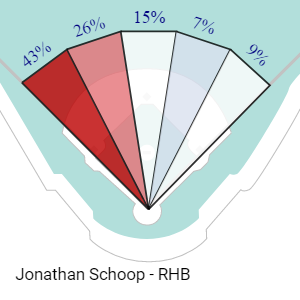
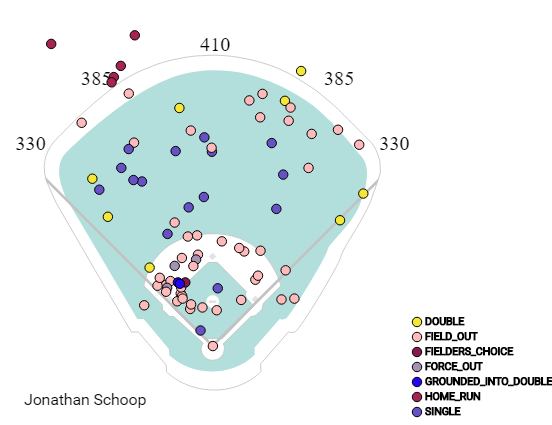
The spray chart clearly shows that the majority of the outs that Schoop has hit into have been on the left side of the infield. Interestingly enough, it also shows that all five of his home runs were hit to the pull side, further solidifying that as his optimal approach. Splitting the field down the center and counting the hits over flyouts on either side of the outfield is fun as well (19/6 flyouts over hits to left, 7/9 to right); yet another checkmark in the “pull balls in the air” approach.
The Takeaway
After looking over everything, I’m definitely more interested in watching Schoop over the coming months. While he is finding success now, I’m inclined to believe that his method is flawed. He ought to pull grounders less and, say it with me folks, pull the ball in the air! Pair his flawed method with his poor performance at home and I’m a bit concerned. The majority of his positive production has come in hitters parks, with four of his five home runs hit in just two games.
If I was a Schoop owner, I would probably be trying to sell him. He could continue to see success this year, especially with a change to his approach, however he’s definitely a risky play. He hasn’t done a lot for your team outside of two great games, and now may be the best time to move him while his overall numbers look pretty good.
Featured Image by Justin Paradis (@freshmeatcomm on Twitter)
Preaching to the choir, brother. Loved Schoop at his ADP and yet, been trying to sell him for almost a month. Tried to package him and Bogaerts for Acuña – and the guy who has Acuña needs MI help BADLY – but to no avail.
Hard to Sell when I added him from waivers in both leagues last week. For some Schoop owners, namely owners of Scooter Gennett, Schoop is the best stop-gap available at the cheapest (free) cost.
Holding til Gennett returns then dropping.
This is my Plan B.
He was on waivers in both of your leagues? That’s surprising.