


Now that we’ve hit December, NFBC drafts are kicking off, and fantasy baseball enthusiasts are building their rankings. In researching certain players, many will see things that don’t add up and rush to make conclusions. For instance, both Justin Turner‘s 45% hard and 10.9% soft contact rates and Joey Votto‘s 41% hard and 9.1% soft contact rates are excellent, but each guy hit fewer than 15 home runs, so one might predict that positive regression is coming. Or you could note Travis Shaw‘s BABIP dropped 70 points from 2017 to 2018, see that he made 39.8% hard contact, and think that more of his hard-hit balls will find holes next season.
In my increasingly strange obsession with quality of contact, I’ve written about how hard contact was up across the league this season for no good reason, and I’ve noted that hard contact was extremely elevated at Chase Field, similarly without a corresponding increase in power. This time, I want to explain how you can safely use quality of contact measurements to make decisions for your fantasy leagues.
Too often I see people just quote hard or soft contact rates to say that a guy is going to get better or worse. Is hard contact actually predictive of power? Can it be useful for batting average, too? What about soft contact? Let’s do a little myth-busting to see how, exactly, you can use quality of contact measurements to evaluate a player.
Quality of Contact and Batting Average
Can you look at a player’s quality of contact to determine whether his batting average might change? First, let’s see how much of the variance in batting average is caused by hard and soft contact. Borrowing a framework from Dave Cherman and Chaz Steinberg, I collected all qualified hitters’ data going back to 2014 and compared their hard and soft contact rates to their batting averages. The closer an R-squared value was to 1, the higher the correlation between the two sets of data.
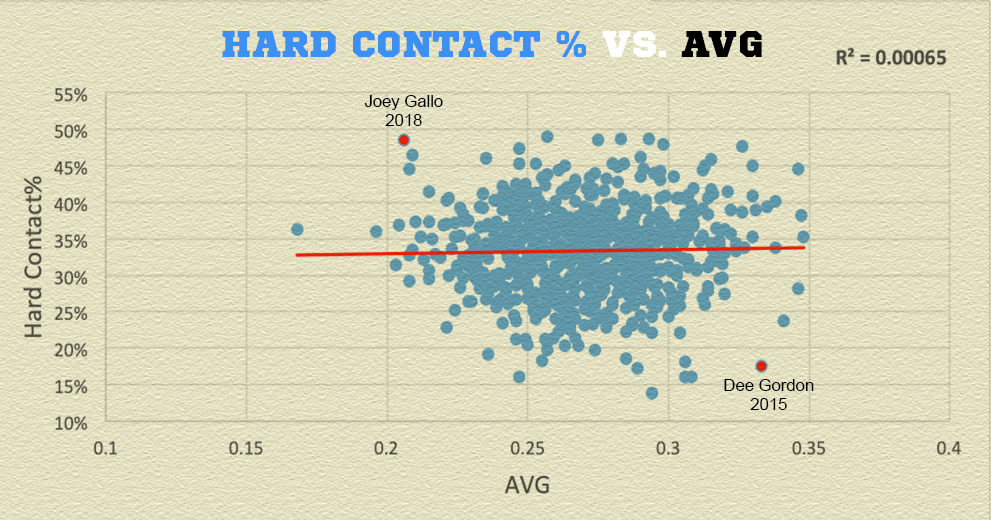
Beginning with hard contact, the scatterplot is pretty telling. Making more hard contact has almost no correlation to improvements in batting average whatsoever. The R-squared value is nearly 0, and you can tell just by looking at the graph that there are plenty of players who made a lot of hard contact without correspondingly elevated batting averages.
One explanation may be that those players who hit the ball harder are also hitting more fly balls in an attempt to hit home runs, and fly balls are the worst type of batted ball for batting average. I highlighted one example of this phenomenon in red on the scatterplot: Joey Gallo. In 2018, Gallo hit .206, but made 48.5% hard contact. Without context, you’d think he got incredibly unlucky given how hard he hit the ball, and that in 2019 his batting average would improve as some of those hard-hit balls start missing gloves. Yet, every year Gallo bats right around the Mendoza Line.
The reason? He hits a lot of fly balls. In 2018, he hit 49.8% fly balls that, in combination with his 45.1 Pull%, dragged his BABIP down to a low .249, and resulted in an even lower batting average of .206.
Likewise, there are plenty of players who do not make a ton of hard contact, but maintain high batting averages. I highlighted Dee Gordon’s 2015 season above, in which he hit .333 with only a 17.6% hard contact rate. The reason is obvious, he hits a lot of ground balls that he can leg out for base hits. He doesn’t need to hit the ball hard to maintain a great batting average.
Okay, so hard contact and batting average are hardly (ha-ha) correlated. How about soft contact?
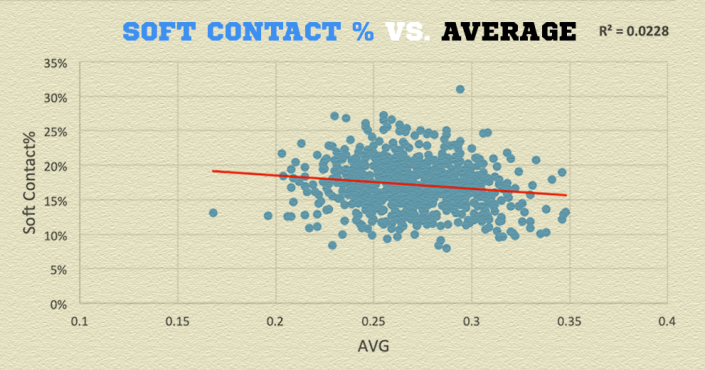
That’s slightly better, but the correlation is still extremely weak and soft contact, consequently, is also not predictive of batting average. What does an R-squared of 0.0228 mean, exactly? Basically, that 2.28% of the variance in the batting averages is explained by the soft contact rates.
I think it would be helpful if we simplified things and eliminated a variable or two to see the true effect of a hitter’s quality of contact. In other words, if we looked at just balls in play, and eliminated things like strikeouts and home runs (walks are already excluded from batting average), we can get a better sense of whether hitting the ball harder results in more hits. Indeed, given that the R-squared between BABIP and batting average is a lofty 0.59404, it is important to see whether a hitter’s quality of contact can influence BABIP, and, in turn, batting average. I’m aware that home runs — which are excluded from BABIP — impact batting average, but we’ll examine quality of contact and power in greater depth later.
With that in mind, let’s see the effect hard and soft contact rates have on BABIP.
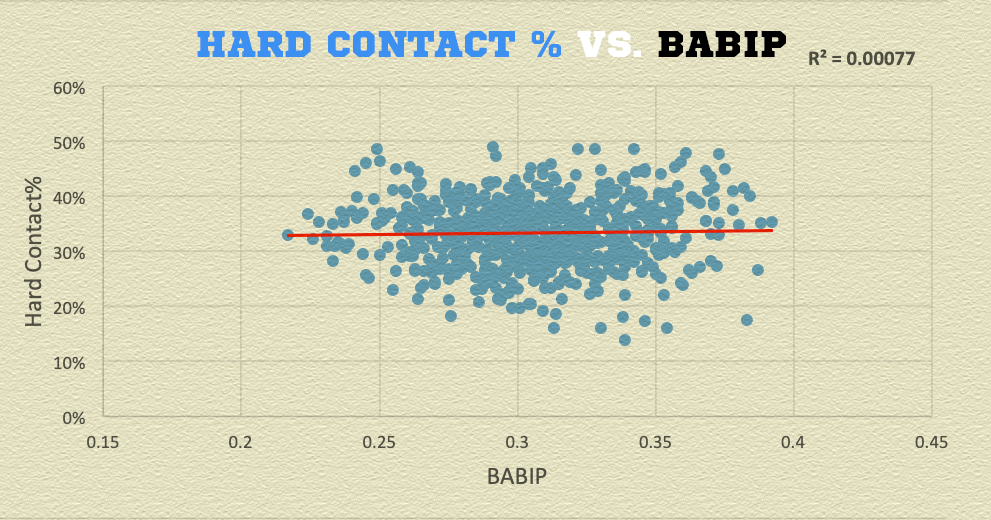
Fool me once, shame on you, fool me you can’t get fooled again. That’s my odd way of saying that I reasonably expected making more hard contact would result in more hits, just as I thought making more hard contact would lead to a better batting average, but I was wrong in both instances.
In any event, we should all stop pointing to hard contact to say a guy’s batting average will improve. Not only does hard contact have barely any impact on batting average (again, 2.28%), but it has an even weaker correlation to BABIP! The reason is that hard contact is decently correlated to home runs (more on that later), which we’ve just removed from the equation by looking at BABIP instead of batting average.
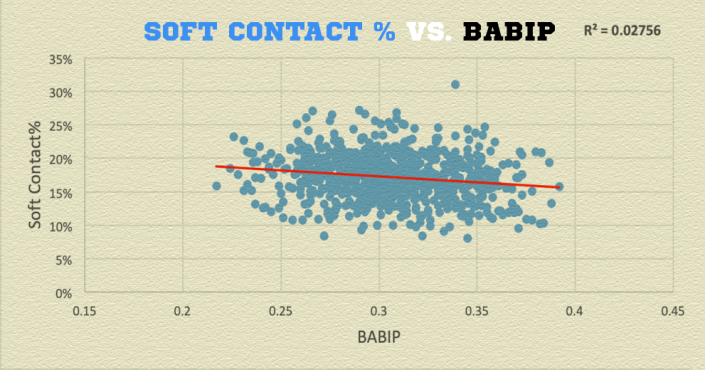
Soft contact, too, barely correlates to BABIP. I could guess as to why: dribblers often are easy outs, and in other instances are extremely difficult plays to make, pulling BABIP in both directions. Thus, soft contact isn’t particularly useful for either batting average or BABIP.
Verdict: quality of contact measurements aren’t useful in explaining batting average or BABIP.
Quality of Contact and Power
Now that we’ve gotten that ugliness out of the way, let’s look at whether quality of contact is correlated to power output. As with batting average, I pulled data for qualified hitters from 2014-2018. I wanted to start by comparing hard contact to a statistic that fantasy owners in every league will be chasing.
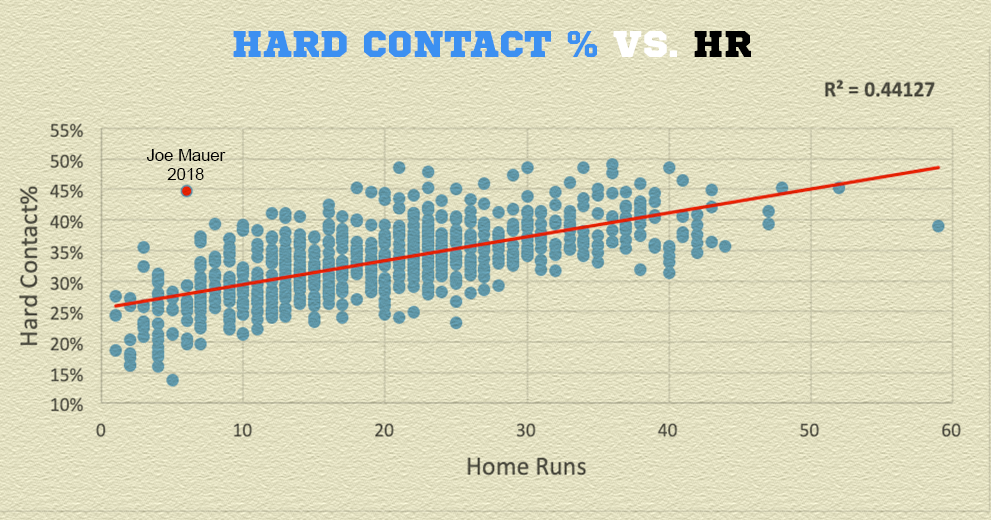
Finally, we see a relatively strong correlation between one of our quality of contact measurements and a fantasy-relevant statistic. In this case, 44.1% of the variance in home runs is explained by changes in hard contact. Intuitively, this makes more sense than comparing hard contact to batting average, which accounts for several different plate appearance outcomes, as opposed to just home runs.
So, now we know that hard contact is significantly more predictive of home runs than batting average. About 56% of the variance in home runs is still unaccounted for, however. But that makes sense, and I’ll explain why using an example. Above, I highlighted Joe Mauer‘s 2018 season in red. The recently-retired Mauer actually hit the ball hard 44.8% of the time in his final season, but he only smacked 6 tates in 127 games. The reason? Mauer hit 22.1% fly balls, good for fifth-fewest in the league, and put the ball on the ground 51% of the time.
Type of batted ball, therefore, accounts for some of the variance in home runs. And there are other factors, too. Age, home ballpark, and strikeout and walk rates, to name a few. Still, hard contact is certainly a useful tool in the context of these other variables to evaluate a hitter’s potential power. This is supported by the fact that hard contact and ISO have an R-squared of 0.49724, and hard contact rate and SLG have an R-squared of 0.38833.
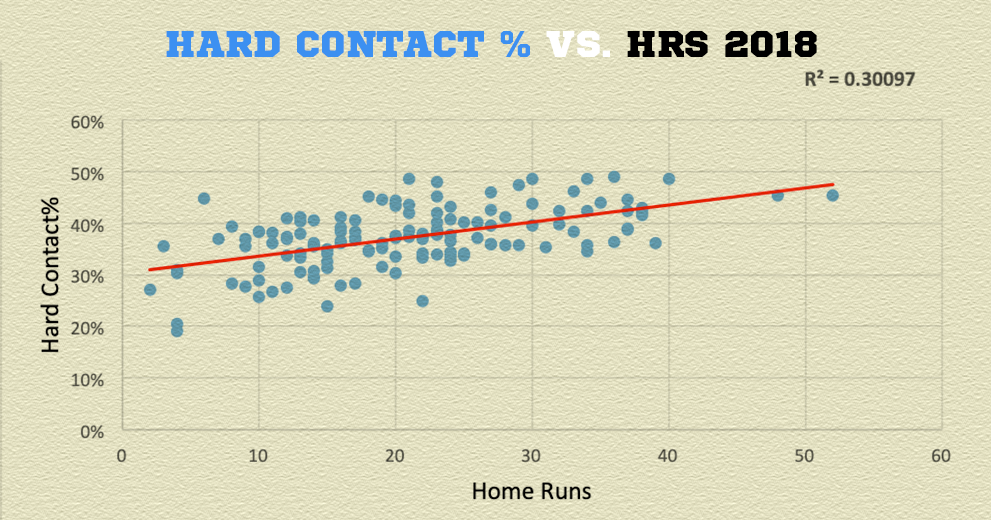
One word of caution. That weird Joe Mauer season is from 2018. As I alluded to earlier, in 2018, hard contact rate shot up across the league, but total home runs and other measures of power (barrels, SLG, and ISO) remained similar to prior seasons. Thus, as represented in this scatterplot, hard contact was actually less predictive of home runs in 2018 than in prior seasons, given the lower R-squared of 0.30097.
This also means that 2018 dragged down the total R-squared for the past five seasons to 0.44127. In fact, between 2014 and 2017, the R-squared for hard contact rate and home runs was 0.51646. Hard contact was, accordingly, nearly as predictive of home runs as BABIP is to batting average! My advice would be to consider hard contact in determining whether a player has “earned” his home runs, but to remain skeptical and look more closely at other variables than in previous years.
Anyway, time for me to get off my soapbox. Does making more soft contact result in fewer home runs, as one would expect?
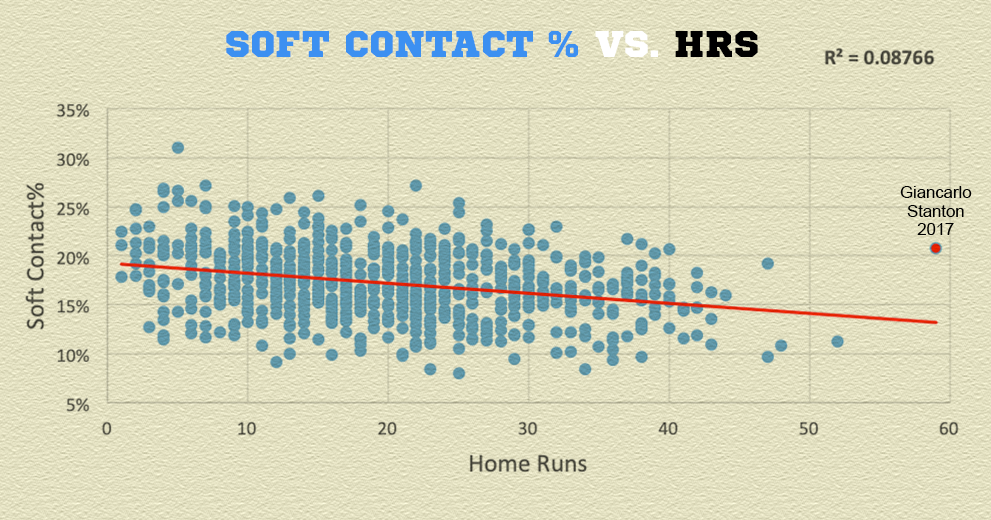
The answer is yes, but only slightly. The R-squared indicates that 8.77% of home run variance can be explained by the amount of soft contact a player makes. The correlation exists, therefore, but it’s weak. This one makes sense though, in that plenty of players make a lot of soft and hard contact, either hitting the ball on the screws or missing slightly for dribblers, which are not mutually exclusive outcomes over the course of a long season.
Consider Giancarlo Stanton‘s 2017 season, highlighted in red above, in which 20.8% of his contact was soft and 38.9% of his contact was hard. He still managed to hit 59 home runs because, even though his soft contact rate was slightly elevated, soft contact only accounted for a fifth of his balls in play, leaving him with 79.2% of his balls in play to hit homers.
Verdict: hard contact is moderately correlated to home runs, but not as much as in prior years.
With all of that said, I’d like to emphasize that, even where useful, quality of contact measurements should be examined in the context of other variables. For instance, if a guy is hitting the ball on the ground 60% of the time, it really doesn’t matter how hard he hits it, he’s not going to hit 40 home runs. Some players fitting this profile include Mauer, as described above, Nomar Mazara (37.5 hard contact%, 55.1 GB%), and Lorenzo Cain (38.3 hard contact%, 54.6 GB%). Sure, their hard contact rates are great, but they won’t be hitting more homers anytime soon with those elevated ground ball rates, and, as we already debunked, hard contact is largely useless otherwise.
In sum, to answer my original question: quality of contact, what is it good for? Well, it’s not absolutely nothing. Hard contact, and, to a much lesser degree, soft contact, can be useful in predicting a player’s power.
The lack of correlation between hard contract and BABIP is striking. I don’t know why people still use those figures when we have exit velo and xwOBA.
One thing that would be interesting to look into is hard contact v BABIP with speed contextualized. I suspect that a lot of speed guys get on base via infield singles on soft contact. If you isolate to slow or medium speed runners you might see more of a correlation.
It’s certainly possible that eliminating variables such as speed will make quality of contact stats more predictive. Might make for a nice follow up article!
I’d suggest shying away from exit velo because it doesn’t really tell us what we think it does. If I have 3 batted balls, one at 100 mph, 1 at 95 mph, and 1 at 50 mph, my average EV is about 82mph, which doesn’t really explain the context of the batted balls. What we really want to know is closer to what barrels tells us: how often is the player in the optimal zone of EV and LA.
While barrels are a better stat than exit velocity in explaining overall production, I don’t think they’re necessarily better at explaining BABIP since barrels often end up as home runs (not included in the BABIP) or fly outs (negative to BABIP).
Once the sample is sufficiently large (probably over month of batted balls) the issues described with exit velocity subside and it becomes a great indicator of a player’s hit tool and BABIP ability.
Launch angle should explain more
Looks like I should be looking at Barrels per BBE if I’m trying to evaluate power. https://www.fangraphs.com/fantasy/which-statcast-measures-correlate-best-with-power-metrics/
Pro tip – try using HR or XBH!
It is easy to understand why hard% isn’t worth much on its own merits. Dead pull and Ks go hand in hand with swinging recklessly, which is the best way to generate EV, but that doesn’t lead to much BABIP success. It is what I call an HR derby approach. A truly talented hitter might not have to sell out to get balls into the hard bin regularly, but there is a generation of players that are simply selling out to do it and it has become more tolerated and even encouraged. As we begin to worship hard% and its derivatives more, we encourage players to swing out of their asses, which creates more bad launch angles and whiffs. The good kind of hard% needs to come with ability to make consistent contact and great hitters are going to be able to do that over a wider horizontal angle. The less power you have the more you have to sell out and hit balls towards the line – see any HS showcase HR derby for a great example of what kids trying to generate elite EV look like. Its swing hard just in case you hit it.
Another issue is the integrity of the data. When you cite the increase, think about what it is based on? At what point is the historic data trash? At what point will this data be regarded as shaky? You name the metric and it has had huge problems over time, which we only accept after a certain amount of time has passed. I have been around the world of baseball metrics long enough to see them all die. None of us can audit the data, but I am sure that we will be told what changed and what was wrong at some point – of course it will be branded as an improvement rather than an acknowledgement of what was wrong… which is kind of a huge problem in my eyes as this is at least partially just a giant promotion for Amazon Web Services as we saw throughout the playoffs in particular. The more the information is behind a wall, the more it can be manipulated which is in all of the money-maker’s interests. I am just pointing you that we don’t have any meaningful baselines.
BABIP seems like it would be a very poor way of looking at how hard contact correlates to balls in play. BABIP by definition excludes home runs and home runs by definition are balls that are hit with hard contact. What you conclusion of comparing hard contact to BABIP states is that hard contact doesn’t correlate with balls hit in play that aren’t home runs. It would be interesting to see how the data looks when adding in home runs. I suspect it would not change the overall findings much but would be a more accurate representation of the correlation between hard contact and what happens when the ball goes fair
Would it create more of a correlation if you isolated players with similar batted ball stats? For example, if you only took players with a GB% from 50%-55%.