


The 2019 season is flying by, isn’t it? We just dashed past the quarter way point and are quickly approaching the one-third mark.
At this juncture, analysts typically begin to shift their gaze to macro-level statistics such as ERA, FIP, and wOBA to rank pitchers. Unfortunately, these stats require a significantly greater sample than 10 starts to become robust measures of performance.
The reasons? Batted-ball luck, home run luck, and team fielding—three variables that tend to significantly skew statistical outcomes in small sample sizes.
Fortunately, we can use Baseball Savant’s xwOBA statistic to address these issues. In addition to considering a pitcher’s strikeouts and walks, xwOBA utilizes batted-ball exit velocity and launch angle to describe how many and what type of hits the pitcher should have given up. This provides a more objective view of pitcher performance and neutralizes batted-ball luck, home-run luck, and team fielding from the equation.
Comparing the difference between a pitcher’s xwOBA and wOBA will give an indication of how lucky or unlucky they have been on the season. Those with higher differentials have likely been hurt by bad luck and are prime candidates to regress positively, while those with low differentials have been lucky and could regress negatively.
Some Context
Before delving into xwOBA to wOBA differentials, it’s important to showcase why xwOBA is a superior statistic than wOBA for short-term player evaluation.
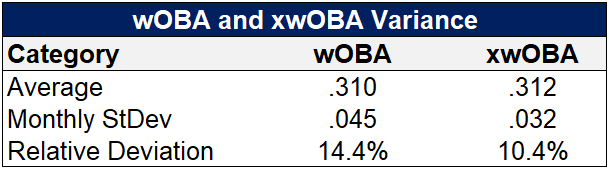
I surveyed 135 starters who threw at least 300 pitches in a minimum of three separate months in 2018. I then tracked how their wOBA and xwOBA varied by month. In the case of wOBA, the average monthly standard deviation was .045, or a relative 14.4%. The relative deviation for xwOBA was significantly lower at 10.4%.
Another way to view these figures is that wOBA exhibits 39% more random variance than xwOBA (14.4% – 10.4% / 10.4%) on a monthly basis. This substantial difference accounts for the cumulative effects of various forms of batted ball luck as well as fielding.
Because wOBA varies significantly more than xwOBA, the latter is a much better indicator of true short-term pitcher performance than the former.
The Lucky Ones
Let’s start with those who have been on the right side of lady luck. The following starters place in the top 10 in wOBA minus xwOBA differential:
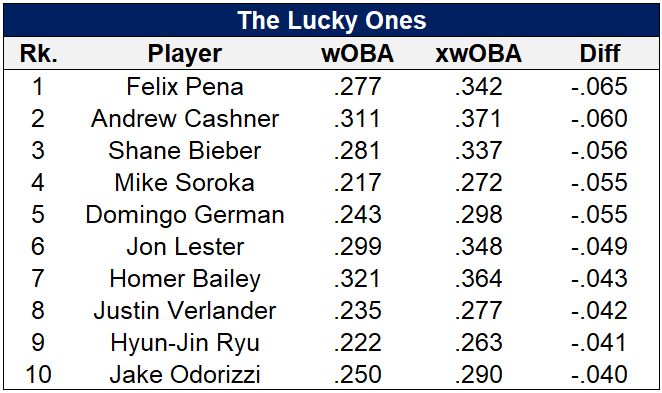
Felix Pena of the Angels paces the list with a wOBA reading that tracks a massive 65 points below his xwOBA of .342. Pena’s ownership percentages are still below 10% in most fantasy leagues; however, his name has started appearing on some waiver wire pick up articles because of a 3.30 ERA and 4.4 K/BB ratio. While Pena has made some positive developments in pitch strategy by throwing his dominant slider more than 40% of the time, it hasn’t been enough to stop hitters from earning an 8.1% barrel rate and .473 xSLG. The principal reason behind Pena’s strong ERA and wOBA readings is a .227 BABIP that doesn’t align with a hard-hit rate in the 12th percentile of pitchers and a xBA in the 26th. Steer clear.
Few fantasy managers have much interest in the Orioles’ Andrew Cashner, so let’s skip along to the third-place Shane Bieber of the Cleveland Indians. Bieber owners are surely impressed with his 3.22 ERA/3.71 FIP/3.42 xFIP line to go along with a 29.4% strikeout rate. Yet enterprising managers should probably look to trade him while the getting is good because of a 56-point wOBA outperformance. Bieber is much the same pitcher he was in 2018—one who displays good control and strikeout upside but is extremely hittable. Bieber’s xSLG on contact is the third-worst in baseball this season at a gratuitous .711. Despite this, Bieber’s batting average against of .209 tracks well below his xBA of .254. Bieber will start surrendering significantly more hits soon, which will increase his ERA and WHIP while making it more difficult to rack up strikeouts by pitching more out of the stretch.
The inclusion of names like Mike Soroka and Domingo German shows that a pitcher can be both lucky and good at the same time. While both pitchers are outperforming their xwOBA by 55 points, they each still possess an overall xwOBA below .300, a very impressive feat. Soroka and German owners should feel confident holding their young righties going forward but should be prepared for some hiccups along the way.
History does repeat itself. Halfway through 2018, the Cubs’ Jon Lester owned a sparkling 2.28 ERA, but he didn’t have the peripherals to support it. Sure enough, from July 20 onward, Lester pitched to a mediocre 4.50 showing, an unacceptable fantasy performance for a pitcher with a middling strikeout rate. Now, Lester seems to be pulling a similar strick in 2019, with a 2.09 ERA and .299 wOBA set against a 3.64 xFIP and .348 xwOBA. Trade him while you still have the chance.
Like Soroka and German, no one should be rushing out to trade Justin Verlander or Hyun-Jin Ryu. Ryu’s .263 xwOBA is sixth among starters, while Verlander’s .277 mark is 14th.
However, Jake Odorizzi owners have something to think about. While his overall .290 xwOBA is still very good, his 40-point wOBA overperformance combined with a very consistently mediocre resume calls into the question the sustainability of his hot start. Odorizzi’s pitch mix is identical to previous years, with the two biggest changes in his repertoire being an additional 1.4 mph in velocity on his four-seamer and more called strikes. While the former is a real improvement, especially for such a fastball-heavy pitcher, the latter seems to be the result of his zone-swing rate declining from the 70% range to 62%. I wouldn’t bet on that continuing.
The Unlucky Bunch
Now that that’s out of the way, how about we explore the pitchers who might be due for some positive regression in the coming weeks and months?
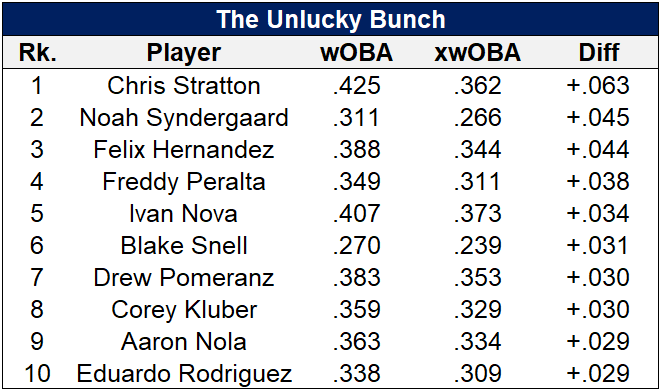
Chris Stratton has had a rough start but probably isn’t deserving of an obscene 7.96 ERA accumulated in starts for both the Angels and Pirates. But unless you’re in a 20-team NL-only or worst-ball format, you likely have no interest in Stratton, so let’s move on.
Of the pitchers with real fantasy interest, none have been unluckier in 2019 than Mets fireballer Noah Syndergaard. Despite a .266 xwOBA that ranks seventh among starters, Syndergaard owns an unsightly 4.50 ERA. The biggest culprit is a 13.1% HR/FB ratio that ranks well above Noah’s career average. Moreover, while Syndergaard’s .314 BABIP is identical to his career average, his .215 xBA indicates that some of those singles should be turning into outs in short order. Unfortunately for Syndergaard, the Mets’ team defense is one of the worst in baseball. Additionally, as Nick Pollack argued last year, certain facets of Syndergaard’s approach make him susceptible to inflated BABIPs. However, a positive 45-point wOBA to xwOBA differential isn’t sustainable. Syndergaard should begin giving up fewer hits and home runs in short order.
The halcyon days are far in the rearview mirror for Mariners hurler Felix Hernandez at this juncture, who has been both bad and unlucky this year. However, things are just getting started for young Brewers righty Freddy Peralta, who struggled to start the year and was recently relegated to a bullpen role. Peralta’s .349 wOBA and 5.79 ERA are overstated because of a .326 BABIP and 15.9% HR/FB ratio that both rank above expected levels. Peralta could become a dynamite option out of the bullpen with a couple of extra ticks of velocity on his fastball and the benefit of opposing hitters viewing his limited arsenal only once. Managers in saves + holds leagues should track his progress.
Blake Snell has been pitching as a man possessed over the past 12 calendar months. And despite an “elevated” 3.31 ERA on the season, Snell has only gotten better this year, increasing his strikeout rate to an alien 37.8%. His .239 xwOBA is the third-best in baseball and 31 points below his .270 wOBA, indicating that Snell has gotten a bit unlucky on balls in play.
Phillies ace Aaron Nola has had a rough start to 2019 with a 4.53 ERA and .363 wOBA. The biggest factors behind the turbulence of Nola’s season are a .362 BABIP and 19.6% HR/FB ratio that track significantly higher than the respective .251 and 10.6% marks he posted in 2018. Nola’s 29-point wOBA underperformance highlight that his 2019 readings should converge toward his career levels. Arrows are pointing up recently, as Nola hasn’t allowed more than three earned runs in seven starts since April 20. Nola owners shouldn’t expect a repeat of 2018’s 2.37 ERA, but something in the low 3’s going forward seems reasonable.
Boston lefty Eduardo Rodriguez represents arguably the best buy-low pitcher in baseball. Coming off giving up 11 earned runs over his past two starts, Rodriguez’s ERA currently sits at 5.43. However, nearly every peripheral indicator, from xwOBA to FIP and xFIP, suggests that greener pastures lie ahead for Rodriguez. His 2019 BABIP sits at .355 despite Rodriguez ranking in the 90th percentile in hard-hit rate. Buy now if you can.
Featured Image by Justin Paradis (@freshmeatcomm on Twitter)
So … you’re saying Nick’s ROS ranking of Bieber is No. 20 is way too optimistic?
Where does Montas and Wheeler fall in the lucky/unlucky bunch?