


When I was young, I loved the radio. It was my lifeline, my musical escape. I lived in a small rural township outside of Cleveland, Ohio, that had more cows than people and only two stoplights, so to say the reception was sometimes spotty is being kind. But, we got three major stations that came in loud and clear. The first was a soft rock station (104.1!), a classic rock station (100.7 WMMS THE BUZZARD!) and 107.9, which was a smooth jazz station.
I’ve always loved Rock ‘n’ Roll, but somehow the station I listened to the most was the smooth jazz station (yeah, I was the cool kid in school growing up). One of the mainstays of this station was Kenny Rogers. If you listened for at least an hour, you’d likely hear at least one early-career Rogers song from the time he started out as a jazz musician. None of it blew me away or ever stood out from the crowd, but Rogers’ jazz work was always dependable and a solid listen when you needed it.
Then one day I turned on the classic rock station and heard Just Dropped In (To See What Condition My Condition Was In) from Kenny Rogers’ time with First Edition, and 12-year-old me was blown away (this is ironic since Rogers was mostly known for his rock and country work at the time). Suddenly I was seeing Rogers in a whole new light. He was a completely different (and cooler) musician in my eyes from there on out.
As a lifelong Indians fan, Michael Brantley was my baseball equivalent of Rogers. For the nine years he played for The Tribe, I never once worried about his production or ability. Sure injuries hampered his time in Cleveland, but I never thought, What if Brantley didn’t hit .300 with 15+ HR and 15+ SB while being the rock at the heart of the lineup? For nearly a decade he was the motor that drove my favorite lineups, and so much of it was centered in his eternal reliability. His swing never once lost its smooth, easy grace (hence his nickname, Dr. Smooth), and his attitude never showed any sign of pressure or that the moment got to him. He simply would come to bat and deliver exactly whatever the team needed at that moment. It was as sure a thing as death, taxes, or Cleveland getting snow in June.
I assumed Brantley would never change. Lots of line drives and seeing-eye singles with few strikeouts; rinse and repeat all the way to retirement. Then Brantley signed with the Astros in 2019, and everything I knew about him changed. Suddenly he looked like a slugger as well as an unflappable contact hitter. My whole world has been turned upside down, and I have a confession to make it: I’ve loved every single moment of it so far.
Before we dive into the changes Brantley has made in 2019, I want to try to establish just how reliable he was as a hitter. Check out this year-to-year consistency over the last half-decade:
| Year | PA | AVG | R | RBI | HR | SB | K% | BB% | LD% | GB% | FB% | ISO | wOBA | OPS | Primary Batting Spot |
| 2014 | 676 | .327 | 94 | 97 | 20 | 16 | 8.3% | 7.7% | 25.7% | 46.1% | 28.2% | .178 | .389 | .890 | 3rd |
| 2015 | 596 | .310 | 68 | 84 | 15 | 14 | 8.6% | 10.1% | 22.5% | 45.8% | 31.7% | .170 | .368 | .859 | 3rd |
| 2017 | 375 | .299 | 47 | 52 | 9 | 11 | 13.3% | 8.3% | 22.3% | 49.3% | 28.4% | .145 | .342 | .801 | 3rd |
| 2018 | 631 | .309 | 89 | 76 | 17 | 12 | 9.5% | 7.6% | 24.7% | 45.0% | 30.3% | .160 | .359 | .832 | 2nd |
It’s worth noting that 2016 saw Brantley only register a mere 11 games hence why I skipped it, and he missed much of 2017 with complications due to the same injuries, but over that 375 PA he was earning himself an All-Star appearance in the first half before missing the rest of the year due to a biceps injury. Look at that consistency, though. That surety. For better or worse, Brantley was what Brantley was. One of the best pure hitters in the league but one who flew in the face of the modern hitter and the three true outcomes they love.
This is not the case in 2019. Suddenly Brantley is slugging the ball like a true disciple of the fly ball revolution and he’s become a completely different hitter. Here are his 2019 stats so far and his prorated stats underneath it:
| Year | PA | AVG | HR | R | RBI | SB |
| 2019 So Far | 211 | .328 | 10 | 29 | 34 | 3 |
| 2019 Prorated | 684 | .328 | 32 | 93 | 110 | 10 |
Is that 30+ HRs? For Michael Brantley? Your eyes are not deceiving you, it’s a brave new world for Brantley owners. Of course, the first question is how legit is this, right? Non-power hitters get hot all the time and go on streaks where they hit enough dingers over a short stretch to maybe bump their total home runs 3-5 HRs over the career norm but we’re talking about 12 HRs here. If it’s legit the only way it would be possible is with a significant change in approach that explains the power outburst. It’s not just the home runs for Brantley either. He’s currently on pace to hit 40+ doubles as well. We’re talking 70+ extra base hits which is upper echelon power to go along with hitting fourth in the most stacked lineup in baseball which gives him a legit shot at 100+ RBIs. Considering he has Carlos Correa, Yuli Gurriel and Josh Reddick hitting behind him he might end up having a chance at 100+ Runs as well. When you pair it with a .300+ AVG and 10 SB we’re talking top-10 hitter in fantasy.
So how do we figure out if there’s been a change in approach? I like to start with a player’s batted ball data. We’ve gotten to a place in the season where we can be pretty sure that if anything stands out as unusual in a player’s batted ball data that it is either deliberate or at the very least much less clouded by the white noise of the random number generators. Here are Brantley’s batted ball numbers for this year and the two years prior.
| Year | LD% | GB% | FB% | HR/FB% |
| 2017 | 22.3% | 49.3% | 28.4% | 10.8% |
| 2018 | 24.7% | 45.0% | 30.4% | 10.9% |
| 2019 | 21.8% | 43.7% | 34.5% | 16.7% |
A 4.0% increase in FB% is absolutely significant. If you want to think of it this way, Brantley put 515 balls in play last season over 631 PAs, 156 of which were flyballs. If he had hit FBs at a 34.5 FB% like he is this year that number would have been closer to 178 FBs. Even at last year’s 10.9 HR/FB% that would have added 2 home runs to his total last year. At the elite 16.7% he is hitting this year? We’re talking 12 more HRs to put his total up to 29 hypothetical HRs.
But wait, there’s more. Brantley is currently on pace for about 50 more ABs than last year. So far in 2019, he has put 174 balls in play with 60 of them being in the air. By the way for those of you scoring at home, Brantley has 10 HRs to go along with 14 doubles. In other words, 40.0% of his flyballs this season are going for extra base hits. That’s an insane level of production. This puts Brantley on pace for 564 balls in play which at his current pace would mean about 195 fly balls. At a 16.7 HR/FB% we’re talking about at least 32 HRs.
So we can confirm his batted ball profile supports the prorated HR totals. Here’s the thing. For his entire career, Brantley has basically been a hitting cyborg sent from the future to show us how puny it is that we can’t repeat our swings. He’s so famous for his easy, repeatable, perfect swing, that it earned him the nickname Dr. Smooth during his time in the 216 (That and I secretly suspect he was the midnight DJ on that Smooth Jazz station back in Cleveland but I can’t prove that.) Look at that chart above. All those lines are practically one line they’re all so consistent with each other. If Brantley is deviating from that profile, it has to be deliberate. That’s pretty compelling evidence and we’re just getting started.
There’s one other thing worth noting in Brantley’s batted ball profile and that is his batted ball direction and spray charts. Check this out:
| Year | Pull% | Cent% | Oppo% |
| 2015 | 42.7% | 32.7% | 24.6% |
| 2017 | 39.7% | 34.9% | 25.3% |
| 2018 | 40.4% | 36.8% | 22.8% |
| 2019 | 40.9% | 31.3% | 27.8% |
Note that we skipped 2016 as he missed pretty much the entire year. As to be expected Mr. Consistency pretty much just rinse and repeated his all fields approach each and every year until this year. Notice the huge bump in Oppo% and big drop in Cent%? I firmly believe this is a result of an approach change by Brantley designed to increase his power output. To see what I’m talking about let’s look at Brantley’s spray charts (courtesy of Baseball Savant) for the last few years. Pay close attention to the distribution of the yellow and maroon dots as they represent the locations of his doubles and home runs in that year. Here’s 2017:
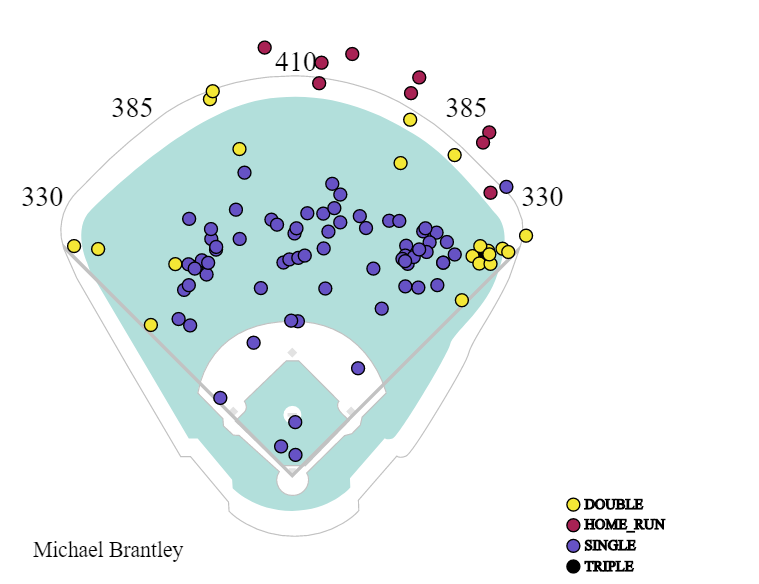
And 2018:
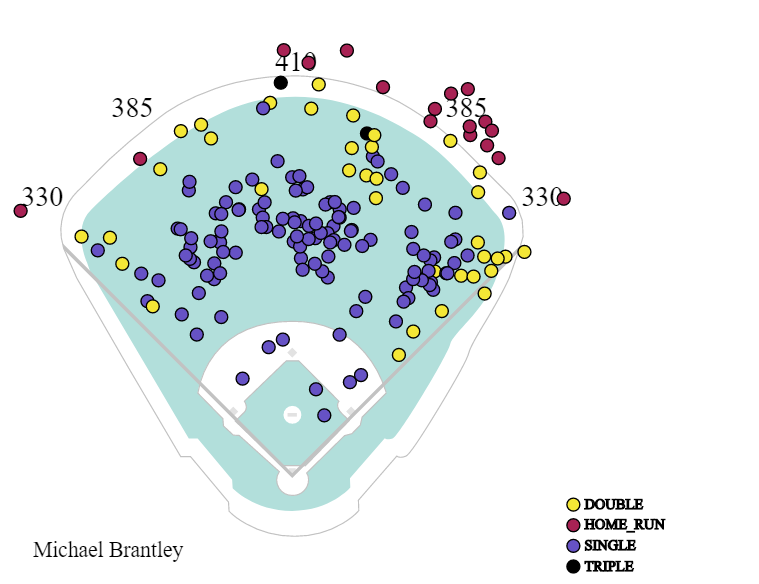
and finally 2019:
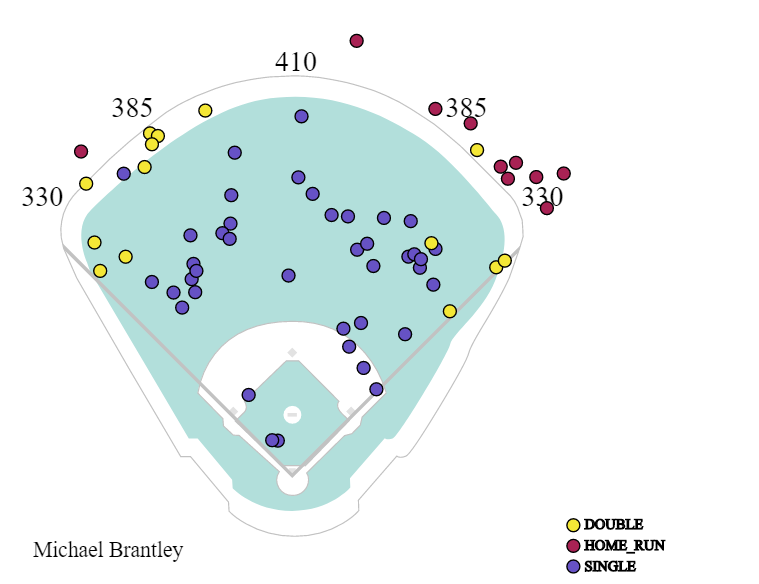
Do you see the trend? Going back to 2017, very few of his extra-base hits are hit to the middle of the field. Back in a Jake Bauers piece I wrote during the preseason I noted that a big piece of the Indians hitting philosophy was that the shortest distance to the wall was down the foul lines and so you should hit it that way. While Dr. Smooth is no longer with the Indians (*sob*) the thought process holds true no matter which team he plays for and it’s clear Brantley does his best power hitting when he is either pulling the ball or hitting it the opposite way so it makes perfect sense that he would increase his Oppo% in an attempt to increase his power. As a lefty, you can see that most of his home runs come when he pulls the ball but so far in 2019 most of his doubles have come at the wall when he goes the other way. Again given that Brantley’s approach has pretty much been my favorite song (Dire Strait’s On Every Street, in case you were wondering) on repeat over and over, I have to believe that this increased Oppo% is a deliberate change in approach.
Let’s also look at the Statcast data as I feel like it will give us the final piece of evidence that we need to confirm that this is a bright new future for Brantley. Mainly I want to focus on three statistics, Launch Angle, BBL% and xEPH (this one is my own stat and nothing official, we’ll get there in a moment). Let’s talk Launch Angle first. Here’s Brantley’s Average Launch Angle history, again skipping 2016:
| Year | Average Launch Angle |
| 2015 | 8.8 |
| 2017 | 9.7 |
| 2018 | 9.5 |
| 2019 | 10.5 |
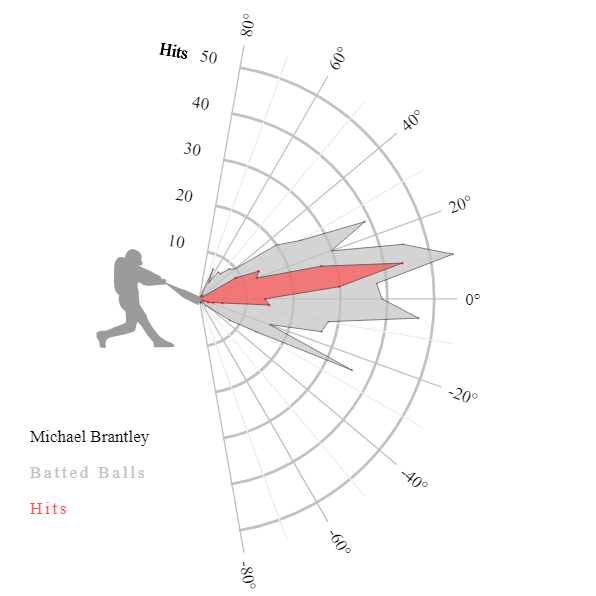
First, we see a definite increase in launch angle which tells us that Brantley is hitting more balls in the air at a greater angle, but we already knew that. Also, a single degree of added launch angle certainly doesn’t seem like enough to explain the HR increase, especially when you consider that his average exit velocity didn’t change at all from 2018. This is more an issue with Average Launch Angle honestly. Mean (or average) statistics are the bread and butter of basic statistics but they can be misleading. A mean statistic (how come there are no nice statistics?) can be radically affected or pulled in certain, misleading directions by extreme data on either far end of the data range (outliers). I want to show you what I mean visually. The following images from Baseball Savant show the distribution of the launch angles for all of Brantley’s hits and batted balls in a given year. Please note that the further out a spike goes the more hits the player had at that launch angle. Here’s his chart from 2017:
See how his largest spike in batted balls sits at 0 degrees and 10 degrees for hits? Let’s look at 2018 next:
That’s a huge difference, right? We see the biggest spike in batted ball launch angles at around 15 degrees with additional large spikes at around 25, -5 and -25 degrees as well. His hits on the other hand pretty much sit right at 10 degrees with smaller spikes at -2.5 and 25 degrees. Yet his 2017 and 2018 Average Launch Angles were nearly identical thanks to the much more extreme outliers in the data set. The truly fascinating chart though is his 2019 launch angle distribution:
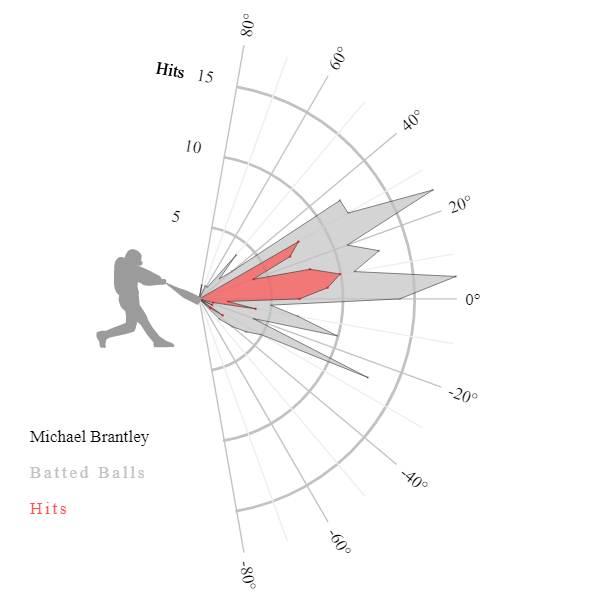
While there was only a one-degree increase in Average Launch Angle this is a radically different launch angle distribution from the year before. The largest batted ball spikes sit at 5 degrees and 25 degrees with smaller but significant spikes sitting at 35, 15, 0, -15 and -25 degrees. Sure the negative spikes aren’t great but that’s not unusual for a power hitter or a hitter trying to hit the ball in the air as when you miss lifting a ball you can have a tendency to pound the ball into the ground more often than with a level swing.
The fascinating part is where the spikes lie for his hits in 2019. Note that since we’re looking at only part of a season the red spikes are smaller simply because he hasn’t had the ABs yet to rack up 15+ hits at any launch angle yet. The largest spike still sits at 10 degrees but we are also seeing significant spikes at 0, 5, 15, 25 and 30 degrees! Very few of his hits are coming on balls with less than a 0-degree launch angle. This is incredibly significant. For most of his career, Brantley was just like this older guy I play with on my beer league softball team. He never really hits for power or beats you by sheer force but he is one of the best hitters on our team. He succeeds through cunning and guile and as he loves to say “By hittin’ it where they ain’t.” He lives off of soft line drives that fall into no man’s land in the outfield and sharply hit ground balls between the infielders.
This was how Brantley was. He was the king of the seeing-eye single. Note how few of his hits here come with a less than zero degrees launch angle. In fact, only 12 of his 64 hits this season have had a launch angle less than zero and two of them were bunts. On the other hand, 37 of his hits have come with a launch angle greater than 10 so far this season. The power is for real. He’s hitting the ball in the air more than ever and finding more success. I don’t see him stopping anytime soon.
One place where we’ve seen this increased launch have a huge effect is in Brantley’s BBL% rate. Here is his BBL% history during the Statcast era:
| Year | BBL% |
| 2015 | 3.9% |
| 2017 | 4.1% |
| 2018 | 3.7% |
| 2019 | 6.8% |
His BBL% practically doubled this year. For reference, it’s handy to check out MLB.com’s definition of a barreled ball as it can be a bit confusing. Of Brantley’s 3,597 career balls in play prior to 2019, 401 of them (11.1%) had the required 98 MPH exit velocity to qualify them as barreled balls, so how come his career BBL% is so low? Because only 50 (12.4%) of them had the required launch angle to qualify as a barreled ball. Are things different in 2019? Of Brantley’s 176 batted balls in 2019, 57 of them (32.3%) had the required exit velocity to qualify as a barrel. Combine that with the greater quantity of increased launch angles and you can understand why his BBL% has nearly doubled.
The last thing I want to talk about is a stat that I’ve been using lately that I call Expected Elite Power Hits, or xEPH. It’s not a complicated stat, all it measures is the number of batted balls that a player hits that have an expected ISO (xISO) of at least .200 as this is considered to be an elite power hit. In a way it’s meant to act for power hits, in the same manner, BABIP or BaCON does for hitting in general. If a player hits a ball that would normally be in the gap but Billy Hamilton rushes in and makes a spectacular play or Lorenzo Cain robs a sure home run ball at the fence than we shouldn’t count that batted ball against them.
If a player has more xEPH than he does extra-base hits (and often times barrels) than I have a rough idea there might be even more potential for extra-base hits. So let’s take a look at Brantley’s xEPH, xEPH%, Barrels (BBL) and extra-base hits (XBH) and what percent of his batted balls were extra-base hits (XBH%) to see if there’s anything in the data of note (I’ve also prorated the 2019 numbers to 684 PA like earlier and included it as well).
| Year | xEPH | xEPH% | BBL | BBL% | XBH | XBH% |
| 2015 | 86 | 17.8% | 19 | 3.9% | 60 | 12.4% |
| 2017 | 50 | 17.1% | 12 | 4.1% | 29 | 9.9% |
| 2018 | 99 | 19.1% | 19 | 3.7% | 53 | 10.3% |
| 2019 | 34 | 19.3% | 12 | 6.8% | 24 | 13.6% |
| 2019 Prorated | 110 | 19.3% | 39 | 6.8% | 78 | 13.6% |
It’s worth noting that since xISO doesn’t take into account where the ball was hit it’s incredibly rare for a player to match his extra-base hits to his xEPH (at least from what I’ve been able to find so far). A ball hit with the xISO potential of .200 could be hit right at a fielder for an out and it still counts toward xEPH while obviously not counting as an extra-base hit. Such is baseball.
It’s also worth noting that while there is only a small increase in the xEPH%, BBL% skyrockets to go along with the increased launch angle and XBH% moves closer to matching xEPH% by 3.3%. I suspect a good chunk of this is due to the increase in barreled balls but I also think another force is also at work. Here’s a really fascinating article by Andrew Fox over at the Fangraphs Community that lays out the dimensions of each and every MLB outfield and check this out. I’ve added in the fence distances as well for the park so you get a rough idea of park size as well. The OF size dimensions are in terms of 1,000 square feet.
| Park | LF | LF Wall | CF | CF Wall | RF | RF Wall | Overall Size |
| CLE | 25.8 | 325′ | 33.2 | 405′ | 33.2 | 325′ | 85.6 |
| HOU | 23.2 | 315′ | 38.8 | 435′ | 26.6 | 326′ | 88.6 |
It seems pretty clear to me there’s a really good reason all those extra fly balls are finding more grass. That outfield is huge! We’re talking nearly 2,000 square feet more real estate out there in Minute Maid Park’s outfield. Now you might be thinking Daniel, I thought Brantley was hitting the ball to CF this season. You’re absolutely correct. Hang in there with me as I show you one last thing. Here is the average positioning for fielders in Progressive Field in 2018:

Now for Houston in 2019:
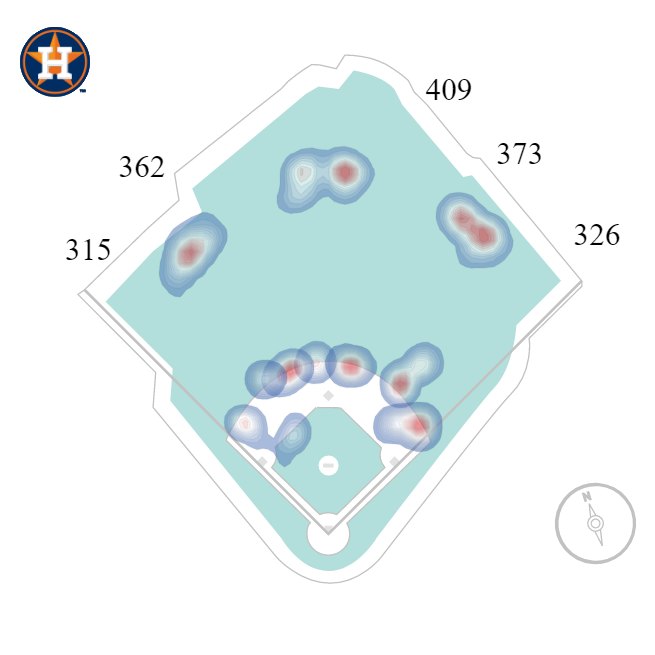
So the main thing I want you to notice is see how large the radius is for the left and right fielders in Minute Maid Park compared to Progressive Field. That’s because there is just so much more ground to cover. That’s the effect of that extra 2,000 square feet. Brantley has hit six doubles and six home runs at home already and here are the locations of those hits:
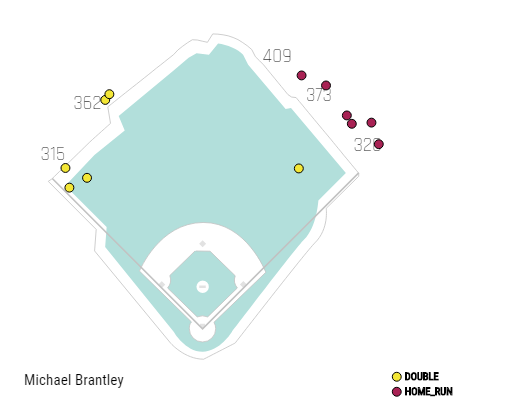
Notice how all those yellow dots seem to be in the gaps opened up much larger outfield and overall dimensions of Minute Maid Park. Now I understand that Brantley hasn’t only played at home but it certainly seems like his home park has had a huge effect on how effective those additional fly balls have been. In fact, this is purely speculation but it feels so deliberate and perfect that I suspect that this might be a large part of what inspired Brantley to make the change in the first place.
So far in 2019, Brantley has been a completely different hitter than the guy we’ve know for the last ten years and it has been an exciting and fun experience watching him transform himself into a slugger extraordinaire. Is there regression coming? Possibly, but I suspect not much if any. Is this a fluke or random noise? I feel like we have gone through enough of the evidence in this article to believe that this is no fluke but a deliberate choice by one of the best pure hitters in the game and it has created a monster.
Take a look again at the prorated numbers I posted at the beginning of this article. That’s an MVP-caliber player and if Brantley is able to sustain what he is doing (and I suspect he will) he will absolutely be in the MVP discussion. As for us fantasy owners? I predict that this time next year we’ll be talking about Brantley as a player that should be drafted in the top three rounds, if not the first round.
Featured Image by Justin Paradis (@freshmeatcomm on Twitter)
The article feels like it’s written for me. Massive Cleveland fan and loved Brantley ever since he was a PTBNL in the CC trade. That was back when I first started doing sports deep dives and found an article before he was PTBNL about potential targets and he is who I was hoping for!
The one silver lining that he’s no longer with the tribe is that he’s on my fantasy team. Dr Smooth made so much sense in a points league.
A couple additions about consistency. He had .170, .178, .145, and .160 ISO numbers those seasons.
What’s the difference in calculation between hard hit % for FG and Statcast? Thought maybe career high FG hard hit was a factor but it’s below career avg at Statcast
Also interestingly, he’s chasing more but his OContact is up and whiff/SW strike are near/at career lows
Dr Smooth is just adding new instruments
I’m so glad you liked it! Always good to meet another Cleveland fan. Absolutely. He’s always been an unsung stud in points leagues for sure!
In terms of Hard Hit % I honestly can say what the difference because Fangraphs can’t release the formula from the company that gives them that data https://library.fangraphs.com/offense/quality-of-contact-stats/
my guess is that Fangraphs says they don’t take Exit Velocity into consideration whereas Statcast only bases it on have 95+ MPH Exit Velocity.
That is super interesting, yeah exactly he can now play any part in the band!
Great deep dive. Are those numbers really in the MVP conversation this year in this environment with the juiced ball? How many players are currently on 40+ HR pacer I wonder.
Thanks so much, I’m glad you liked it! I think it has to be. Not saying he should win MVP but I think he has to be in the conversation. Lots of players are gonna hit 40+ HR but they probably aren’t going to do so while hitting over .300 with 40 doubles and whatnot. I was mostly just kinda basing it off Jose Ramirez and Francisco Lindor getting MVP votes last year with similar numbers if you substituted AVG for stolen bases and whatnot.