


Matt Olson was a first-round pick by the Oakland Athletics, and in his initial trip to the big leagues in 2016, he struggled mightily, posting an OPS of .464. The A’s then decided to bring him back up the following season, and the results were completely different. The hulking left-hander slugged his way to a 1.003 OPS, including 24 home runs over 59 games. That put him on pace for roughly 66 home runs over 162 games. For production like that, it seemed that Olson had finally put that brief, yet terrible, appearance to bed a year earlier, making himself one of the brightest young players in the sport. As 2018 rolled around, he shouldered all those expectations to produce at least 40 home runs, and he wasn’t particularly close. Olson hit 29 home runs and was not the force many had expected. His xwOBA had dropped from .388 in 2017 to .355 in 2018, and he was barreling up far fewer pitches. Was his 2017 a fluke? This made his 2019 season a make-or-break year in the eyes of the fans—you wanted to know who the real Olson was. He’s easily answered those questions, posting the 11th-highest xwOBA among hitters with at least 100 plate appearances. The question is, how did he do it?
Back Where It All Begins
In 2017, Olson pulled the ball nearly 50% of the time, had roughly 10 percent barrels per plate appearance, and an xwOBA of about .400. It all regressed for him the following season, as he pulled the ball just over 40% of the time, good for about 8 percent barrels per plate appearance, and an xwOBA of about .350. This was a significant drop in production.
There were two noticeable trends from his 2018 season that are worthy of discussion. The first is his numbers against four-seamers.
| FA xwOBA | |
| 2017 | .414 |
| 2018 | .331 |
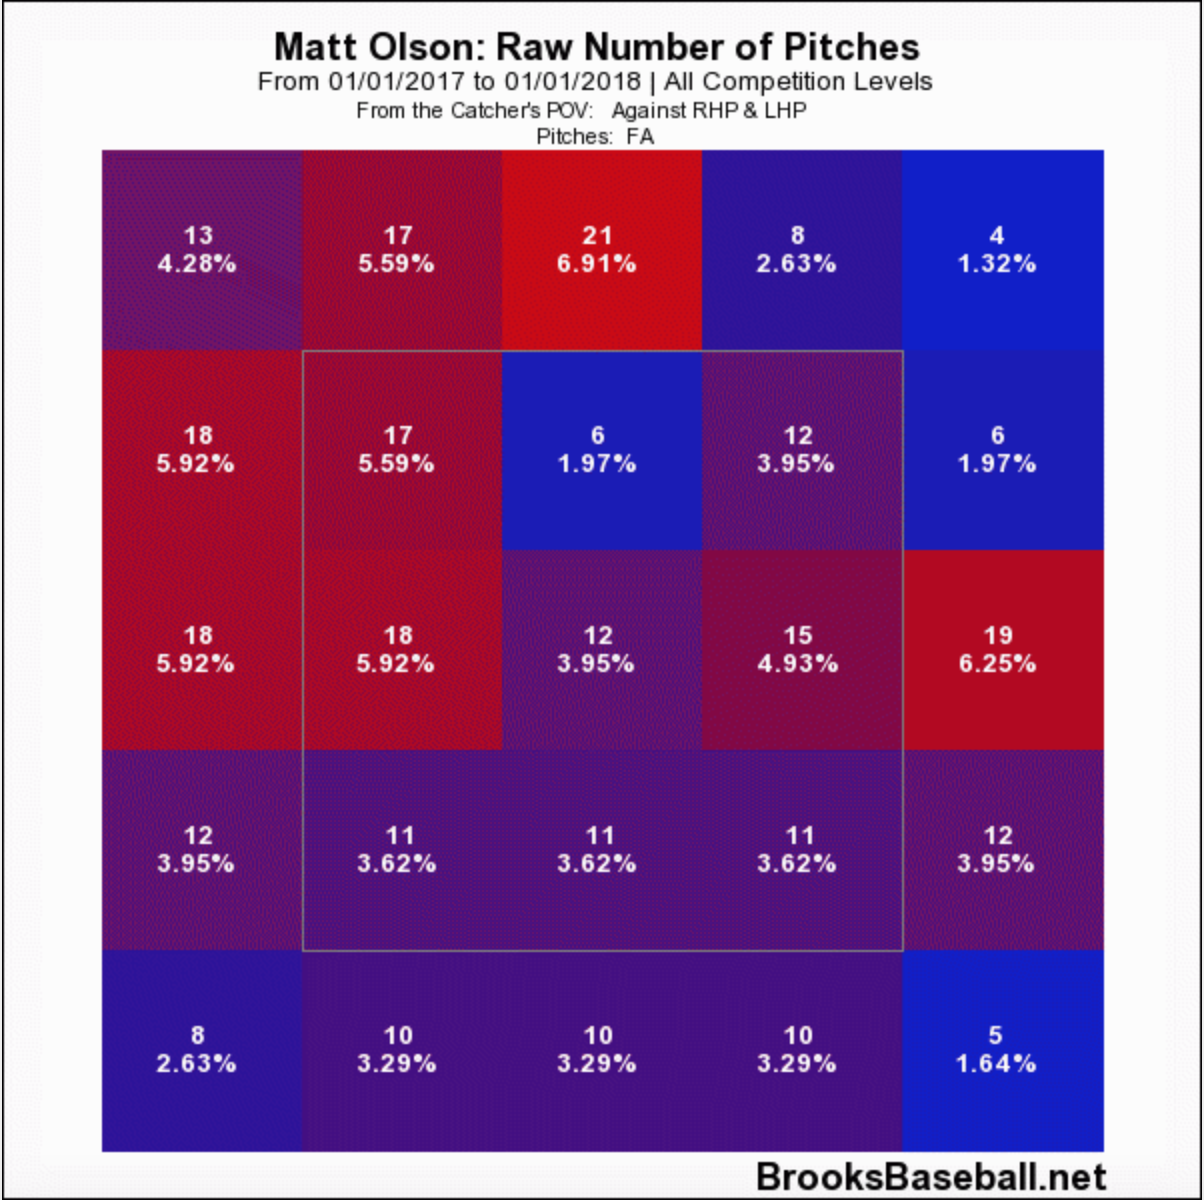
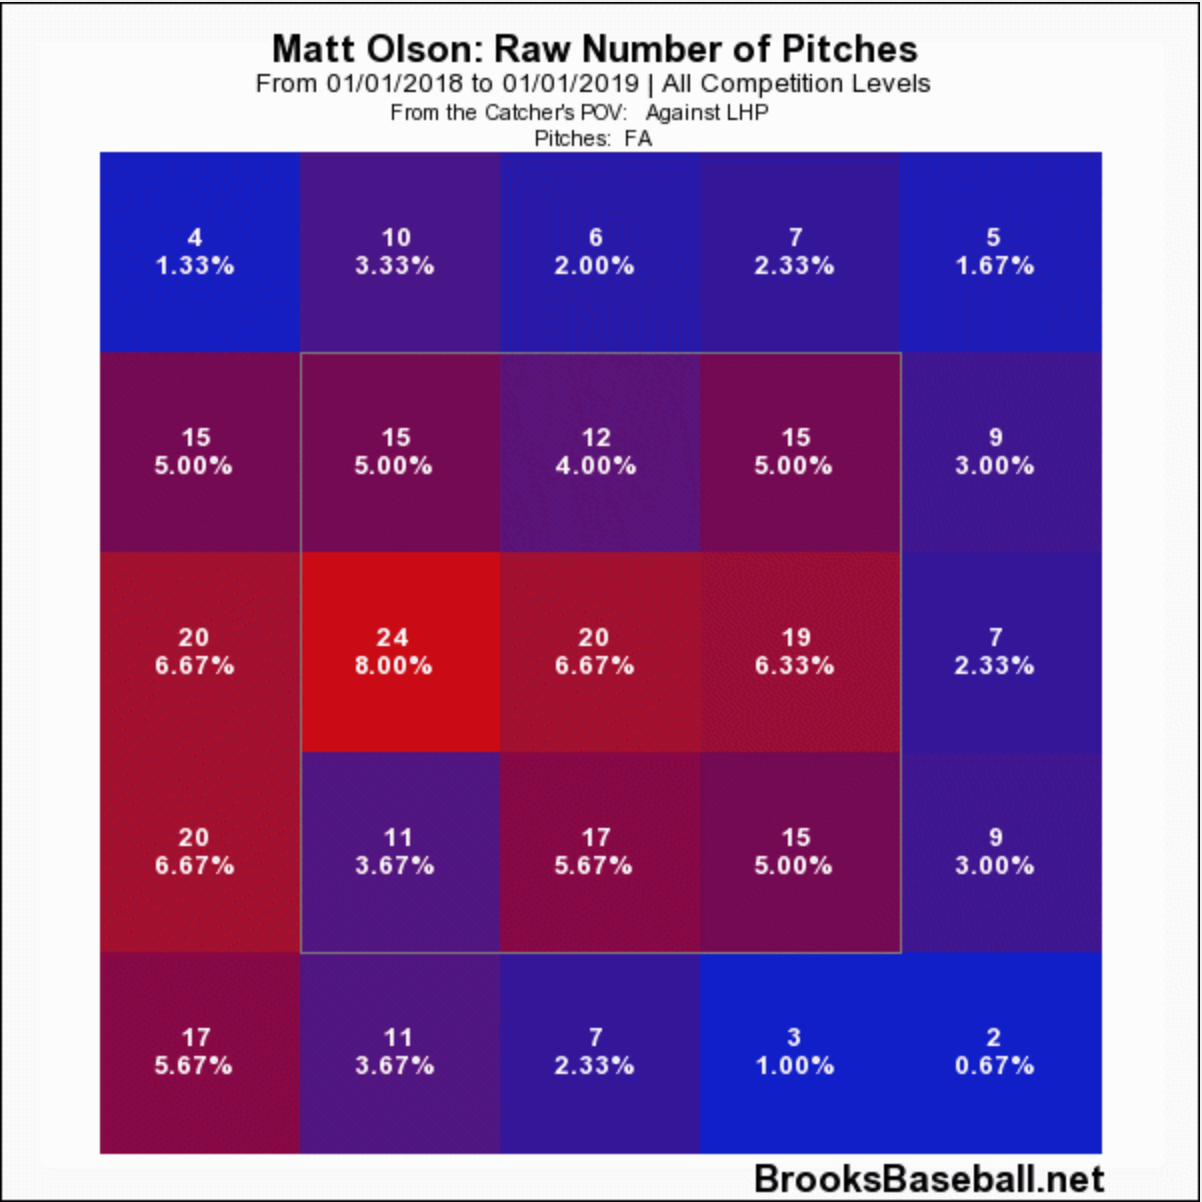
That’s an incredibly steep drop-off. To understand this problem, let’s take a look at how Olson’s been attacked with the fastball in each of the respective seasons.
2017
2018
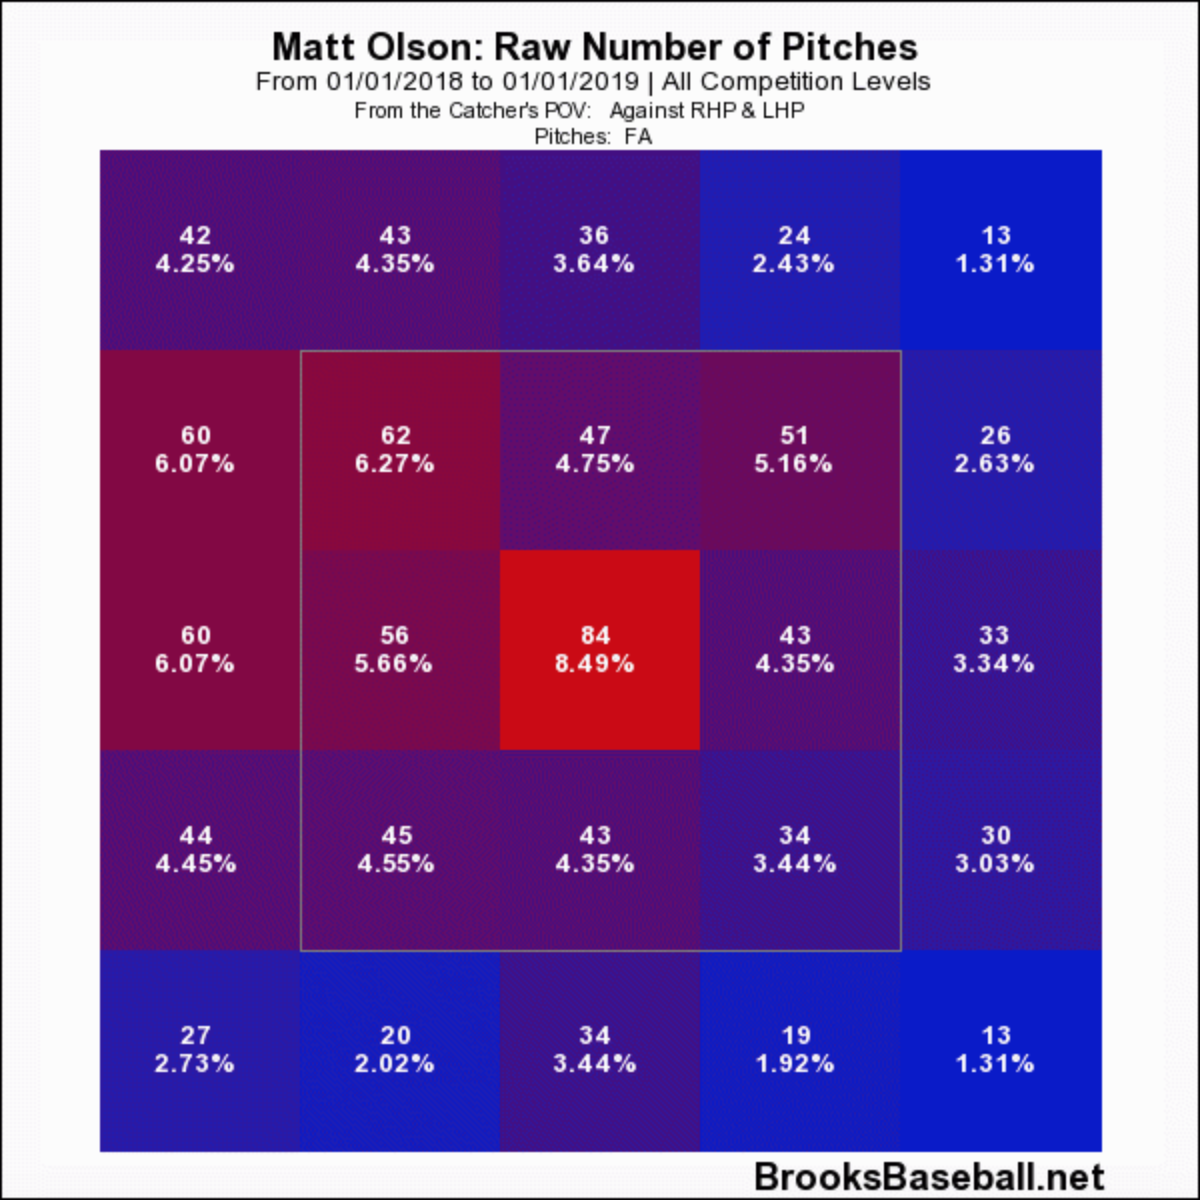
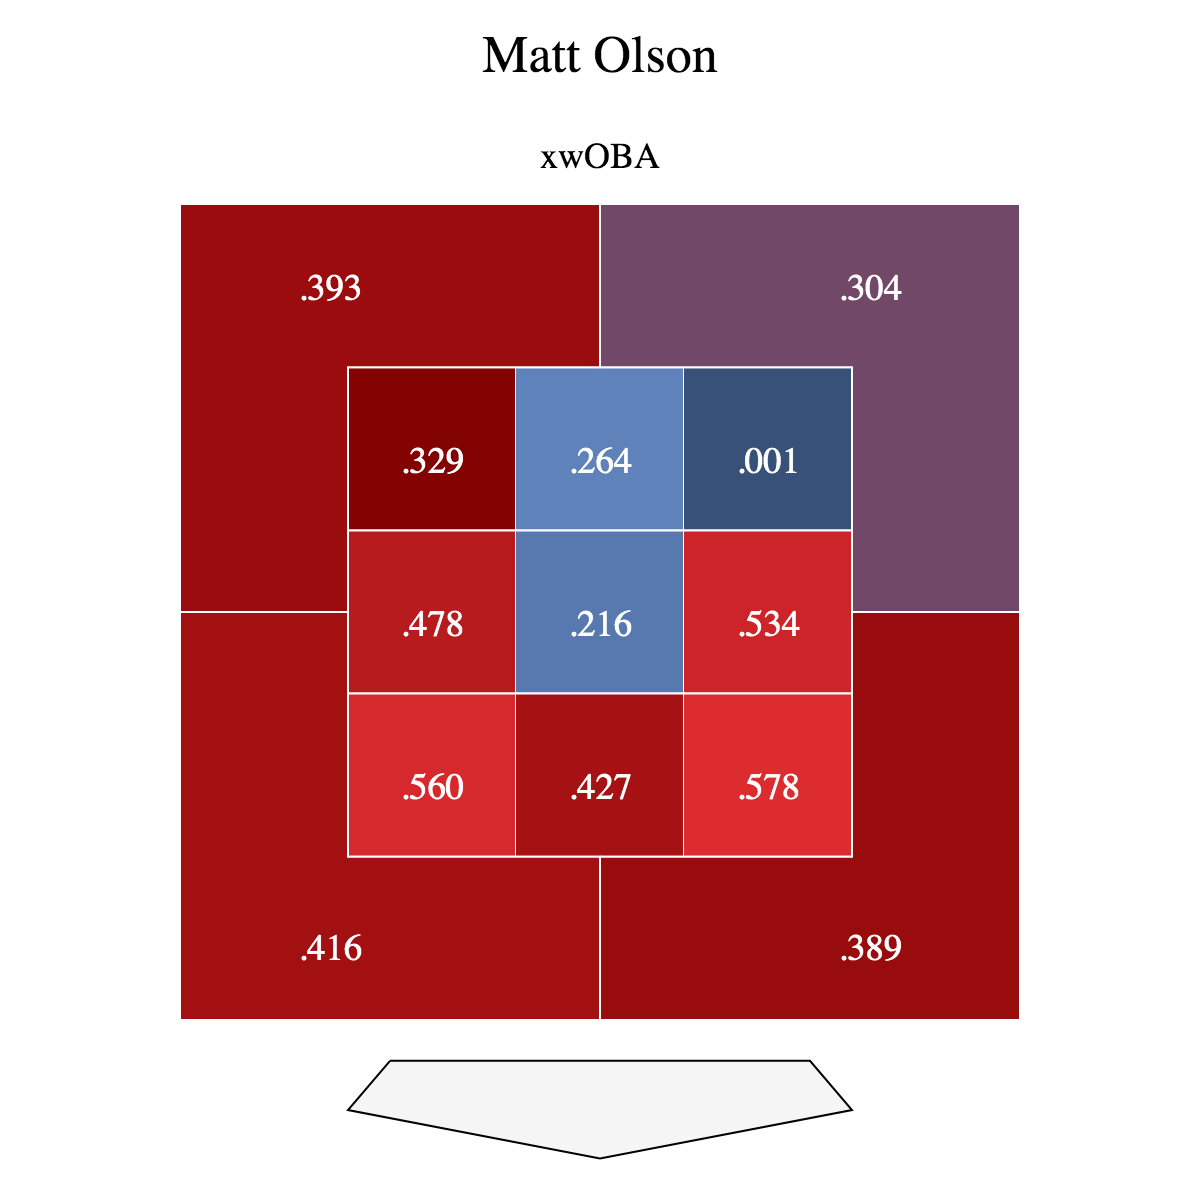
If you notice, there is a greater concentration of four-seamers on the inner third of the plate in 2018 than there was in 2017. Now look at Olson’s overall xwOBA statistics against pitches in particular zones from those two seasons.
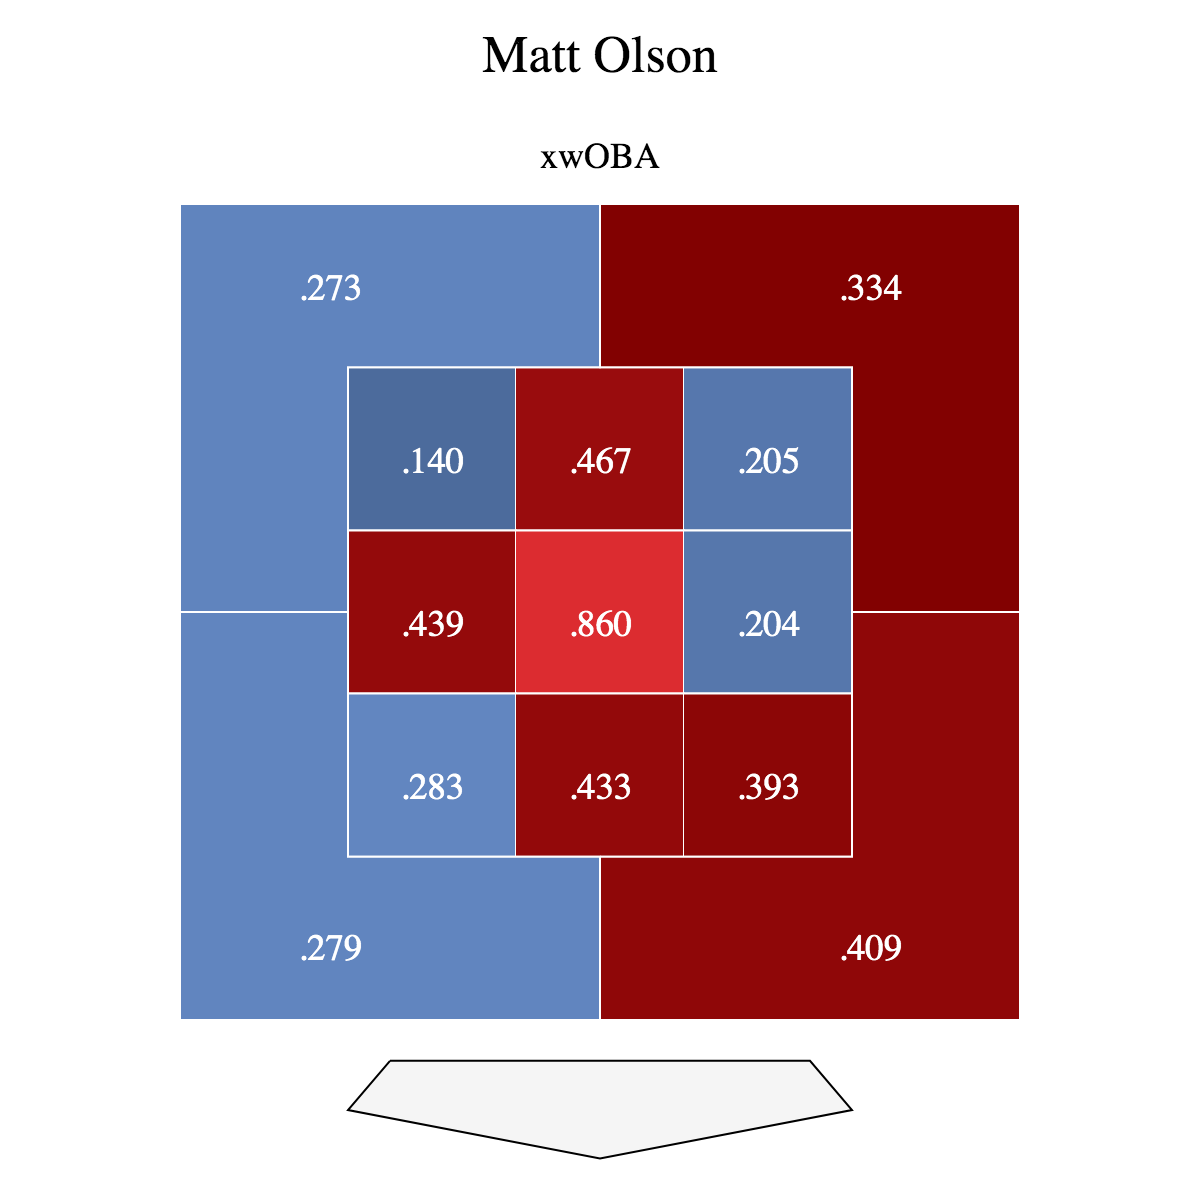
2017
2018
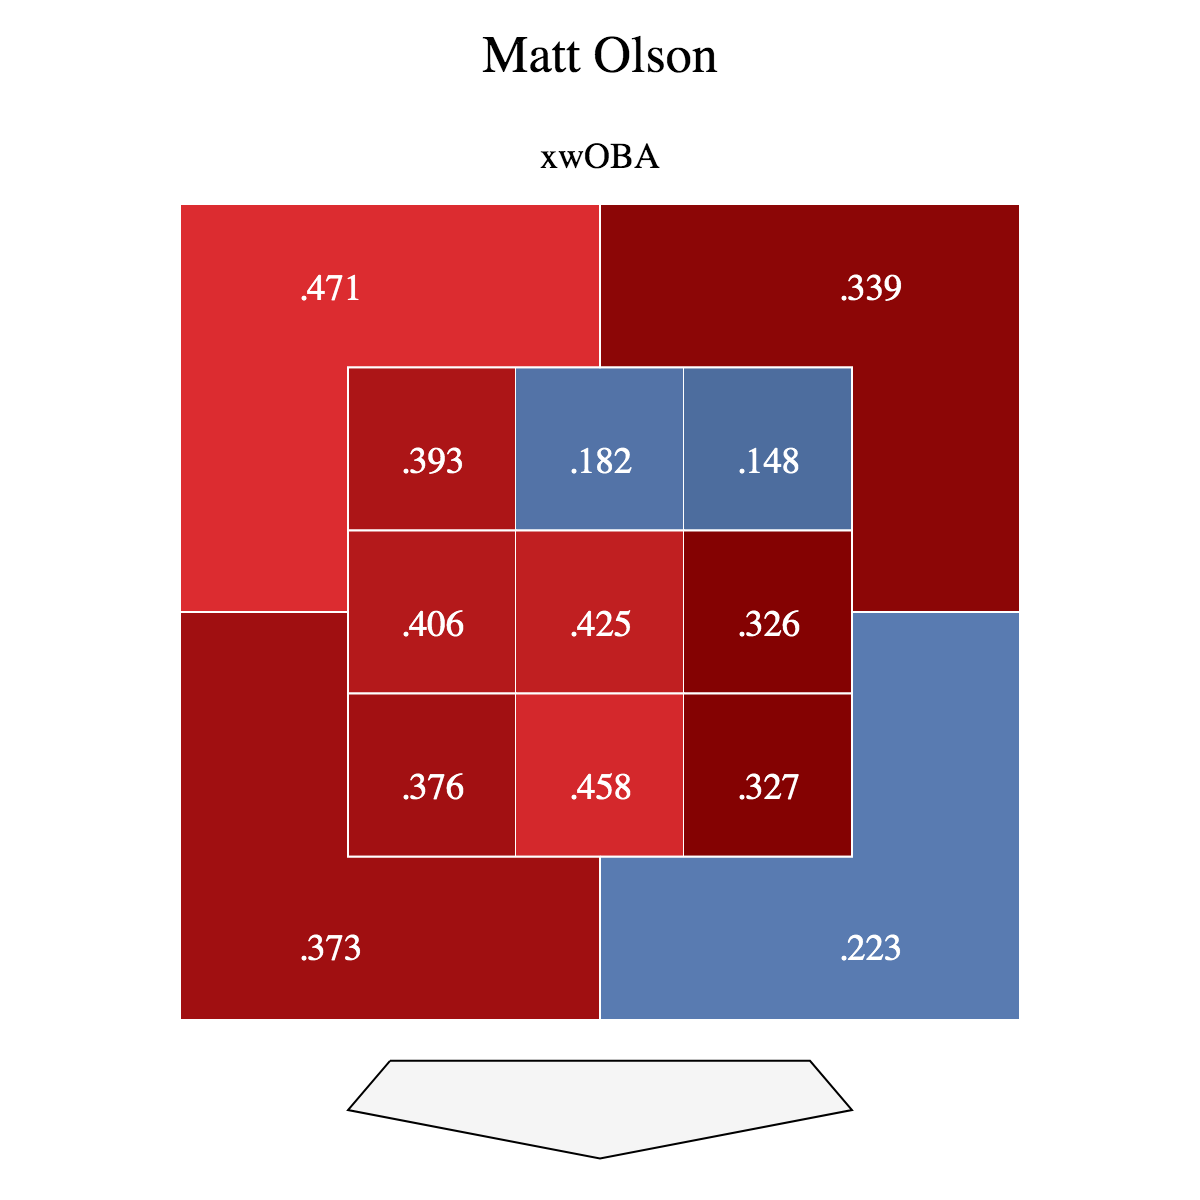
So it seems this was an inevitable course of action for pitchers. Olson definitely had a weakness on the inner third of the plate, and in 2018, he faced a barrage of pitches in his weak areas.
This is where we can address the second trend, his splits against right-handed and left-handed pitchers—league-relative splits adjusted for the park.
| LHP sOPS+ | RHP sOPS+ | |
| 2017 | 102 | 180 |
| 2018 | 96 | 126 |
To connect our two trends, we see how both left-handed and right-handed pitchers attacked Olson with the four-seamer last season.
LHP
RHP
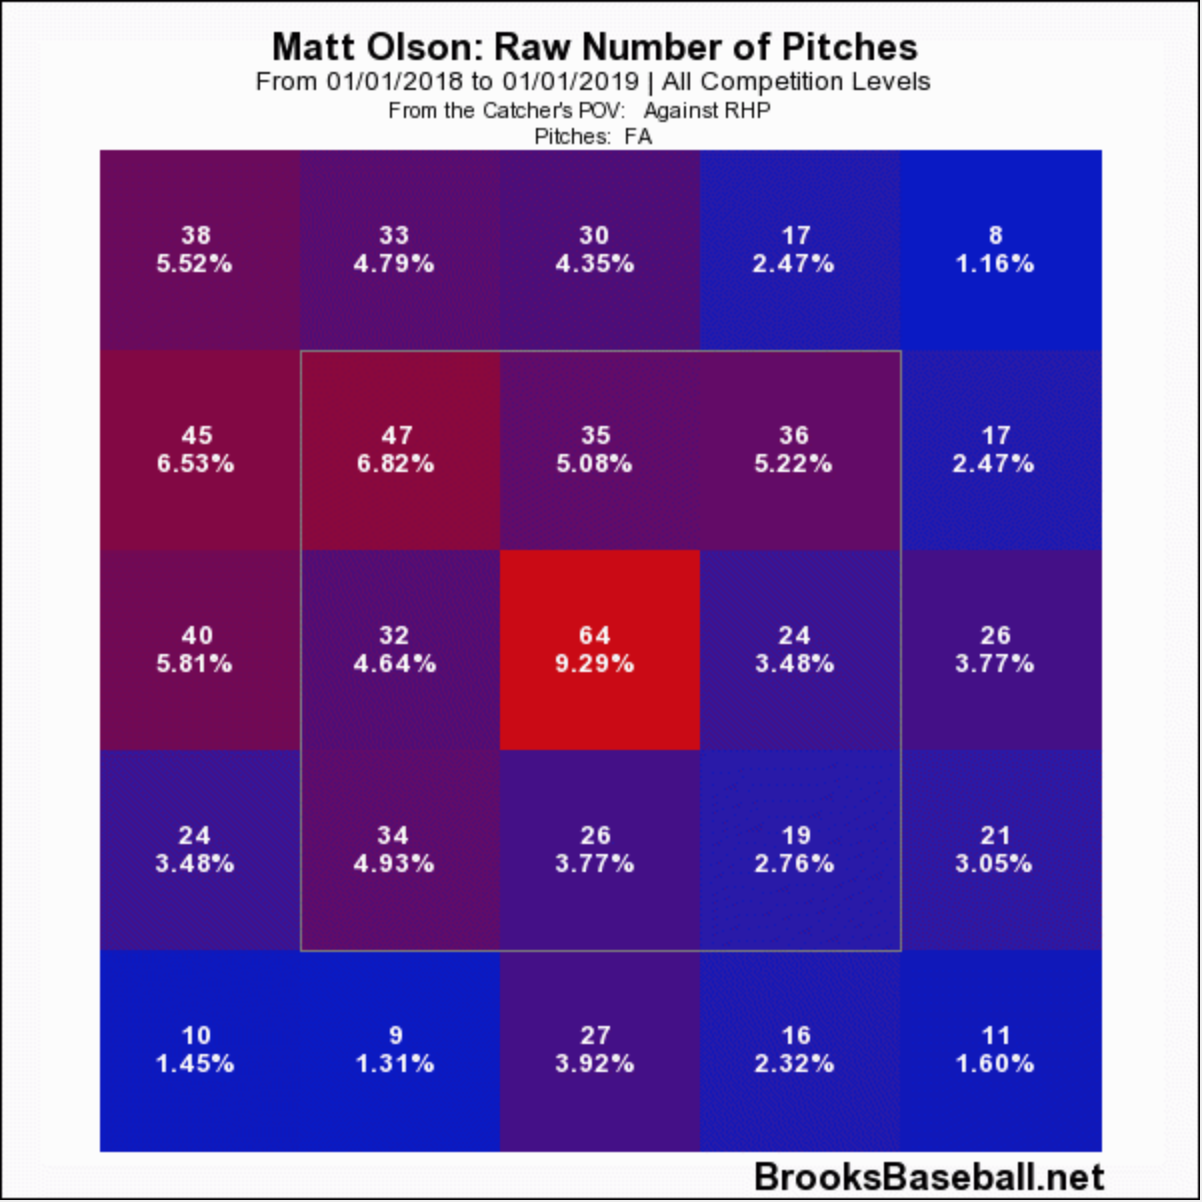
Of course, the inner third is our answer. Olson’s splits against lefties and righties can be derived from his issues not only with four-seamers from last season but also pitches on the inner third of the plate.
Ain’t Wastin’ Time No More
As Olson rakes in 2019, there are some noticeable changes in his stance compared to his past three seasons.
2017
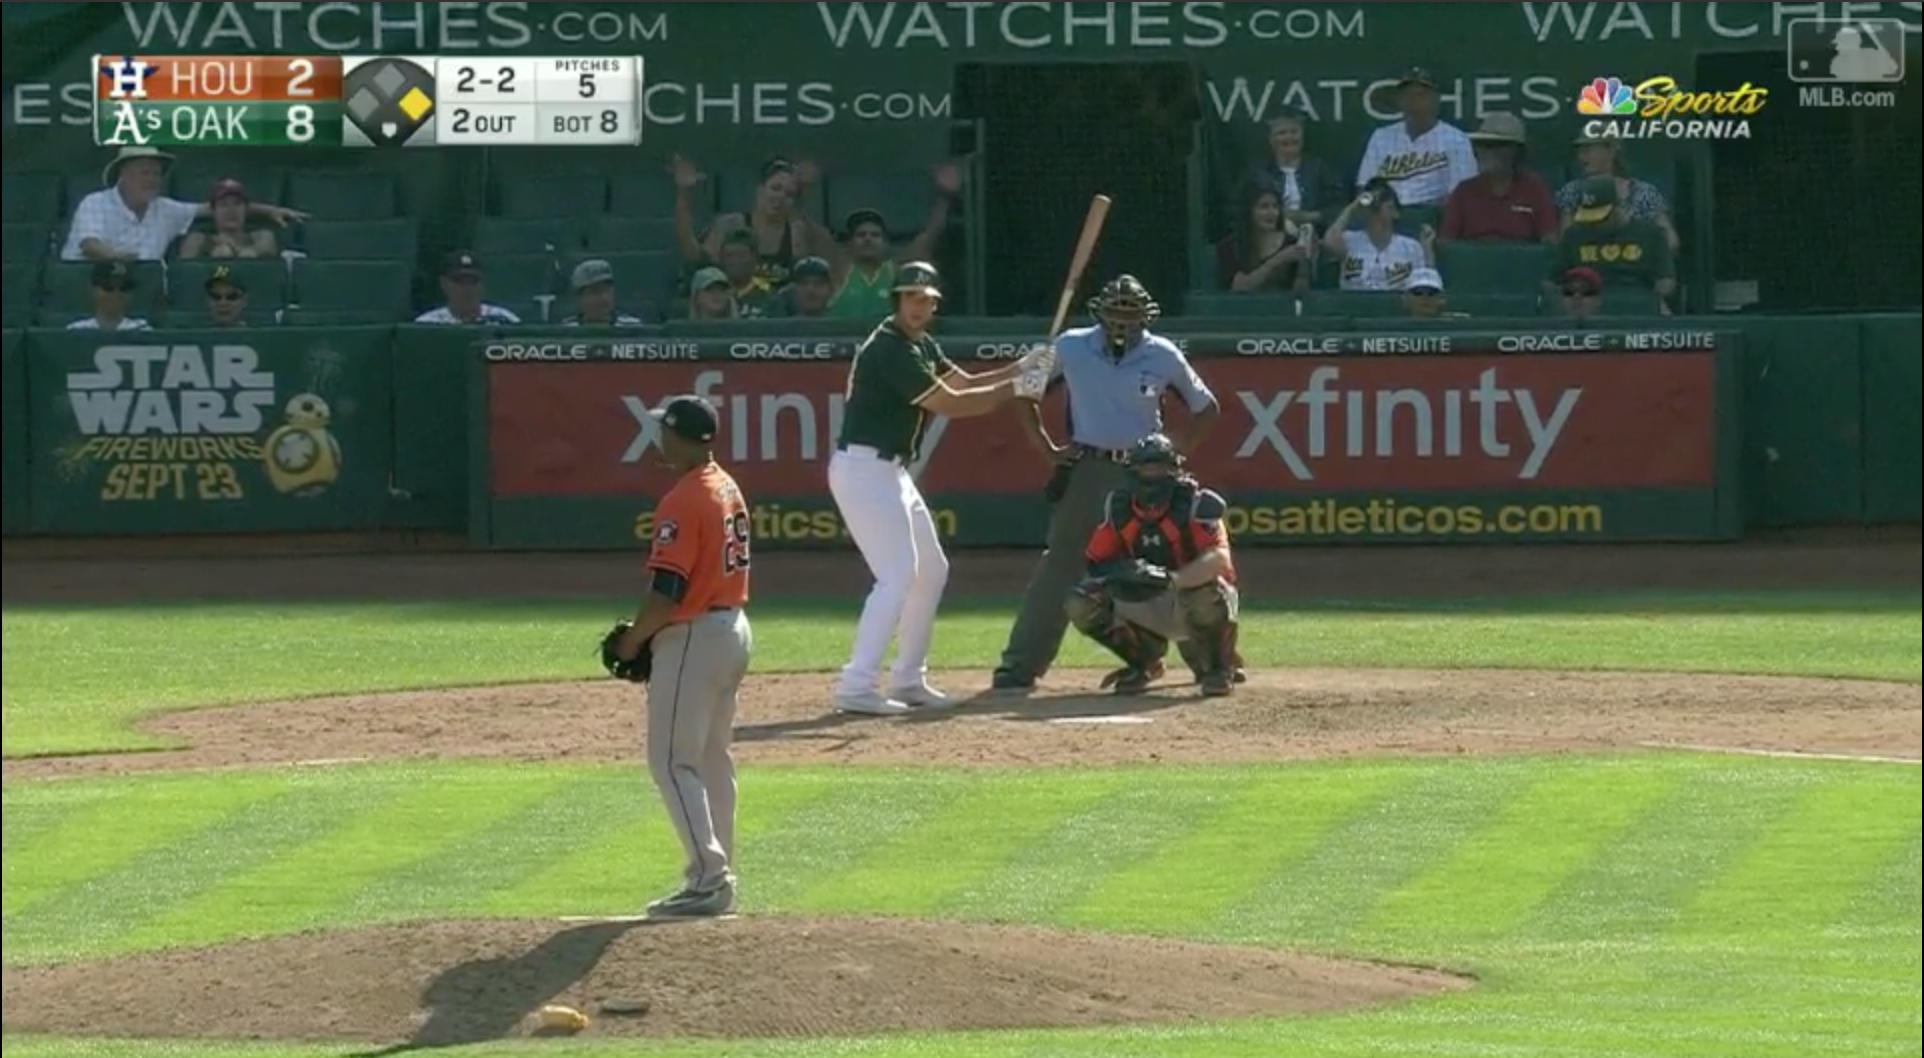
2018
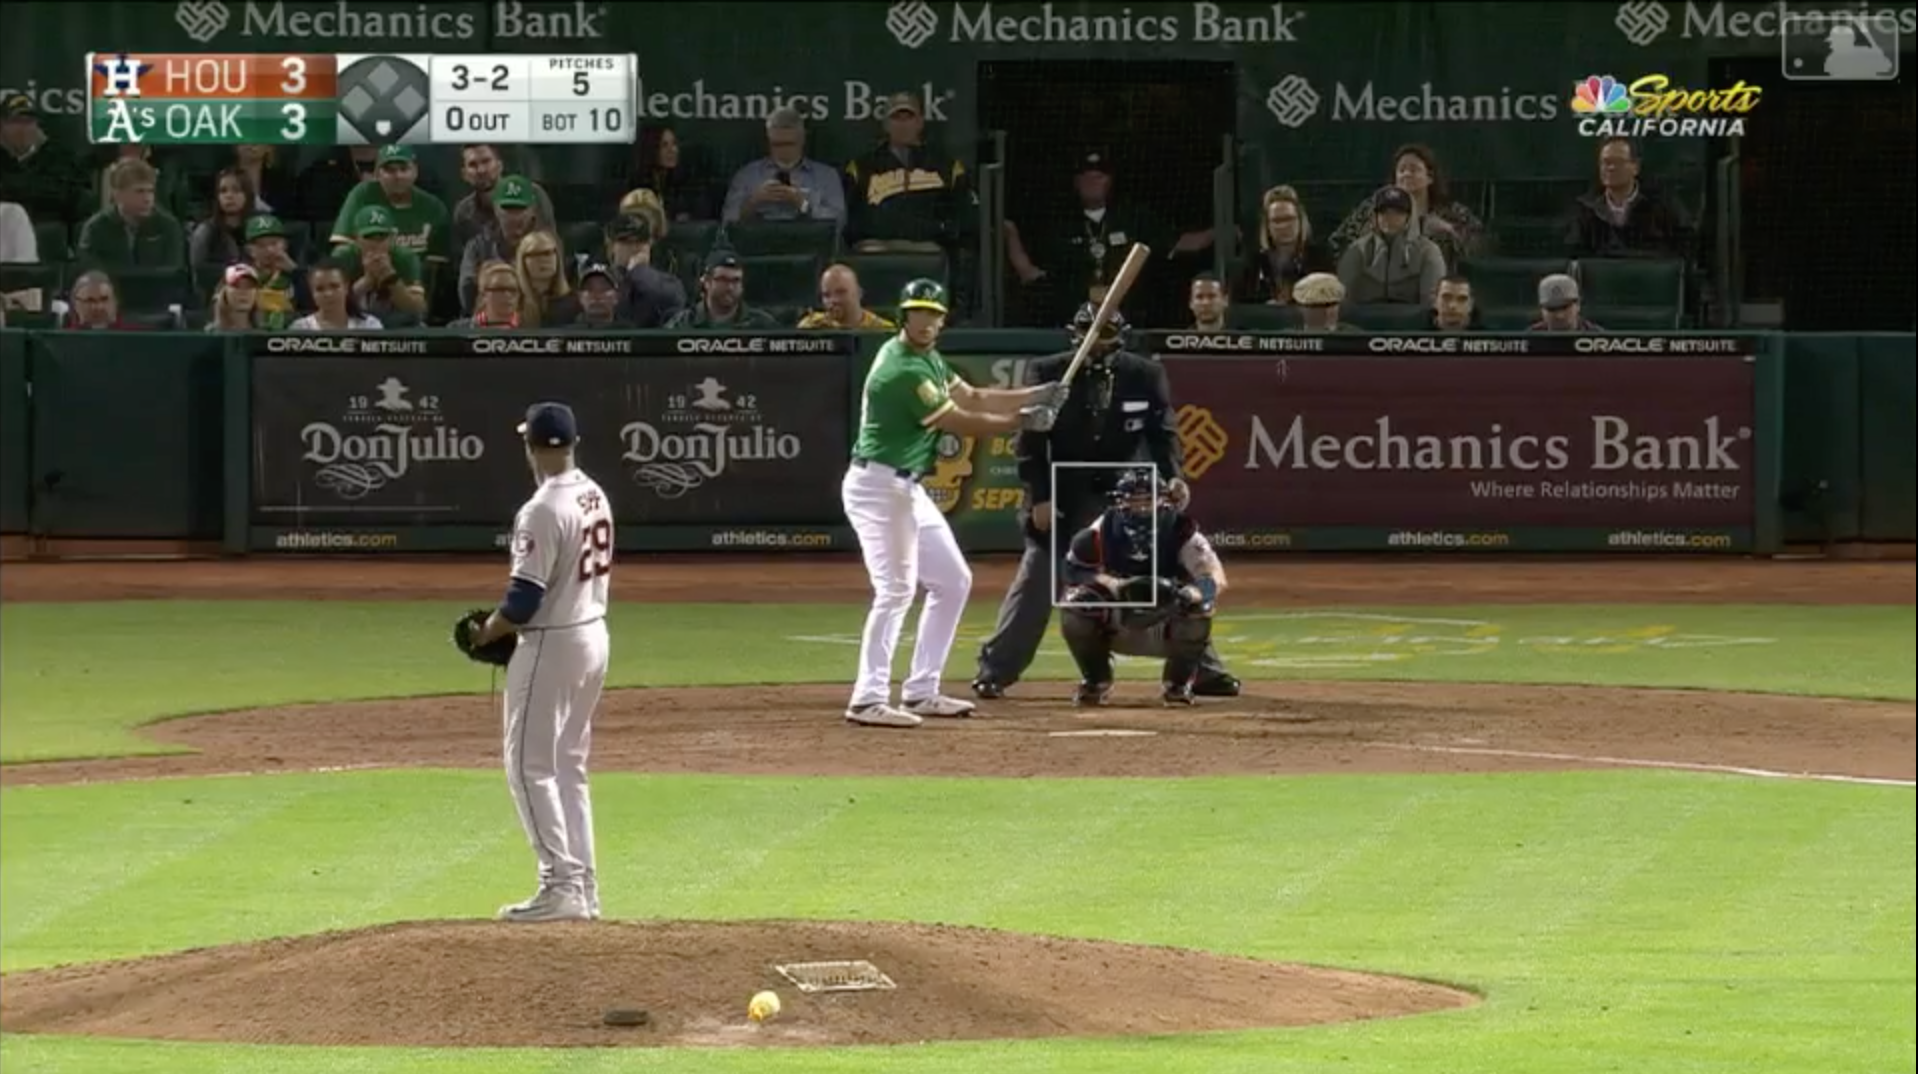
2019
Initially, you can see that Olson is standing a lot taller at the plate. It’s a trend that has become more and more popular in baseball—a nod to stars like Mike Trout and Cody Bellinger.
However, the most important change is with his hands. In 2017 and 2018, you can see that Olson has his hands far away from him, with the bat head pointing nearly into the third base dugout. This season, Olson has his hands much closer to him, with his bat much more vertical. The importance of this is timing. Since Olson needs to get his hands nearly behind his head to create a “rubber band” effect with his body before impact, you can envision how Olson’s prior hand placement was detrimental to his timing. It took him a lot of time to adjust his bat head to a near-vertical position behind his head, while his hands, pretty much over the plate, had to cover a lot of ground to get behind his head. Wasting that much time will almost inevitably make you late on pitches where you need quick reaction—none more noteworthy than four-seamers, as we can extend our table from earlier.
| FA xwOBA | |
| 2019 | .420 |
By keeping his hands and arms in a better position to get back in his load, he is now more efficient in his mechanics, thus eliminating any wasted motions that would hinder his ability to hit higher velocity and pitches on the inner third of the plate.
As we recall our previous relationship between left-handed and right-handed splits, Olson has with his troubles with four-seamers. We can now see the success Olson has had, where he’s actually become a more effective hitter this season against lefties than righties.
| LHP sOPS+ | RHP sOPS+ | |
| 2019 | 146 | 128 |
The summation is an xwOBA chart that looks a lot more complete than in prior seasons.
Ramblin’ Man
As we previously noted, Olson has been pulling more pitches this season. We can attribute some of this to his making the aforementioned mechanical adjustments. Though I think there is a greater reason for the rebound in his pull percentage.
To comprehend this, we can compare Olson to one of the best pull-hitters in baseball, Mookie Betts, and their respective xwOBAs on fly balls and line drives over the 2017 and 2018 seasons.
2017-18 xwOBA On FB/LD
| Pull | Straight | Opposite | |
| Matt Olson | .900 | .622 | .418 |
| Mookie Betts | .738 | .576 | .329 |
As we can see, it was a fairly odd approach for Olson to attack all fields, as he decreased his pull percentage from past seasons. Maybe that came from some of his mechanical deficiencies, but Olson definitely seems to have a similar profile to Betts, who is an incredibly successful and notorious pull-hitter.
To see if there was a more concerted effort to pull the baseball, rather than just assuming mechanics helped him change, I decided to look at how many home runs Olson has pulled that were on the outer third of the plate the past three seasons.
| Home Runs | Pitches Seen | Percentage of Pitches | |
| 2017 | 2 | 913 | 0.2% |
| 2018 | 2 | 2829 | 0.1% |
| 2019 | 4 | 1201 | 0.3% |
We can see that Olson has now equaled the home runs that fit our criteria this season from the previous two seasons combined. There are points of impact when hitting that pertain to which field you will end up hitting to. If you want to pull the ball, you need to meet it out front to put the impact on the pitch that you want. You then let it travel more if you want to hit to center, and then to left. Even though you are letting the ball travel a little more, however, you can still hit the ball out for a home run, especially given Olson’s prodigious power. Though given the distribution of home runs that he’s hit since 2017, we can tell that Olson has an affinity for the pull side, further implying that his natural power swing is to right field.
Even though most hitters align themselves with having more power toward the pull side, it’s not that all hitters have this mantra. A hitter like J.D. Martinez or Nicholas Castellanos has his natural power alley to right-center. The point is that pull percentage does not exactly correlate to success for power and hitting.
What pull percentage for a hitter like Olson tells us is that he is now hunting pitches he can hit out of the ballpark. Hitting the ball out front to pull means you have less time to react, and your body and mind need to be synchronized to be able to succeed. Any sort of degree of doubt, or having inefficient body mechanics, will result in a lazy fly ball to center or left—possibly even a swing and miss.
All of this comes with experience, and Olson has become more acclimated to what his strengths and weaknesses are.
Featured Image by Justin Paradis (@freshmeatcomm on Twitter)