


Prior to this past season, St. Louis Cardinals 33-year-old utility man Matt Carpenter garnered more appreciation in sabermetric circles than traditional circles because of his enhanced plate discipline and tantalizing Statcast metrics.
But midway through 2018, Carpenter’s latent power potential finally manifested, and he became a household name. He finished the season with career highs in home runs (36), slugging percentage (.523), and OPS (.897). Better yet, his .386 xwOBA outpaced his .375 wOBA, indicating that his box score stat line was legitimately earned. Heading into 2019, Carpenter is finally garnering the respect he deserves.
Unfortunately, some concerning headwinds are brewing. For starters, Carpenter’s approach at the plate is very one-dimensional, heavily reliant on turning middle fastballs into pulled fly balls at the expense of performance on breaking pitches. This unilateral approach makes Carpenter a very streaky hitter — when things are on, he can hit 11 home runs in one month (July 2018), but when things go bad, he’ll ground into the shift once per game and post a .245 slugging percentage (September 2018).
This strategy has worked for Carpenter to date because the feasts have been bigger than the famines. But one of the reasons the feasts have been so big is that opposing pitchers have employed a completely inappropriate plan of attack against Carpenter to date, essentially pitching to his strengths rather than his weaknesses.
Dropping Heat
Despite being one of the best fastball hitters in the game, pitchers groove the hard stuff to Carpenter like he’s a standard weak-wristed leadoff hitter as opposed to one of the game’s best power hitters. Don’t believe me? Take a look at the hitters who faced the highest rate of fastballs in 2018:
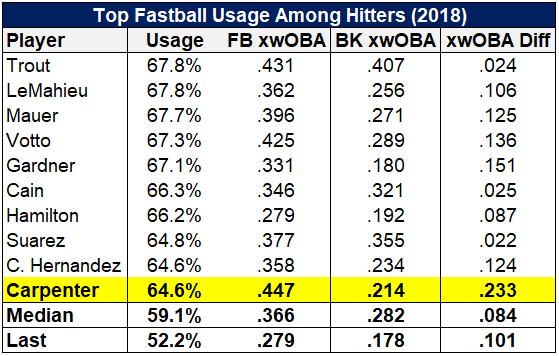
The majority of this list is composed of contact-oriented leadoff hitters such as DJ LeMahieu, Brett Gardner, Lorenzo Cain, Cesar Hernandez, and Billy Hamilton. Pitchers aren’t afraid of throwing fastballs to these hitters because they are rarely capable of doing serious damage.
While there are a handful of good power hitters represented, such as Angels center fielder Mike Trout and Reds third baseman Eugenio Suarez, they are also adept breaking-ball hitters, indicating that pitchers wouldn’t necessarily derive any benefit from throwing them fewer fastballs.
Then we have Carpenter, slotting in 10th at 64.6% fastball usage. He demolished those fastballs, earning a .447 xwOBA on them. That performance made Carptener the best fastball hitter on the list and the sixth-best in all of baseball this past season. His fastball dominance also extends back multiple seasons, with .440-plus xwOBA readings on them in both 2016 and 2017.
The striking thing about Carpenter seeing so many fastballs isn’t just about how much he destroys them. It’s also about how bad he is on breaking pitches. Carpenter’s .214 xwOBA on curves and sliders in 2018 was in the bottom 10th percentile in MLB this past year. Based on the absurd 233-point xwOBA differential on fastballs and breaking balls, it seems like pitchers would derive a serious benefit by throwing Carpenter more of the bendy stuff.
The league median fastball usage rate is 59.1%. The hitter who saw the least amount of fastballs in 2018 was Cubs star Javier Baez at 52.2%, and Baez was a significantly better breaking-ball hitter than Carpenter this past season. I’m not sure what the ideal fastball usage rate for Carpenter is, however, I have to suspect pitchers will begin to wise up to the fact that pitching to Carpenter isn’t like throwing to Hamilton.
Down the Middle
We just established that Carpenter is profiting from a significant arbitrage opportunity: MLB pitchers throwing a pitch mix that treats him like a standard 1980s leadoff hitter. But astonishingly, the lunacy doesn’t stop there. It turns out that pitchers have been throwing Carptener fastballs in exactly the areas where he is most adept at hitting them.
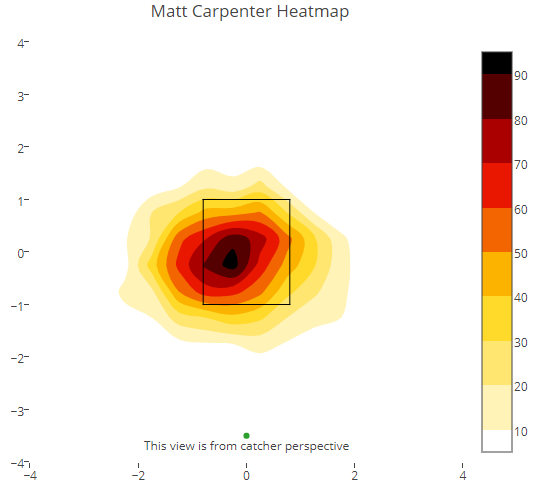
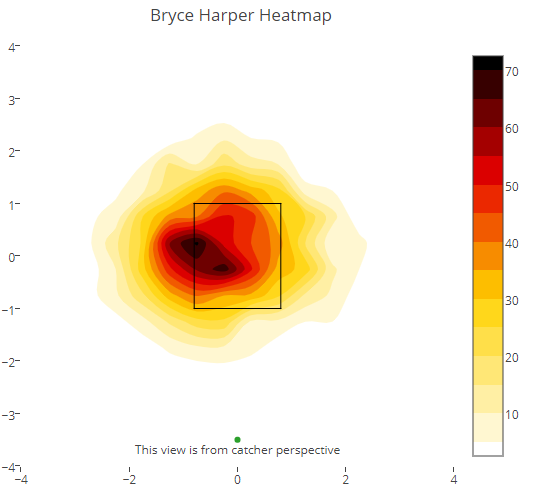
Two heatmaps are outlined above. The one on the left displays the typical locations of fastballs thrown to Carpenter in 2018, while the one on the right outlines those witnessed by Bryce Harper. Not only does Carpenter face nearly 7 percent more fastballs than Harper (64.1% vs. 57.7%), pitchers tend to groove those fastballs right down the middle. Carpenter saw 141 fastballs thrown down the heart of the plate in 2018. Despite seeing more overall pitches, Harper only witnessed 91.
Unsurprisingly, Carpenter inflicted most of his damage on these pitches. His top exit velocities on fastballs sat dead center (95.9 mph), low-center (96.2 mph) and left-center (95.1 mph), the precise areas that overlap with the darkest areas of his fastball usage heatmap.
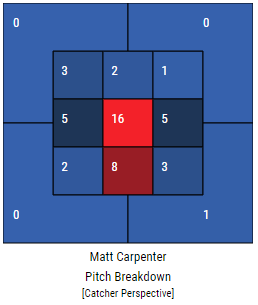
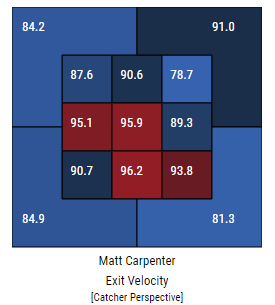
Carpenter barreled 55 total balls in 2018, with 46 (84%) off fastballs. Of those 46, nearly two-thirds were struck in Carpenter’s “happy zones” described above. Note that Carpenter seems to struggle with elevated fastballs, evidenced by his tepid exit velocity and barrel metrics in the upper third of the zone. If pitchers are still content to throw Carpenter an endless sea of fastballs, the least they could do is place them in the areas where he has a more difficult time hitting them.
Why?
You might be left wondering how this is possible. Carpenter has established himself as a top power bat, yet pitchers are still throwing him his favorite pitches in his favorite parts of the zone. In this era of information, that should not be happening.
Carpenter took 77% of his plate appearances last season from the leadoff spot. Could it be that, despite modern advancements in analytics, MLB pitchers still treat leadoff hitters like they’re all slap hitters? Based on the other names who face a disproportionate share of fastballs — LeMahieu, Gardner, Cain, Hernandez, and Hamilton — it certainly seems that way.
Some might argue that Carpenter, based on his 15%-plus walk rate, is patient enough to make pitchers throw him the pitches he wants. While that argument makes a degree of intuitive sense, it isn’t borne out by the pitch mix experienced by other patient power hitters.
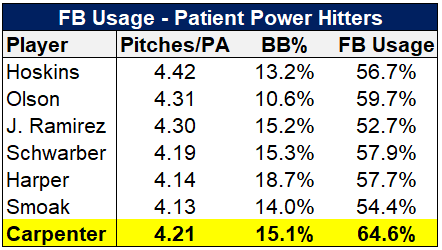
Based on the above sampling, there is no discernible direct correlation between a hitter’s patience at the plate and the number of fastballs he sees. Carpenter’s 64.6% fastball rate stands out like a sore thumb, with his leadoff status the likely culprit.
What It Means
The fact that Carpenter’s performance has been propped up by a pitching strategy that plays directly to his strengths should make the Cardinals and fantasy owners a bit nervous heading into 2019. Carpenter is a poor breaking-ball hitter and is also bad at hitting high fastballs. If opposing pitchers begin to adapt and either throw him fewer overall fastballs or become more refined with their location (or both), then Carpenter will have to make some serious adjustments to maintain his batting performance.
Whether pitchers do adapt is the $10,000 question. There seems to be a big arbitrage opportunity right now in batting a power-hitting, fastball-loving hitter in the leadoff spot. However, I can’t imagine that this scenario persists, as teams are giving away too many easy pitches to hit to power hitters such as Carpenter. Once that happens, the onus will be on Carpenter to respond.
(Photo by David Berding/Icon Sportswire)
Didn’t Carpenter only swing at the first pitch once last season? I wonder how that effected the number and location of the fastballs he saw.
Carpenter saw 666 pitches on 0-0 counts and swung at 120 of them according to Baseball Savant. That 18% swing rate is lower than the MLB average of 25% on 0-0.
This might be a reason why Carpenter’s 70.7% FB rate on 0-0 is higher than the MLB average of 64.7%. However, Carpenter sees more fastballs across the count spectrum. On 0-2, his 64.9% rate dwarfs the MLB average of 14.6%. He also sees significantly more in 1-0, 2-1, 2-2, 2-0, and 3-2 counts.
Very interesting. Thanks for correcting me!
Interesting read and well put together arguments. The reason Carpenter sees so many fastballs is the same reason Trout sees so many fastballs. You bring up Harper as a comparison, but let’s look at Trout and Harper:
Walks – Trout/2nd and Carpenter/6th and Harper/1st
Pitches per Plate Appearance – Trout/3rd and Carpenter/9th and Harper/21st
Swing % – Trout/3rd lowest and Carpenter/5th lowest and Harper/51st lowest
Swing and miss % – Trout/21st lowest and Carpenter/54th lowest and Harper/139th lowest
1st pitch swing % – Trout/10st lowest and Carpenter/12th lowest and Harper/134th lowest
Strike % – Trout/1st lowest and Carpenter/8th lowest and Harper/4th lowest
So why these stats? Harper is near the middle of the pack when it comes to Swing % and one of the biggest swing and miss guys out there meaning that he chases pitches that Carpenter doesn’t even look at. You look at his heat map and everything starts to make more sense. Wait, wait, wait, so how did Harper become 1st in walks? 10.4% (which was first by a fairly large margin) of his at bats saw a 3-0 count. For a loose swinging guy like Harper who swings a lot at first pitches, that obviously means that a large portion of these at bats were intentional to begin with or became intentional after falling to 2-0.
See that strike % ranking and how they are so similar between the 3? You know how they are different? Carpenter and Trout were leaders in the league at looking at strikes while Harper was near the bottom. That means that Carpenter and Trout have both adopted an approach to hitting which is synonymous with having a “good eye”.
If your article told me anything, it’s that Carpenter and Trout are more similar that I previously thought. If Carpenter can better his skills against the breaking ball, what kind of player would he be? Right now fantasy pros thinks he on par with Gleybor Torres and Adalberto Mondesi both of which have less than a full season’s worth of stats in their careers. Let’s also not forget that Carpenter is eligible at 1B and 2B which are the two hardest positions to fill this year.
All stats pulled from here: https://www.baseball-reference.com/leagues/MLB/2018-pitches-batting.shtml
Thank you for the well thought out response, PJ!
Carpenter certainly has a strong floor due to his plate discipline and baseline power. However, especially in AVG leagues, I feel like his current 60-70 ADP is overbought.
The fundamental difference between Trout and Carpenter is that the former is one of the best breaking ball hitters in baseball while the latter was one of the worst last year. Pitchers derive no benefit by throwing Trout more breaking balls because he hits those just as well. However, Carpenter was awful against breaking balls last year and is generally not very good against them. Pitchers could derive a lot of value by throwing them more against him.
And while I respect that Carpenter has great plate discipline, I don’t think that’s the reason he sees so many fastballs. If it were, why don’t Jose Ramirez, Rhys Hoskins, Kyle Schwarber, and Justin Smoak – other patient power hitters – experience a similar effect? There appears to be no correlation between having a good eye and seeing more fastballs.
Meanwhile, the names in the table for top fastball usage are heavily weighted towards leadoff hitters.
As a follow-up, there is very little relationship between fastball usage and plate discipline. The correlation coefficient there is 0.08. Meanwhile, the coefficient between fastball usage and ISO is -0.31.
This indicates that a hitter’s ability to hit for power has a strong inverse relationship with fastball use, which is something that breaks down in the individual case of Matt Carpenter.
I think the metric of P/PA is a bit flawed when talking “plate discipline”. Take a look at O-Swing% which is the total swings at pitches outside the strike zone. If you swing at balls, you have bad plate discipline, period. Here are the top 12 in the league:
Joey Votto, Andrew McCutchen, Brandon Nimmo, Mookie Betts, Alex Bregman, Cesar Hernandez, Aaron Hicks, Matt Carpenter, Joe Mauer, Brett Gardner, Mike Trout, Jose Ramirez
Votto, Hernandez, Carpenter, Mauer, Gardner, and Trout all show up in your list for FB%. I can’t give you an exact correlation ratio, but I think it somewhat tracks. You’re right Jose Ramirez shows up in the O-Swing% as being a good plate discipline guy, but why no high FB%? Have you looked at wFB/C? wFB/C represents the average amount of runs that hitter produced against 100 fastballs thrown, that isn’t plate appearances, that’s total fastballs. He put up 2.57 runs per 100 fastballs (4th overall). Against sliders, curveballs, changeups, anything really, he puts up less than 1 run per 100 pitches. Why on Earth would you ever throw this man a fastball. Let’s breakdown each man individually:
The numbers are against a fastball/slider/cutter/curveball/changeup/splitfinger
Jose Ramirez – 2.57/0.40/0.04/0.97/1.06/0.06
Carpenter – 1.48/-0.91/5.00/2.34/0.60/-3.46
Votto – 0.79/1.49/3.10/0.66/0.96/-10.23
Hernandez – 0.72/1.19/-0.74/-0.98/-1.50/1.14
Trout – 2.17/2.11/3.44/2.03/5.40/3.55
Gardner – 0.42/-0.83/-2.41/-0.26/0.07/0.31
Mauer – 0.27/0.97/-1.25/-0.77/-0.06/-2.75
As told before every time you throw Ramirez a fastball, you are playing with fire. Carpenter actually does better against cutters and curveballs. The fastball is almost Votto’s worst pitch to hit against. Hernandez did much better against splitfingers and sliders than fastballs. Trout . . . he’s a monster, you’re actually better off throwing him your easiest/best pitch and hoping he doesn’t tater it. Gardner, fastball was his best, but he was so bad it didn’t matter. Mauer follows nearly the same logic.
My point is that maybe leadoff hitters aren’t the link to FB%. It may show that leadoff hitters see a lot of fastballs as you mentioned, but it’s not just leadoff. It’s 2nd and even 3rd in the order as well. So maybe it’s high at bat players. Maybe it’s good plate discipline guys. Maybe it’s the fact that leadoff hitters come up to the plate with no one on base AT LEAST once per game so there is little risk in a fastball. Maybe it has to do with the fact that more than half of leadoff hitters hit less than 20 homeruns making it less risky. Maybe it has to do with the team and how good they are offensively. Maybe it’s because every pitcher in MLB throws over half their pitches as fastballs and it’s usually their most accurate pitch. To that point, where are Springer, Calhoun, Lindor, Betts, Dozier, Turner, Merrifield, and Choo? Who knows, I wrote all this to offer a different perspective on the situation for players potentially panicking about keeping Carpenter. In my sole opinion, based on me and stats, I would say Carpenter will be fine for where you take him this year.
Just reading this now… four months too late! Shame on me for not discovering this site before our draft this year; you guys put out some great stuff. Crapenter has been so frustrating, but my pride won’t let me drop him.