


One of the most frustrating parts of being a fantasy analyst is the phenomenon we call confirmation bias. We draw a conclusion about a player, usually at the beginning of the season, and once we see evidence that confirms our original hypothesis we have a tendency to ignore the rest of the big picture, especially if it might contradict said hypothesis. We all do it and I’m as guilty as anyone else. In a business predicated on being right, it’s an easy trap to fall into and it’s rarely malicious. You find what you’re looking for and stop digging. I writing this today to tell you that I’m starting to think I may have fallen prey to this particular bias this season when it came to my opinions about Mallex Smith. I didn’t believe that there was any chance he would be able to replicate his breakout 2018 season. For about a month and a half, it looked like I was absolutely right; through April 28th Smith had hit for a brutal .165/.255/.502, which is a far cry from the .296/.367/.772 he put up in 2018. At this point Smith was sent down to AAA to work things out. Figuring my work here was done, I washed my hands of Smith and didn’t really bother to dig any deeper into the underlying stats. Boy was I in for a surprise.
On May 16th, the Mariners brought Smith back up to the major league club and since then it has been like watching a completely different hitter. Over the last month, he has hit .274/.324/.765 while doing what he does best: stealing bases left and right. He swiped 10 bags over that time period, giving him 18 on the season, which is good for second in the majors. That’s pretty good right up until you realize he missed several weeks of the season! That’s more than just pretty good. So what changed? Honestly everything.
So let’s start from the beginning and see if we can’t discover what has unleashed Smith so far this season. Let’s take his breakout 2018 numbers and compare them to his April 2019 numbers and what he’s managed to do since coming back up from AAA.
| Year | PA | AVG | HR | R | RBI | SB | wOBA | wRC+ |
| 2018 | 544 | .296 | 2 | 65 | 40 | 40 | .339 | 117 |
| April 2019 | 110 | .165 | 1 | 15 | 5 | 2 | .228 | 42 |
| Post-AAA 2019 | 121 | .264 | 4 | 15 | 15 | 10 | .315 | 104 |
| 2019 Total | 240 | .220 | 5 | 30 | 20 | 18 | .276 | 76 |
| 2019 Total Prorated | 611 | .220 | 13 | 76 | 51 | 46 | .276 | 76 |
So even if the AVG never improves, we’re looking at a hitter who is on pace to steal 40+ bases and manage to hit double-digit home runs for the first time in his career. Yet if we give further weight to his numbers post-AAA there is reason for further excitement. The question of course is, can we trust those post-AAA numbers? I think we can. I suspect when we take a look at the different aspects of Smith’s approach and dive into his Statcast data we’ll see that the last month has actually been the culmination of a gradual process that actually began back in 2017. So let’s get started.
Those of you who have read some of my other work know that the very first thing that I look for is a change in batting stance, as that can give us a distinct clue as to whether or not the current results are due to an actual change or if it is the product of the ebbs and flows of a typical season. All players go through hot and cold streaks and often a change in stance or swing can help to separate the noise from the data we really need to take seriously. In this specific case though, there is a clear change in batting stance to hang our hats on. Nicholas Stillman over at Lookout Landing has done a great job outlining how Smith altered his stance during his time in Tacoma and how it set him free. The new stance has created a smoother, more controlled swing, according to Stillman; it allows Smith to hit more fly balls since he doesn’t have to swing down on the ball. This already reminds me of a player that we were all excited about coming into this season and that’s Ketel Marte. Check out our very own Ryan Amore’s piece from the preseason about the changes Ketel Marte made to his swing. Marte made nearly the exact same adjustments that we’re seeing from Smith. There’s more on this to come, but given Smith’s superior speed and stolen base history that is a very, very exciting thought.
The other aspect that Stillman touches on is on how Smith has pulled the ball in the air more than ever since coming back from AAA and that this has led to an increase in wOBA. I found this intriguing, not because I think it’s wrong in any way (I agree with their logic), but that I think the conclusion is more a case of solid correlation as opposed to causation. I think though that if we drill even further down we can find that causation we’re really looking for, or at least come closer to it. For me comparing the player’s pulled fly balls to their wOBA is sorta like taking a book and only reading the beginning and the end. The middle is where the meat is! Again I don’t mean this to disparage Stillman’s article at all—I think he is spot on—I just want to do a deeper dive, as I think that we can gain an even deeper understanding of the changes Smith is making and whether or not we think that they have a chance to stick.
The first thing I want to talk about is Smith’s former team: the Tampa Bay Rays. It seemed odd to me that Smith would make this change now when the Rays MO at this point is pretty much “Find underappreciated player desperately in need of a change in launch angle/batted ball approach and convince said player to join the fly ball revolution.” The list of hitters the Rays have managed to reinvent in this manner is a mile long: Austin Meadows, Corey Dickerson, Ji-Man Choi, Avisail Garcia, Logan Morrison, and Yandy Diaz are all players who have found success with the Rays by adjusting their FB% and launch angles under Tampa’s tutelage. Why wouldn’t Tampa have tried to do the same with Smith? My suspicion is that they did try to do it and it simply took this long to click. It’s easy to forget three things when it comes to Smith: 1) He’s still only 26 years old. He’s not a baby baseball-wise, but we can’t expect Smith to be a finished product at 26. 2) Hitting a baseball in a specific way is INCREDIBLY HARD. 3) When it comes to something as complicated as completely revamping your swing and playing style it can take time. Most of these guys have been playing baseball pretty much the same way since they were middle schoolers. That drastic a change just doesn’t happen overnight. So, keeping these things in mind, is there any evidence that the Rays tried to get Smith to raise his launch angle and that A) it was instrumental in his success last year, and B) this last trip down to minors and the stance and swing adjustments that happened there was the final piece of the puzzle, not the first. If that’s true then I am ready and willing to buy into this breakout. My suspicion is that the key to all this lies in Smith’s launch angle data.
Let’s start with Smith’s career launch angle data both as a whole and broken down year to year.
| Year | Team | Average LA |
| 2016 | ATL | -3.8 |
| 2017 | TB | 3.5 |
| 2018 | TB | 2.6 |
| 2019 | SEA | 9.4 |
| Full Career | 3 Teams | 2.9 |
One of those years is not like the others, right? Going from 2.6 degrees to 9.4 degrees is an incredible jump for one offseason. This certainly lends even more credence to Lookout Landing’s piece. It’s important to realize there is a flaw in how I’ve presented this information, no matter how useful it is, and that flaw is that they are averages. If you read my other work you know I have a blood vendetta against averages. They’re fantastic for overviews or getting a quick impression of things, but they don’t come close to providing the actual vital information of how we got that average. Outliers (data on the far extremes of an information set) can have a huge effect on a set of data and force average statistics to essentially tell us white lies, or at the very least commit sins of omission. As a simple example take these three imaginary players and the launch angles of six of their hits.
| Player | Hit #1 | Hit #2 | Hit #3 | Hit #4 | Hit #5 | Hit#6 | Final AVG LA |
| 1 | 14 | 12 | 12 | 14 | 12 | 14 | 13 |
| 2 | 17 | 9 | 18 | 8 | 19 | 7 | 13 |
| 3 | 25 | 1 | 24 | 2 | 26 | 0 | 13 |
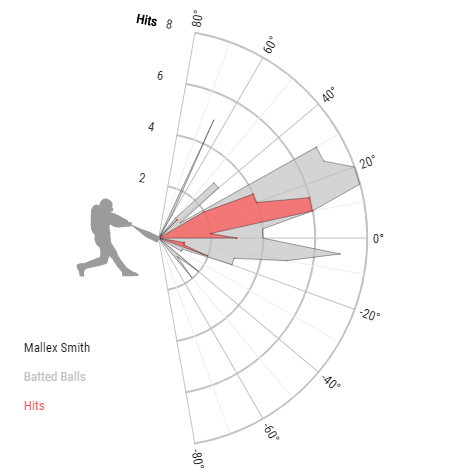
See what I mean? Given that a line drive is typically a hit between 10 degrees and 25 degrees, Player 1 has hit six line drives, Player 2 has hit three line drives and three sharp ground balls, and Player 3 has hit one fly ball, two great line drives, and three poor ground balls. Now I’m not making any statements about the quality of those hits, but notice that despite having radically different batted ball results they ended up with the exact same average launch angle. As your data set grows, the impact of outliers is lessened, but they can still have a huge impact on how we view a hitter’s results. In a given year a hitter might only put a couple hundred balls in play per season and that’s a sample size that can absolutely get skewed by outliers. What I want to do is start with each year and break the averages down in smaller samples where we can start to see if Smith’s yearly average launch angles are truly representative of the season he is having. In order to find this truth let’s look at Smith’s Launch Angle Charts. Before we jump into them—what do these charts tell us? There are three things I take into consideration when I look at these charts.
- Where are the outliers? I’m looking for any large spikes that happen between -40 degrees and -80 degrees and between 40 degrees and 80 degrees. Those are the kind of extreme numbers that can skew things drastically. They are terrible hits and worth noting. To translate those into baseball terms, the negative range here are balls that are essentially coming off the bat straight down into the ground and almost always turn into easy outs. The positive range is essentially lazy pop flys and infield fly balls, which are almost always outs as well.
- Next I work my way inward. How many spikes between -40 and 0? Those are still poorly hit ground balls, but can still end up hits if they have sufficient exit velocity. On the positive end I will actually break these down into 3 sections as there are different sets of results for each section as opposed to the negative results, between 40 and 25 degrees (The good kind of fly balls), between 25 degrees and 10 degrees (line drives) and finally between 10 degrees and 0 degrees (ground balls with a much better likelihood of becoming hits).
- Finally, I take note of where the largest red spikes are. This tells me in general what kind of batted balls are getting results for the hitter.
Here are Smith’s overall launch angle charts for each year:
2016 (145 Batted Balls) 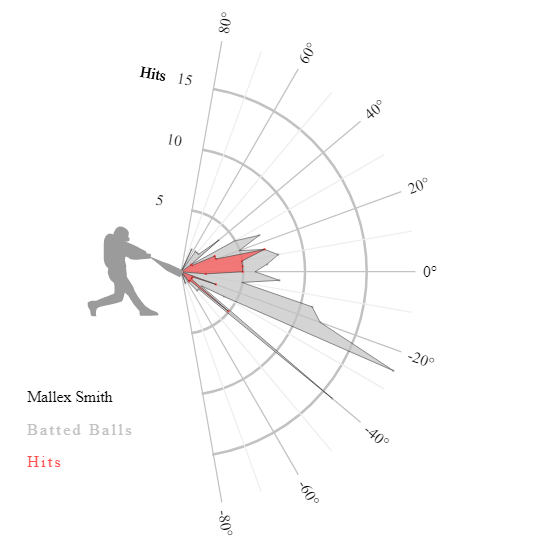
2017 (197 Batted Balls)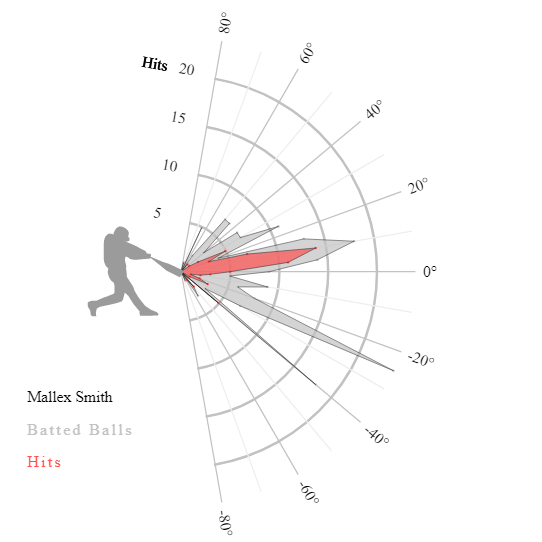
2018 (391 Batted Balls) 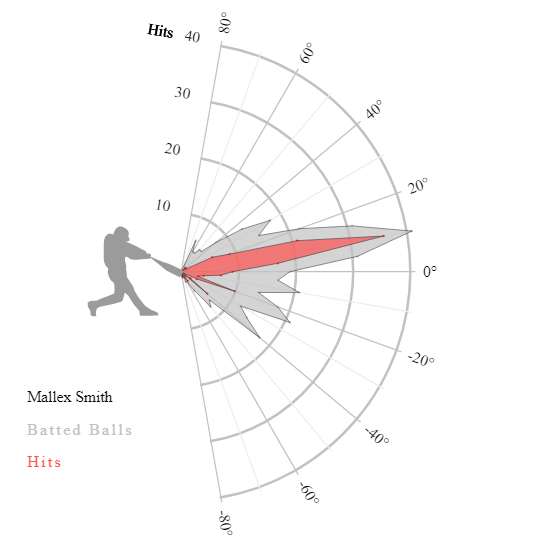
2019 (152 Batted Balls)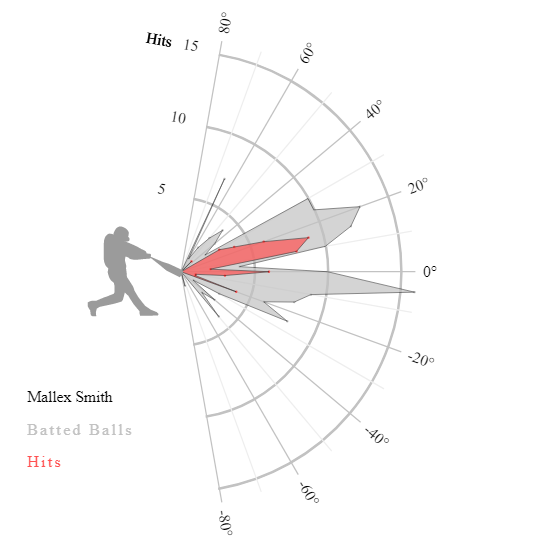
So what do we see here?
- Interestingly, the only year with any extreme outlier spikes is 2019, but this actually makes sense if he’s trying to hit the ball in the air more. Getting under the ball or on top of it can happen more often when trying for more fly balls, it just also tends to lead to more barrels.
- Now that we’ve identified any extreme outliers, the other thing I try to look for are large gaps between the most prominent grey spikes.
- 2017 is great example of this. He has a huge spike at 10 degrees with slightly smaller spikes at 20 degrees and 15 degrees but then another large spike sits at -25 degrees. That year his average launch angle was 3.5; he doesn’t really have any batted balls at 3.5 degrees—this is a perfect sample of an average being skewed by data on opposite ends of each other. That launch angle isn’t truly representative of what Smith was doing that year.
- Suddenly in 2018, while there are certainly still smaller spikes below 0 degrees, now the largest spike by far is at 15 degrees.
- Finally, in 2019, the largest grey spike sits below 0 degrees (hold that thought we’ll tackle that below), but the other large grey spike has suddenly shifted up another 5 degrees to sit at 20 degrees, and there is another sizable spike at 30 degrees—we’re back to getting the extreme splits. This definitely supports that he is attempting to hit more fly balls this year but I can’t bring myself to ignore that huge grey spike at 15 degrees in 2017. It was looking at these charts that first made me wonder if Smith had actually started making these changes in 2018.
- Finally the red spikes. Where are his hits coming from? It’s pretty easy to see that the vast majority of his hits come somewhere between 5 degrees and 15 degrees. That’s not unusual for a non-power hitter, but it’s important to note as it tells us where we want the majority of his batted balls to come from. Ideally when in doubt you want the largest red spike and the largest grey spike to be in the same place, much like you see in 2018.
So I feel like when you take into consideration that extremes have seemingly affected much of Mallex Smith’s launch angle data, it actually appears that he started trying to hit the ball in the air more starting as early as 2017. It all seemingly started to come together in 2018 and got skewed again early on in 2019.
2017
Okay, here’s where I suspect the genesis of Mallex Smith’s launch angle change truly began. Again some of this is due to understanding how the Rays work, especially since they traded for him as opposed to signing him. The rest of it is due to the launch angles of his batted balls. When you break down the various monthly launch angles of Smith’s batted balls from 2017 into the rough categories we used above, it becomes clear Smith was building towards something over the course of the year. Check it out.
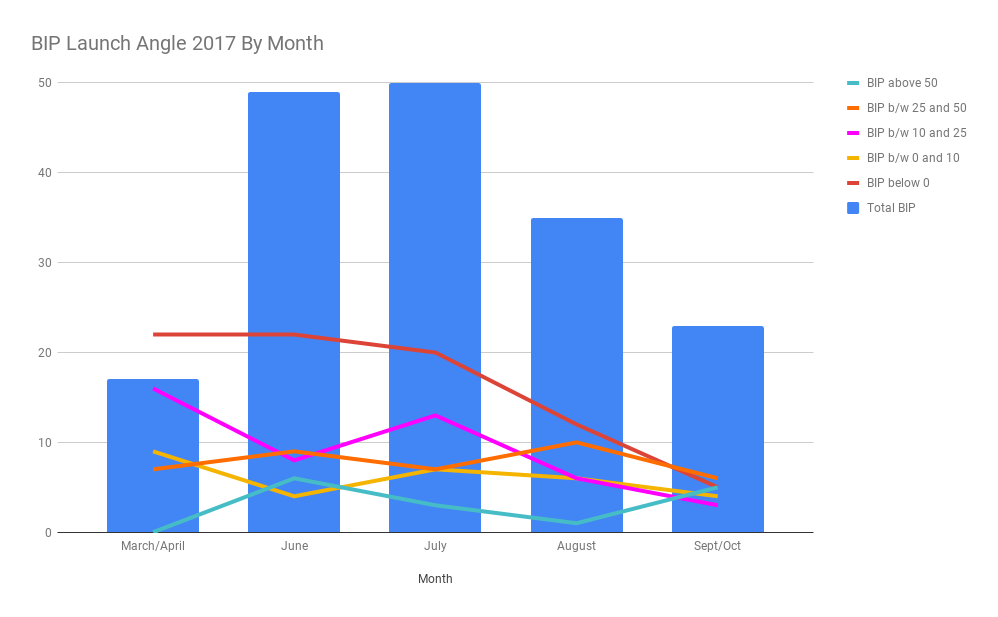
The blue bars represent Total Balls In Play (BIP) while each line represents how many of those BIP fall into each category. Notice that in March and June (Smith was injured all of May that year, hence its omission) the line representing BIP below 0 degrees is completely separated from the rest of the lines. From July onward though they begin to come closer together with each consecutive month right up until Sept/Oct. where all the lines are barely separated from each other. Seeing such a gradual reduction in BIP below 0 degrees and BIP between 0 and 10 degrees with a major bump up in terms of BIP between 25 and 50 degrees seems to indicate an attempt at hitting the ball in the air more. How does that compare with 2018?
2018
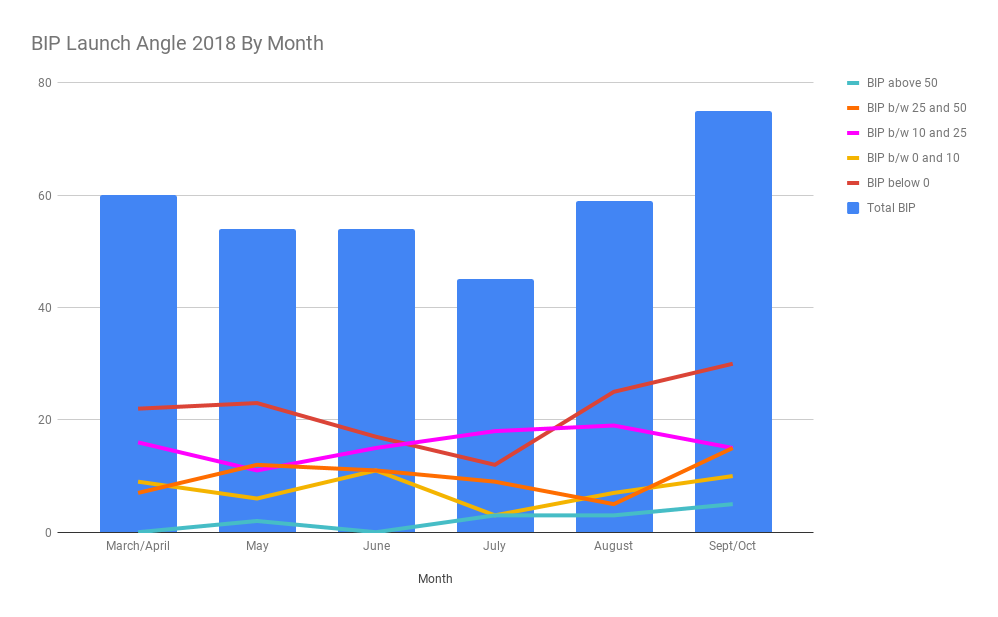
There’s quite a bit to unpack here. At no point in 2018 do we really see the lines ever meet up quite as neatly as we did at the end of 2017 (although June comes pretty close). What do see is that line drives (BIP between 10 and 25 degrees) go way up and stay up all season long. This graph is where I went from curious to convinced that Smith had started changing his approach earlier than 2019. If you divide the balls in play into balls in the air and ground balls, there were several months in 2018 where the split was practically 50/50. In fact, this was Smith’s first season with a ground ball rate lower than 50%. Yet I can already hear the question, and it’s a good one: If Smith was hitting balls in the air more than ever in 2018, how in the world did he end up with a lower average launch angle in 2018 than in 2017? Those pesky, pesky outliers. Check out the Average Launch Angle for all Smith’s BIP from 2018 divided into the following rough sections.
| BIP Type | # of Hits | Average Launch Angle |
| Below -25 | 53 | -40.4 Degrees |
| Between 0 and -25 | 76 | -12.8 Degrees |
| Between 0 and 25 | 140 | 13.0 Degrees |
| Above 25 | 78 | 43.0 Degrees |
See how they almost perfectly balance each other out? There’s just enough extra on the positive side that you can see how you end up with a 2.6 Average Launch Angle despite the increased line drives and fly balls. I mentioned before that when attempting to hit more balls in the air it’s common to get under the ball and pop it up (hence the high launch angle hits) or roll over the top and smack it straight down into the ground (leading to the extreme low launch angle grounders), especially when the player is still figuring things out (or perhaps has an imperfection in their stance, eh?) The other thing you can see (at least I hope I made a convincing enough argument) that Smith has actually been attempting to hit more balls in the air for almost two years prior to 2019. This is important. Sometimes it takes time and experience to figure out such a dramatic change and sometimes that change is gradual as opposed to dramatic. Sometimes it just takes the right teacher to help it all fall into place. This brings us to 2019.
2019
So by now, with any luck, we’ve laid out a pretty convincing argument to be made that this new and improved Mallex Smith has been two years in the making. All we (and I supposed Smith as well) were waiting for was for that last key to unlock his full potential. It seems like after his stint in AAA that he may have found that key. Let’s take a look at the overall picture.
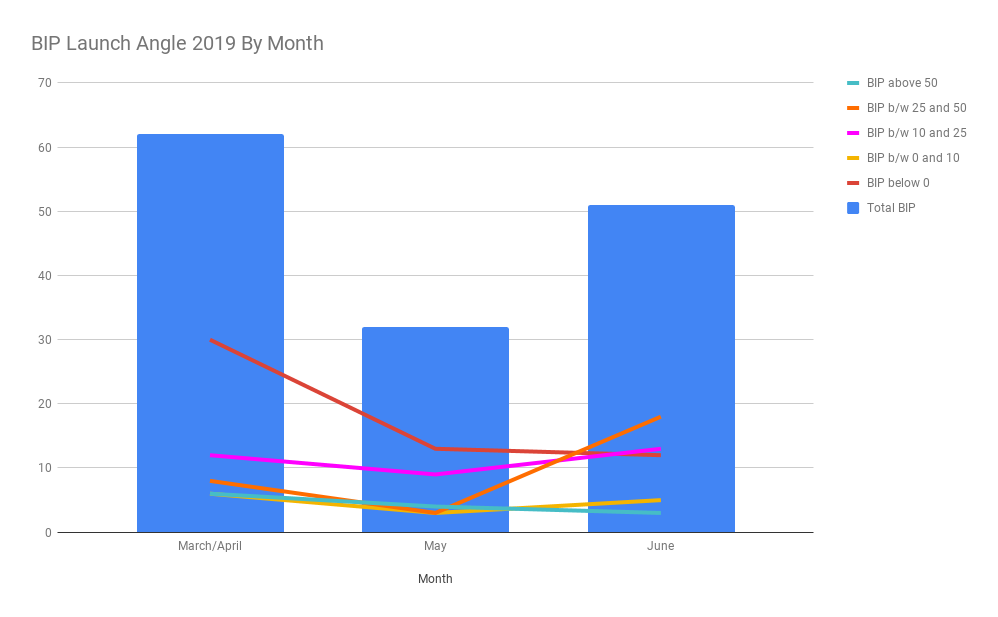
Holy guacamole Batman. March/April looks an awful lot like the springs of the previous years (where he seems to have typically struggled), but some of his struggles might have an outside explanation this time. Early on in spring training, Smith apparently ramped up his throwing schedule too early and injured the flexor bundle in his right arm, which cost him almost all of spring training. Given how he always seems to start off the season in with the same launch angle profile, it’s entirely possible that he needs that first month or so to get his swing and approach to where he wants it, but that’s mostly speculation. As we mentioned at the beginning of the piece, the Mariners sent Smith down to AAA at the end of April and he spent a few weeks getting back on track, coming back up around the middle of May. We immediately see the launch angle categories bunching up just like we want them to, as the lowering “Below 0 Degrees” line gets closer and closer to the rising “BIP between 10 and 25 Degree” line until finally the calendar turns over to June and everything explodes. Suddenly “BIP between 25 and 50 degrees” was leading the way by a large margin with “BIP between 10 and 25 degrees” coming in second and “BIP below 0” dropping all the way to third. That’s exactly what we want to see. Since June 1st, Smith has been hitting .290 with a .188 ISO and 119 wRC+ and the why is right there in that graph. The answer to how lies in the new batting stance. It certainly seems like the adjustments made by the coaches down in Tacoma were that last key Smith needed. And in case you’re thinking that this is simply small sample noise (and I admit it certainly could be), it’s worth noting that at 121 PA this stretch of excellence is longer than the putrid 95 PA stretch that got him sent down in the first place. Given all of this evidence, I am willing to make the statement that I believe this stretch is the culmination of several years of development rather than a flash in the pan. In my opinion, this is an essential distinction to make. I’m still not willing to declare causation over correlation (doing so for sure would likely be near impossible) but when you add in the gradual development angle I’m willing to move it a heck of a lot closer. I’m willing to bet this is a young player making the leap and that this new hitter we’re seeing standing in Mallex Smith’s shoes is here to stay.
I told you we’d come back to Marte! Now that we’ve established that Smith’s breakout is legit, only one question remains: What should we expect from Smith over the rest of the season? I think by comparing Smith to Ketel Marte we can get a reasonable facsimile of what Smith might be able to produce over the next few months. Before you all start yelling at me that I’m crazy, hang on just a second. As a player, Marte is in his second season since figuring it all out, while Smith is likely between a half season and a full season of putting it all together. What I want to do is compare Smith’s numbers over the last month or so and compare them to Marte’s numbers from last year, when we first began to notice Marte’s impending brilliance. Let’s check it out.
| Player/Year | AVG | BB% | K% | ISO | wRC+ | LD% | FB% | HR/FB% | LA | EV | BBL% |
| Marte 2018 | .260 | 9.3% | 13.6% | .177 | 104 | 19.7% | 29.0% | 10.9% | 5.7 | 88.5 | 5.0% |
| Smith Post 5/15/19 | .264 | 5.4% | 23.1% | .165 | 104 | 22.0% | 38.5% | 11.4% | 14.7 | 85.5 | 6.0% |
Outside of a few differences (Marte had much better plate discipline numbers last year, Smith hit far fewer groundballs than 2018 Marte, hence the launch angle difference) we’re looking at two very similar hitter profiles. It’s worth noting that Marte’s 2018 had about 400 more PAs to stabilize than Smith’s current stretch which is just starting to stabilize but we’re using the profile as more of a guideline to help determine Smith’s ROS return. Before we go to the predictions I want to compare their launch angle charts and their launch angle breakdowns to see if they line up even further. First the launch angle charts.
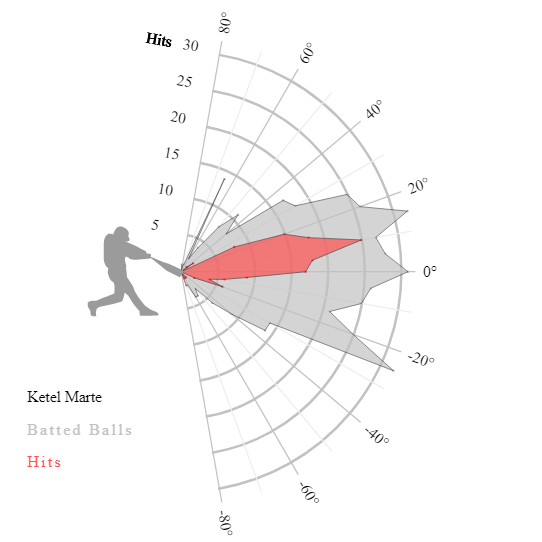
That’s definitely encouraging. We’re seeing many of their hits in the exact same spots and with similarly shaped spikes. Marte has a wider gap between his grey spikes, but the hits themselves (red spikes) and most of the overall shape should look really familiar from Smith’s 2017 and 2018 seasons and it still lines up pretty well with Mallex’s post-AAA launch angle chart. Now what about their launch angle breakdowns?
| Player | Total BIP | % BIP | BIP below 0 | % BIP below 0 | BIP b/w 0 and 10 | % BIP b/w 0 and 10 | BIP b/w 10 and 25 | % BIP b/w 10 and 25 | BIP b/w 25 and 50 | % BIP b/w 25 and 50 | BIP over 50 | % BIP over 50 |
| Marte 2018 | 408 | 18.7% | 158 | 38.7% | 55 | 13.5% | 85 | 20.8% | 79 | 19.4% | 31 | 7.6% |
| Smith Post 5/15/19 | 83 | 18.2% | 25 | 30.1% | 8 | 9.6% | 22 | 26.5% | 21 | 25.3% | 7 | 8.4% |
As you can see, Smith has hit for a greater percentage of batted balls in the highly desired “% BIP between 10 and 25 degrees” and “% BIP between 25 and 50 degrees” but they’re still pretty close. We came into 2019 very excited about Marte’s power potential and it looks like we should likely be just as excited about Smith as well. So based on this how many home runs should be expected from Smith? In 2018 Marte hit 14 HRs in 580 PA. Since coming back from AAA Smith has amassed 13o PAs in 29 games. If he continues at that pace over the remaining 85 games, he should end up putting together 381 more PAs. If we accept the premise that he will continue to hit at a similar home run rate as Marte did last year, then we can expect him to hit roughly nine more HRs which would give him a total of… 14! It would be an incredible boost to Smith’s value in this stolen base starved environment if he were able to break the double-digit mark.
Speaking of stolen bases, what does all this mean for Marte in terms of his SB total for the rest of the season? It sounds so simple but the more often you end up on base, the more often you get a chance to steal a base. From March 28th to April 30th when he was sent down to AAA, Marte got on base 25 times and attempted nine stolen bases (eight successes) or roughly an attempt every 2.78 times on base. After his return from Tacoma, he got on base 35 times and attempted 11 steals (10 successes) or once about every 3.18 times on base. That gives a total of 20 attempts over 60 times on base, which puts him on pace to attempt a stolen base once every three times he gets on base. If we want to extrapolate his current rate at getting on base (including outs where he ends up on base) over the predicted 380 PAs, we end up with Smith getting on base 95 more times which would get him somewhere around 32 additional stolen bases for a total of 50 stolen bases. Even if Smith only manages to hit .265 but steals 50 bases with double-digit home runs, that’s wins-you-your-league kind of production. What if he continues hitting the way he has been for the last month? As mentioned before, Smith has gotten on base 35 times in 130 PAs. Stretch that out over the remaining estimated 380 PAs and you get two more stolen bases to raise his season total to 52.
I think it’s perfectly reasonable to expect Smith to finish 2019 with a .270 AVG line with 10-12 HRs and 40+ SBs. That’s a must-start, game-changing player. Want to know the truly crazy part? He’s still sitting out there on a ton of waiver wires. Yahoo currently has his ownership rate at 55%, while CBS and ESPN have him down as 67% owned. He’s worth adding for the stolen bases alone, even if the power doesn’t stick around. I truly believe that it will though. Smith has been improving his hitting approach for years and it’s all finally coming to a head. Go get this guy before everyone else realizes that he’s already breaking out and reap the sweet stolen base rewards.
Featured Image by Justin Paradis (@freshmeatcomm on Twitter)
Despite our deeply rooted rivalry, I must commend you on the great piece on Smith. I’ve personally been focused on his ascent to the top of the order while having very mild concern for the drop in his walk rate.
Speaking of, do you think he can get back to taking walks? It’s the one thing he can do that teammate Dee Gordon can’t, and I feel that it’s the one tool he needs to permanently secure the top spot in the order (because if he doesn’t and Dee takes it back, they’ll likely drop Smith to 9th).
That is high praise indeed coming from my archnemesis! Thanks so much Scott! I think he absolutely can get those walks back especially His BB% was actually above his career averages in March/April and it’s only dropped down to 5.2% since coming back from Tacoma. 3 or 4 more walks over that time period and he’s right back to his career norms so I definitely think as he gets more comfortable with the new swing, we’ll see it swing back to normal. I also suppose with trading Encarnacion now that they’ll be in full rebuild mode and which gives me hope he’ll have a longer leash to let him figure things out.
FYI, something I rarely see mentioned in articles about Smith’s resurgence is the fact that he decided to spend 3 days with his Florida-based private hitting coach Frankie Colon to work on mechanics before heading to AAA Tacoma.
Smith is a FL native (wears a necklace with the state’s outline every game,) so I think a combo of getting injured, not having access to his personal coach, and leaving his home and family in sunny Florida to play in the Northwest in the early spring is probably more of a shock than many others who get traded have to deal with. Those 3 days had a significant impact, he says.