


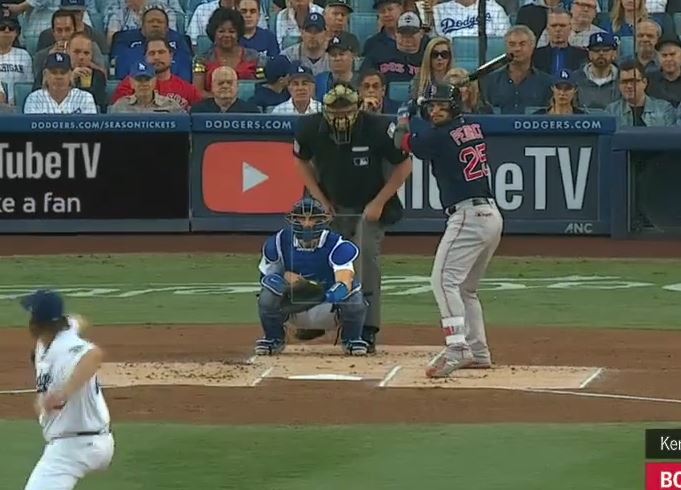
(Photo by Quinn Harris/Icon Sportswire)
First, congratulations to the 2018 World Series Champion Boston Red Sox! I’m sure by saying that I’ve already turned off any Los Angeles Dodgers fans that might happen to read this. Probably for the best because I’m sure they know where this is going. In any case, let’s look at some prime examples of bad location (and some weak Effective Velocity spreads) home runs— the events which steered the outcome of game five.
The first home run hit last night was a first-pitch two-run shot from World Series MVP Steve Pearce off of Dodgers starter Clayton Kershaw. As a hitter, you should be aware of the fact that 83% of the time you’re going to get either a fastball or slider from Kershaw. That being the case, batters would theoretically approach their at-bats knowing their attention should be from 86 MPH to about 90 MPH. The reason being is that (in 2018) Kershaw’s average velocity on his two main pitches are 92 MPH (fastball) and 88 MPH (slider). Kershaw does mix in his curve (74 MPH) but I feel as though that pitch is pretty easy to identify because of how much ‘hop’ it gets from his release. Not to say this isn’t a good pitch; it has a great break and fools a lot of hitters. It’s just that it doesn’t seem to tunnel well with his fastball (at least not recently).
So Pearce is looking for something in that 4 MPH velocity range (give or take a MPH) I explained before. And what did he get? A fastball right where his second-highest exit velocity sits (Chart 1, vs LHP) and right around his ‘hitters attention’ zone. In terms of Effective Velocity, the pitch sat around 89 MPH.
[gfycat data_id=”JubilantSereneDuckbillcat”]
As you can see, Pearce walloped a pitch that was intended to be low and away; a location that Pearce struggles with (see below).
Instead, Kershaw’s 92 MPH fastball missed its mark and landed in the spot where Pearce hits the ball well and was able to get good extension with his arms.
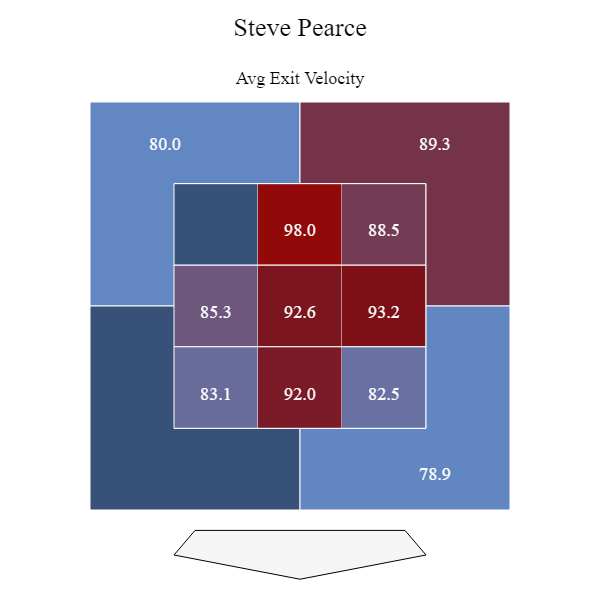
CHART 1
The next home run was hit off of Red Sox starter David Price. The catcher appeared to want the pitch to land in that general location (see the gif below), so Price can’t be ‘punished’ for missing his spot; David Freese just beat him. Another first-pitch hit in almost the exact location of the Pearce home run, this time by David Freese. Chart 2 shows Freese’s ISO average versus left-handed pitching, with attention paid to middle away.
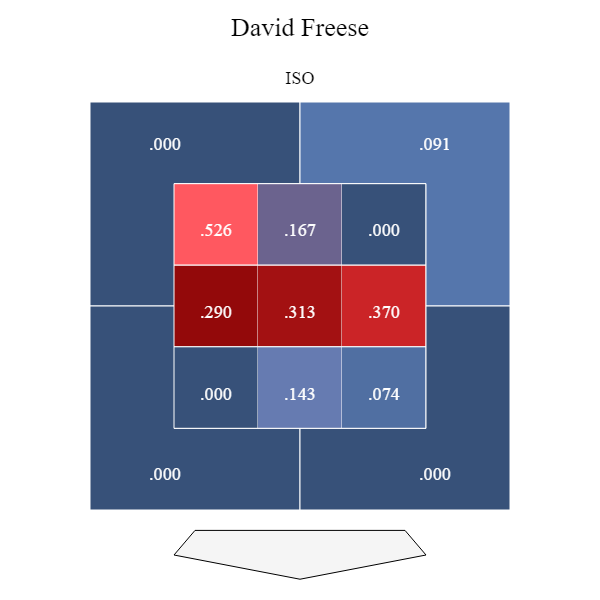
CHART 2
[gfycat data_id=”ThreadbareCreativeBluebottlejellyfish”]
The same theory that applied to Kershaw is also tied to Price; same velocity range, same hitter’s attention zone. Freese saw his ideal pitch and ran with it, giving the Dodgers their only run of the evening. He had it timed pretty well; 94% of his potential power.
The next home run came from Mookie Betts, again off of Kershaw; an 89 MPH slider that ended the 0-13 slump Betts had himself in. This situation was a little different. In the first gif below, Kershaw needed to get the ball down a little but missed and hit middle zone. Betts fouls the pitch off; big break for Kershaw.
[gfycat data_id=”UnitedAnxiousHornet”]
The next pitch, Kershaw hit his mark but it didn’t matter; Betts was ready and hammered the pitch for a solo home run.
[gfycat data_id=”ShockingLightheartedBonobo”]
The big ‘no-no’ here is that Kershaw, through the lens of effective velocity, offered the same speed to Betts on both pitches. The first gif shows the pitch landing in the ‘null’ zone; no effect on ‘gross’ velocity. The second was clocked 2 MPH faster but the EV brought it back to 87 MPH. Betts was able to quickly adjust and beat Kershaw on a pitch that landed where his exit velocity is highest against southpaws. Perry Husband was probably frenzied!
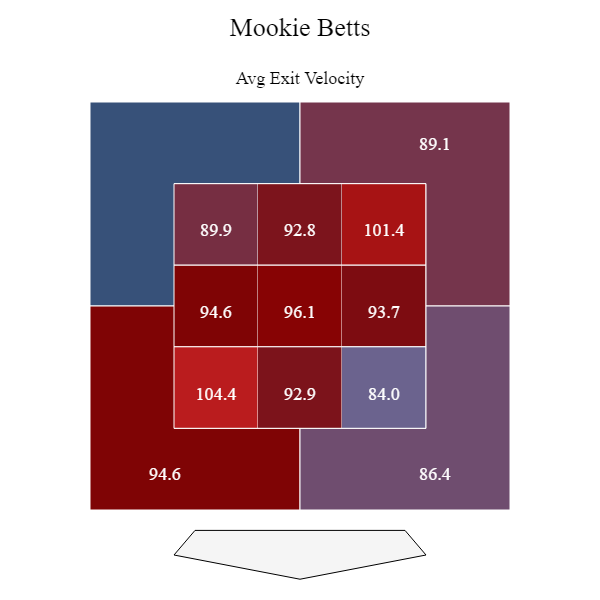
CHART 3
It also must be noted that Betts loves sliders from lefties. In 2018, he hit .429 with a .714 ISO against the pitch. Hard to read too much into that factoid since we don’t know the context of when those pitches occurred and in what part of a sequence. But still, Kershaw and the catcher should have known better. Betts was due and he broke out of his slump in the biggest way possible, causing the Win Probability to swing heavily in Boston’s favor.
And Kershaw would get burned again.
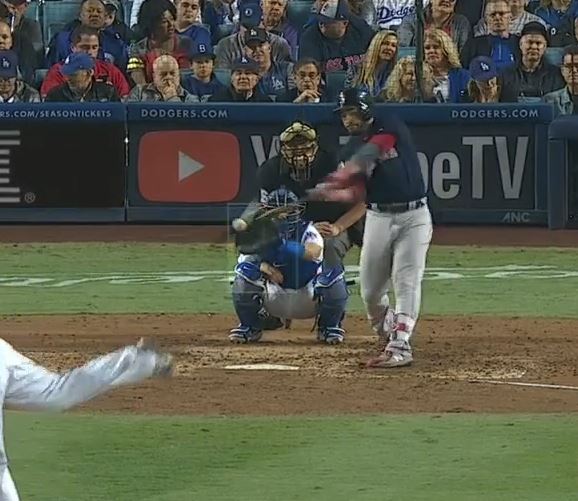
This time, J.D. Martinez was the attacker. However, Kershaw did a few things right during this at-bat– he spread his (effective) velocity well and created a nice tunnel, as you’ll see in the overlay part of the gif below.
[gfycat data_id=”RectangularPossibleAmberpenshell”]
Kershaw’s velocity spread (according to the radar gun) was just 2 MPH (90-88) but the effective velocity spread was 10 EvMPH (93- 83). Yet Kershaw faltered in his location of the pitches; Martinez took the pitch two (slider) strike low and away (not the best location for Kershaw; see Chart 5) but then unloaded on the fastball that ended up in a zone where his ISO is .900 against LHP. Martinez has been hitting the fastball well as of late, so part of the explanation could be he was sitting on that pitch and got the perfect one. Notice his body language lines up perfectly on both pitches (foot drop, etc).
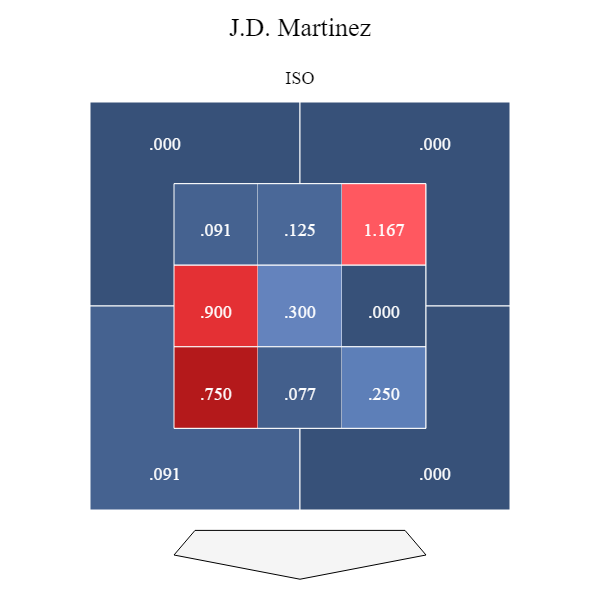
CHART 4
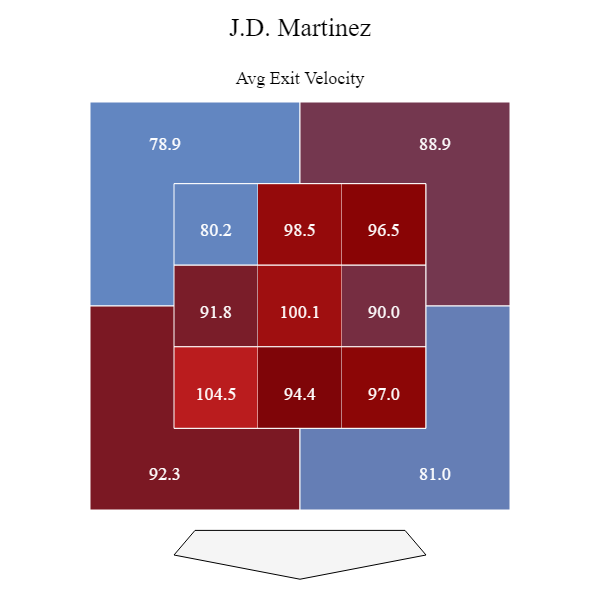
CHART 5
Even before this point, the game was pretty much already over. Hindsight 20/20, but Kershaw could have kept the game closer had he made some better choices against the three biggest hitters in the Red Sox lineup.
After that, Dodger reliever Pedro Baez came in and gave up Pearce’s second home run; the final nail in the coffin for LA and sealed the deal for his MVP honor. This one doesn’t fit the narrative as good as the others but is worth mentioning if only because he hung the changeup and Pearce saw it coming a mile away; he drove the pitch at nearly 100% of his potential power. The screenshot below shows he hit the pitch close to the perfect point, perhaps because he was geared for something a little bit faster. Pearce was able to get his arms extended and hit the pitch right off the sweet spot of the barrel.
Nitpicking? Maybe. But the figures presented here show that there were better velocities, sequences, and most importantly, locations that might have changed the course of this game; mainly because it was home runs, not scrappy singles or timely hitting, that dominated this game.
Well done Sir…………….. Spot on. Kershaw has a very basic pitch plan that is steeped in analytics but missing the most important elements that the Ev Microscope shows. Ev is ‘Liquid Analytics’ that measures timing as it happens, pitch by pitch. Kershaw’s recent failures are strategy based. The slip in performance has nothing to do with his ‘stuff’ but rather everything to do with how he used that stuff. This approach is missing key Ev elements that can only be seen through the Ev Microscope. He will be back when he implements a more Ev-Centric approach. Great piece.
It’s difficult for me to believe that Kershaw’s recent slip-ups have nothing to do with his stuff.
One of the most evident relationships in baseball is how a four seamer gets exponentially better with velocity (along with smart location at the top of the zone). Kershaw’s lost a lot of velocity on his four seamer this year. That will definitely have a big negative effect. If the fastball to Pearce in the first was 94 MPH maybe it isn’t a homer. And to your point about effective velocity – I’m sure a faster overall four seamer helps increase the spreads and deception on all the other pitches.
Still a great pitcher, and still in line for a big contract if he opts out. But there are definitely some warning signs.
Fair enough and thanks for the feedback; I get where you’re coming from. You can have high velocity but if you can’t locate effectively and/or can’t match it with a spin rate that makes for a good Bauer Unit score (allowing you to keep the pitch up without too much break; Magnus effect), it doesn’t help all that much.
“…along with smart location at the top of the zone”
Bingo! That’s exactly what we’re getting at; he wasn’t doing that enough. And yes, he’s lost an average of 2 MPH on his four-seam in 2018, but keeping it up in the zone (mainly up and in) is what would help him compensate for that drop in velocity. Then he can use his slider and/or curve off of that pitch (slider away, curve somewhere down under the FB trajectory) and suddenly the fastball becomes much more of an asset (personally, I feel he should have used a changeup more this year as it can work better with the FB and SL). Being able to locate correctly in relation to EV and also hide off-speed and breaking pitches (tunnel) matters more (IMHO) than how hard you can throw.
I’m with you on the location in the upper part of the zone. Swinging strike rates on four seamers are 5x higher in the upper third than the lower third, so pitchers who can routinely dot their pitches up there are at a big advantage.
With that said, when you stratify by velocity, the relationship is too obvious to ignore. The correlation coefficient between four seamer velocity and swinging strike rate is very high. For instance, a 97-98 MPH fastball in the upper part of the zone might have a 25% swstk, where as a 90 MPH fastball will have a 12%.
Spin and some other things will alter that a bit, but strict velocity is still very important.
Absolutely important but I see it as a bit overvalued. Simply looking at swinging strikes only applies value to the pitch itself, not the actual plate appearance event, which is the only thing that matters; the context of the strike (whiff, etc)- when was it thrown in the sequence?
Lots of good pitchers throw lower 90s fastballs and are successful because they know how to sequence and where to go with what pitch. Kershaw made too many mistakes because of that (coupled w bad location) and had he been more ‘EV aware’, he wouldn’t have faltered as much as he did. And it isn’t solely about strikeouts and whiffs, but just as much about timing disruption and weak contact.
I think there are completely valid points from both of us but we just share a different perspective which is totally OK with me because you made me think a bit.