


Colorado Rockies starter Kyle Freeland is ready to become an ace. Drafted 8th overall in the 2014 Amateur Draft, his Fangraphs Prospect Report rates his command and slider at 60 and his fastball a 55. His curveball (40) is seen as his weakest pitch with his changeup rated average (50). We here at Pitcher List currently have him ranked 34th.
In 2018, Freeland greatly improved. He more than doubled his WAR, increased his K/BB rate (2.47), and saw both his chase and whiff rate rise. The only repertoire change that Freeland made was his increased four-seam fastball usage at the expense of his sinker. The sinker turned out to be a liability in 2017 and his slider was pretty mundane. His four-seam, though used much less his rookie year, was his most effective pitch. Using his four-seam more in 2018 often complimented (improved?) his slider effectiveness; his sinker also bore the fruits of improvement.
So why Freeland? What makes me think that he could rise even higher in 2019? Well, for several reasons that the chart below provides. First and foremost, the most effective spot to attack a hitter with your fastball is up and in. Throughout the last two seasons (minimum 2000 pitches) no one did it more than Freeland. Right behind him is reining 2018 Cy Young Award winner Jacob deGrom, along with the elite arms of Chris Sale and Josh Hader. I also feel compelled to point out that there are also some very ‘meh’ pitchers and a few ‘blah’ (I’ll speak to that later on).
Moving on, I’ll need to give a bit of context to this chart. When I looked into elevated pitches, I took the two-year totals of both right-handed and left-handed pitchers who threw up and in to the respective-handed batter. The pitch ‘#’ is that total and the ‘Pitches’ section is total fastballs thrown for each season as well as the pitch’s total value (pitch info data) alone and scaled to 100 pitches (wFB/C). The Avg EV, BAA, and % is in relation to JUST elevated fastballs, NOT all fastballs.
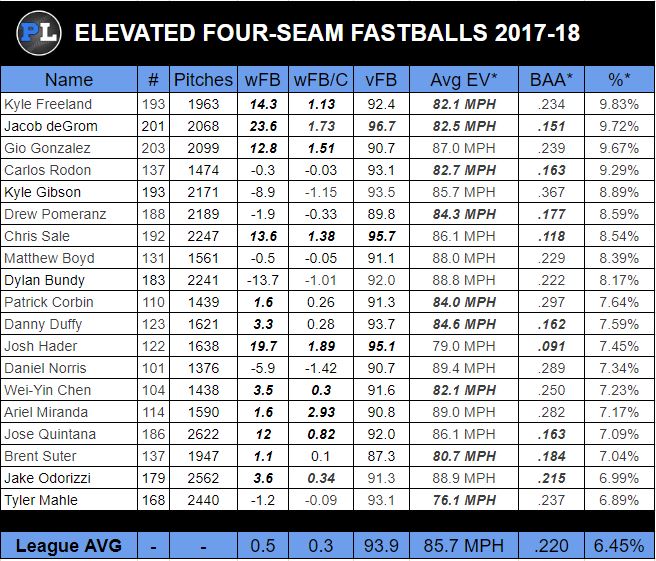
(italics are better than average)
During his first two seasons, Freeland faced an unbalanced amount of right-handed hitting- 78% to be exact. For the purposes of this article, we’ll keep our focus on RHH data. While we can’t completely discredit his performance against left-handed hitters but we would be dealing with a much smaller sample.
I mentioned before, (potential) control is one of Freeland’s assets. In 2017, his BB/9 was at almost 4 but that figure was lowered to below league-average in 2018 (3.11). What’s more, Freeland pitched something like 50 more innings in 2018 which resulted in 67 more strikeouts with just seven additional walks. Freeland is improving in terms of control and that lends itself to being more accurate when it comes to locating pitches, the importance of which I’ve preached about before.
Speaking of location, let’s get a general idea of where Freeland throws and what the results are. Below are charts which reflect his data against RHH in 2018.
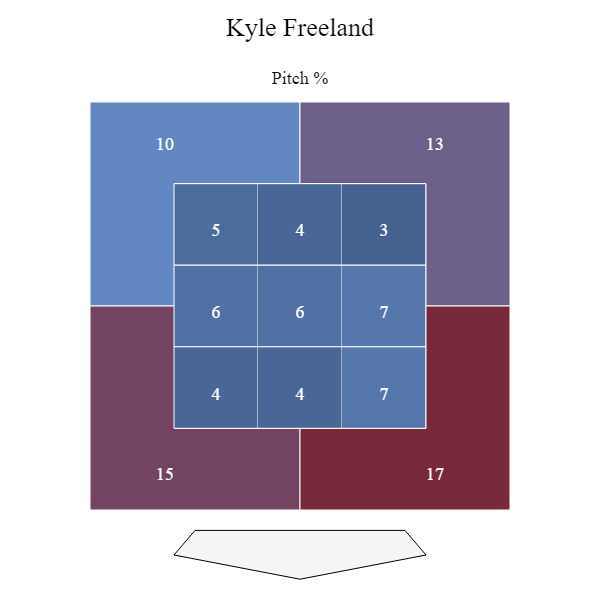
CHART 1
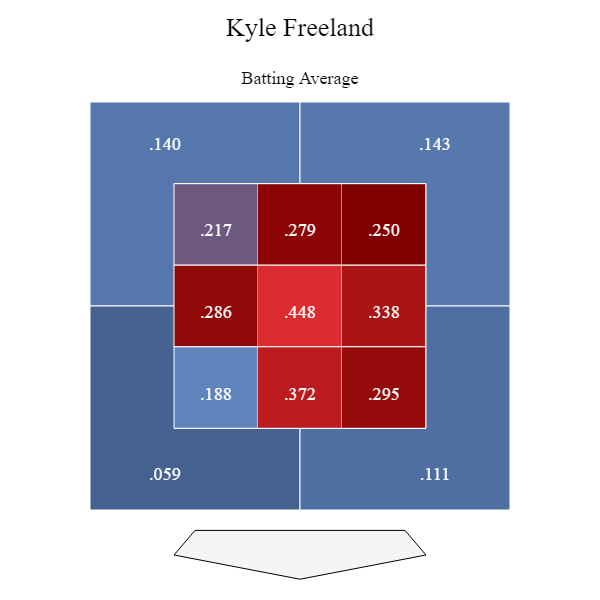
CHART 2
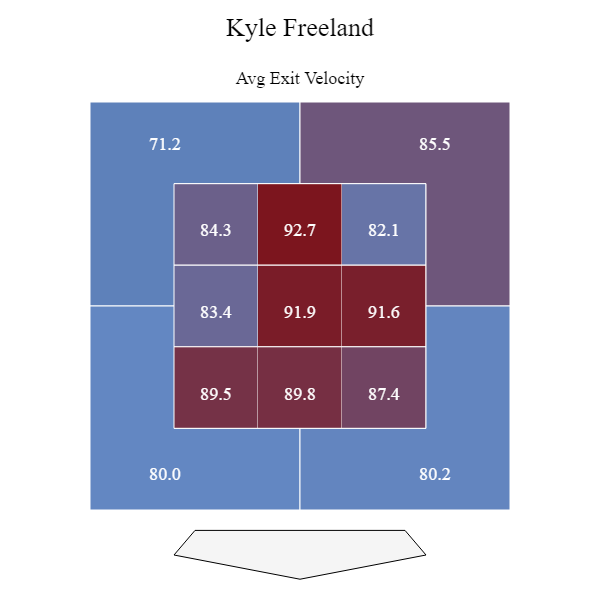
CHART 3
So, to oversimplify, Freeland is best when throwing up and in as well as down and away. The idea is knowing what pitch should go where.
Let’s start with Freeland’s best pitch, the four-seam, which was rated 10th overall (wFB) in 2018, minimum 100 IP. Interestingly, hitters produced a .254 batting average on Freeland’s fastball, context neutral. Since batting average only accounts for when hitters actually make contact with the pitch, we could presume that his pitch is rated as high as it is because he’s aware of how/when to use it, but tends to make a few too many mistakes.
Here is Freeland’s fastball BAA by zone. Those ‘mistakes’ occur mid or down and away in the strike zone. When Freeland keeps the pitch inside, the results are much better.
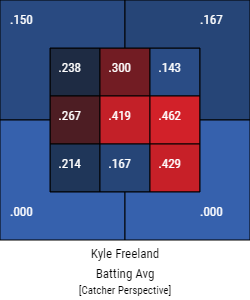
CHART 4
So what about exit velocity (85 MPH overall average)?
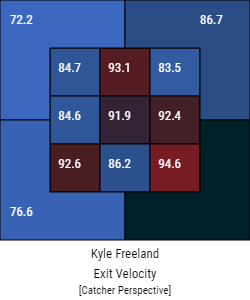
CHART 5
Again, the same results apply. Given the proper launch angle, home runs start surfacing around 90 MPH exit velocity. The hardest hit fastballs are right in the areas where the hitter can get his arms extended the most.
I don’t like putting a lot of emphasis on contact data because it’s so difficult to say under what circumstances they occur. Did Freeland throw three fastballs in a row to the same area (away), only to have the hitter catch up and crush it? In the lower metric zones (up and in), did Freeland get that result because he mixed his pitches well or is it simply because the hitter couldn’t time the pitch correctly given the Effective Velocity time units in play, for example?
So what about fastball whiff rate against righties in 2018?
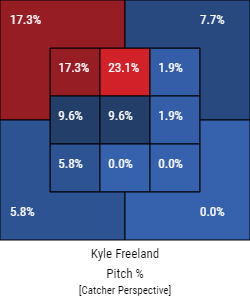
CHART 6
It’s pretty definitive that Freeland’s fastball works best up and/or in to righties, which feature the lowest zone BAA, exit velocity, and whiff rate. Just to be certain we aren’t skewing that argument with small samples, here are Freeland’s overall location tendencies for his fastball (RHH).
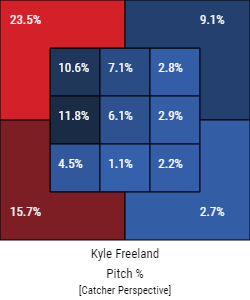
CHART 6
It’s clear that Freeland is aware of what he needs to do with his fastball against righties. But that’s just part of the story. What about his other pitches? Is he creating an effective pitch ecosystem? Does he mix his pitches well? What about properly spreading (effective) velocity, as Ev creator Perry Husband preaches in his pitching philosophies?
As for his pitch mixes, Freeland has demonstrated the ability to be liquid with his pitch selection. Just 40% of his pitches are fastballs, followed by 29% sliders, 14% changeups, and 13% sinkers. Freeland drops a curve in just under 5% of the time but we’ll ignore that pitch. Chart 7 shows how well he keeps hitters off-balance.
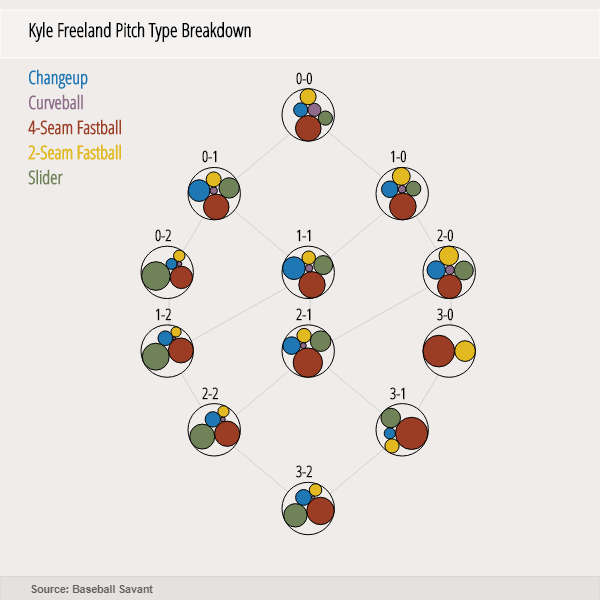
CHART 7
The only time disparity occurs is when Freeland is deep in the hole against a hitter. However, Chart 8 shows how rarely that occurs and you can see that he’s is typically ahead of hitters.
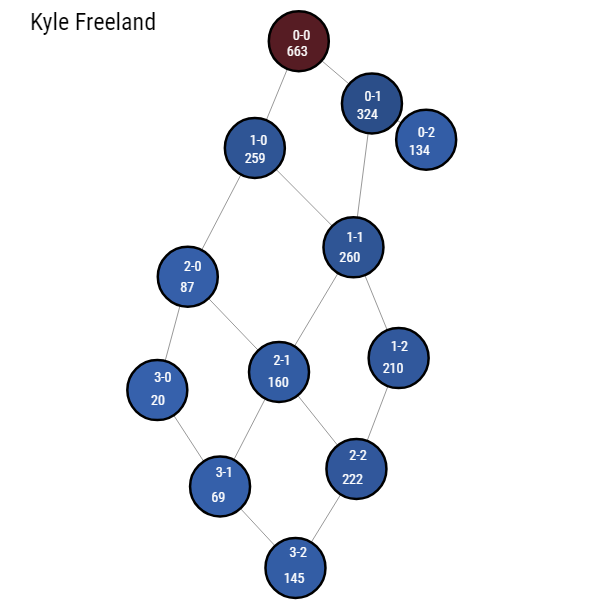
CHART 8
For his slider, Freeland tends to place the pitch middle zone. It doesn’t work- hitters average over .400 with a 90MPH+ exit velocity.
Freeland gets the vast majority of whiffs when he throws it down and in (58%) most of which occur out of the zone (51% overall). While the exit velocity is lower, it’s still a bit high for a low breaking pitch.
One issue that Freeland has with the slider is its below average movement (H= 85 and V= 97) according to Brooks Baseball’s Pitch IQ (keep in mind ‘below average’ doesn’t mean bad, it just indicates that it doesn’t move as much as other sliders). He has to be more mindful to locate it properly and use it in the right manner. When he does, he effectively spreads velocity with the prior pitch, and when he doesn’t, it’s a bane to his liquidity. He doesn’t seem to get ‘lucky’ with it; if he did, there would be more of an even spread on his zone metrics.
His changeup is kept away from righties. It still was still valued below average in 2017 but it improved in 2018. When the pitch ends up within the strike zone, hitters are very successful- almost all zones are .300+ BAA. The ideal location for his changeup is down and away (ideally near the edge) because exit velocity and batting average drop significantly while the whiff rate is by far the highest of any other zone.
I won’t give his sinker/two-seam much analysis because its usage would appear to be slowly phasing out or at least greatly reduced. Nevertheless, for argument’s sake, he needs to keep the pitch low in or out of the zone. That’s where he gets his best results.
The below at-bat demonstrates the ideal ecosystem in terms of sequencing and location for Freeman. After starting with a changeup outside for a ball, Freeland goes back to that location and nibbles at the zone with a pressure pitch changeup for a strike. Yes, the umpire was a little liberal but credit his catcher for framing. Then Freeland draws a foul-tip on the slider low and away, after which he finishes the hitter off with a high four-seam fastball.
Here are the three pitches overlayed with trails. The placement of these pitches, along with the decent tunnel and the sequence, follow Ev 101 and kept at least 6 EvMPH between each pitch. The figures using Ev Time Units are as follows: Changeup, 85 EvMPH > Slider, 79 EvMPH > Fastball, 96 EvMPH
Freeland won’t blow hitters away with a low-90s fastball and he doesn’t have to because he’s (at least) mildly aware how to use it to best suit his gameplan. What’s more, using Effective Velocity principals, he can add as much as 5 MPH to the pitch to make hitters have to time it as a 98 MPH fastball if they want to regularly make good contact (barrels, liners, burners, etc).
Going back to the elevated fastball list at the top, I want to point out that simply elevating your fastball isn’t enough. As you can see, there are plenty of pitchers on that list with negative fastball value. Most of them don’t sequence properly or vary their pitches enough. If you pound fastballs in a particular zone maybe three times in a row, a hitter is going to catch up especially if you don’t demonstrate liquidity with your pitch selection. This isn’t a hard and fast assessment, simply an assumption based upon the fact that the pitchers on that list who do well with their fastball tend to keep hitters guessing more.
Something I have yet to mention but is nonetheless key for Freeland to transform himself into a bonafide ace is to tighten up his release points. His fastball and slider are too far apart and don’t seem to tunnel well under his current mechanics. Freeland’s horizontal release points for those pitches approaches a half inch difference on average with his vertical points nearly three-tenths of an inch. Of course, that seems fairly minuscule on the surface but you have to take into account that there are sometimes large deviations that not only could tip a hitter off but make it nearly impossible for him to tunnel when the time is right to use them in tandem. The changeup and fastball are a bit closer, but still not ideal. Given the prowess with which he can dismantle hitters up in the zone, having the ability to hide his secondary pitches behind the fastball (or vice versa) will give hitters all kinds of fits. Take into account how successful he was in 2018 without these proposed adjustments and consider how much filthier Freeland could be in 2019.
(Photo by Russell Lansford/Icon Sportswire)
I feel like Freeland walked a tightrope for a lot of 2018. 82.8% LOB rate. A significant amount of pitches outside the strike zone going for called strikes. Improved but still mediocre O-swing and SwStk rates.
He’ll need to do a lot to avoid a hard regression in 2019. I’ll be avoiding him.
Is there a metric that can estimate a pitcher’s liquidity and sequencing ability?
I get where you’re coming from but I have to respectfully disagree with the tightrope assessment and how he’s looking at some hard regression. I’d like to attempt to counter what you had to say.
I’m assuming you’re implying that his LOB rate isn’t maintainable? I’m curious to understand how you are certain he can’t replicate it. He’s 25 years old and pitched for just 2 years; plenty of room for improvement. Yet I don’t think either of us has enough data to ascertain that he can or can’t do it again. If you can demonstrate that LOB rate isn’t predictive and/or indicative of regression, I’ll gladly concede. In conjunction with that, his BABIP was only slightly lower than league-average and I acknowledge his HR/FB rate is pretty well below league-average but he tends to induce weak contact especially when he elevates his fastball which neutralizes the ‘launch angle swing’ (BABIP and HR/FB are significant factors to consider when citing LOB rate).
I agree he got a bit of umpire help but that’s mostly due to Tony Wolters who is one of the best pitch framers in baseball. There are several established and successful pitchers who are within a few tenths to one percentage point of his 4.3%. Furthermore, less than 1% of those called strikes were irrefutably balls (see the second reply to your comment). In any case, having roughly 4 out of everyone 100 pitches erroneously called strikes isn’t going to have a significant impact on your performance. It’s simply not a referenceable amount even when considering league average.
You don’t need to have an elevated chase or whiff rates to be successful. It certainly helps but not that large a factor when ascertaining overall success. There is a whole legion of pitchers who rely on contact and do very well. As I mention in the article, he has a low 90s fastball and limited movement on his slider. Once he realizes how to make them work together, of which he seems to possess a rudimentary understand, he’ll take a big step forward.
The closest thing you can come to measuring liquidity would be to look at pitch usage figures or perhaps pitch type by count. An example- if you throw your fastball at or near 50%, you have a level of liquidity. When decisions (sequencing) are improvised to achieve the desired outcome, it’s very difficult to quantify. I’d encourage you to read my interview with Perry Husband or Carlos Pena’s recent MLB Network presentation to get a better understanding of liquid analytics.
Thanks for the feedback!
https://baseballsavant.mlb.com/statcast_search?hfPT=&hfAB=&hfBBT=&hfPR=called%5C.%5C.strike%7C&hfZ=11%7C12%7C13%7C14%7C&stadium=&hfBBL=&hfNewZones=&hfGT=R%7C&hfC=&hfSea=2018%7C&hfSit=&player_type=pitcher&hfOuts=&opponent=&pitcher_throws=&batter_stands=&hfSA=&game_date_gt=&game_date_lt=&hfInfield=&team=&position=&hfOutfield=&hfRO=&home_road=&hfFlag=&hfPull=&metric_1=&hfInn=&min_pitches=1000&min_results=0&group_by=name&sort_col=pitch_percent&player_event_sort=h_launch_speed&sort_order=desc&min_pas=0#results_pitchChart_name_607536_
The median LOB% is 73-74% and the highest LOB% any starter will have over an extended period is around 80-81% (with that upper range reserved for high strikeout pitchers). Freeland’s pitch-to-contact profile is not emblematic of a guy who will sustain an 80% LOB rate.
As a result, Freeland’s nearly 83% figure from last year will likely regress, probably somewhere to the mid-70% range. If Freeland’s 2018 LOB% were 76%, which is still slightly above average, he would have given up an extra 17 runs, which would have increased his ERA from 2.85 to 3.61. He benefited from a significant amount of sequencing luck last year.
I admit the balls called strikes argument is less solid, however, it’s still there. Good call on Wolters – I didn’t think of pitch framing. However, who knows how long Wolters will be around? And pitching success is cumulative. When you consider Freeland’s LOB% luck, and favorable called strikes here and there, it begins to paint the picture of fragility in Freeland’s performance. Small changes in a negative direction could end up having big consequences (e.g., that pitch previously called a strike is now a ball, and the count is 2-1 instead of 1-2 with runners on 2nd and 3rd. I suspect the run probability scenario changes big time based on that).
Chase and whiff rates are signs of a guy who gets Ks and limits BBs. Freeland’s 3.11 B/9 rate and 2.47 K/BB add to his fragility. No pitcher is sustaining a sub-3.00, or even sub 3.50 ERA, in today’s MLB with those rates, especially pitching in Coors (since 2015, min 600 IP, the only starter with a sub 3.50 ERA and a K/BB less than 3.00 was Carlos Martinez).
All of these new ways of evaluating pitching are definitely great. And I don’t want to paint the picture that we should just rely on stats. However, stats like K%, K/BB and SwStk% matter. Over the long haul, there are certain thresholds that pitchers must meet in them in order to ensure sustained success.
OK, I see your argument much clearer now and it makes perfect sense. Gives me a few things to reconsider but ultimately I’m more concerned with the high-ceiling potential he has with what he demonstrated last year, especially if he can elevate himself to an ‘Ev201’ pitcher (doubt he’s even remotely aware of how he’s messing with Ev).
Ultimately, Freeland was picked 8th overall for a reason and while regression is totally possible, maybe probable based on your assessment, it doesn’t mean (to me) that 2019 will be a make or break year (keep in mind this piece isn’t anything to do with his fantasy value).
He has a long career ahead of him and I was really impressed with how composed Freeland was when he neutralized the Cubs last fall with basically just a fastball and slider. See the link below this comment and notice how liquid he was, especially deep in counts (3-2). Hitters didn’t know what to expect (hitters were never at any advantage; no 3-1 or 3-0 counts) and that is key if you don’t have killer ‘stuff’.
Thanks again for the feedback.
https://baseballsavant.mlb.com/statcast_search?hfPT=&hfAB=&hfBBT=&hfPR=&hfZ=&stadium=&hfBBL=&hfNewZones=&hfGT=PO%7C&hfC=&hfSea=2018%7C&hfSit=&player_type=pitcher&hfOuts=&opponent=&pitcher_throws=&batter_stands=&hfSA=&game_date_gt=&game_date_lt=&hfInfield=&team=&position=&hfOutfield=&hfRO=&home_road=&hfFlag=&hfPull=&pitchers_lookup%5B%5D=607536&metric_1=&hfInn=&min_pitches=0&min_results=0&group_by=name&sort_col=pitches&player_event_sort=h_launch_speed&sort_order=desc&min_pas=0#results_circlePack_name_607536_
Not a comment on Freeland, but any chance you can dive into Rodon? I am struggling with why he is ranked so low. I realize he stunk it up in September, but he was looking great in July and August, and he has the pedigree being (I think) the #2 overall pick, and now in his (again, I think) 3rd year in the league, I feel like his upside could be tremendous. I don’t see how he can be ranked so low?
Can you do a piece on Newcomb please?