


I’ve been faced with many offseason conundrums that, until recently, I’ve been unable to resolve. What happened to Matt Carpenter, Rhys Hoskins, and Jesús Aguilar in 2019? Why did these studs from 2018 suddenly turn into pumpkins?
Of course, there will often be many reasons. Take Carpenter, for example. His average exit velocity dropped 2.6 mph, strikeout rate rose, walk rate dropped and, according to Baseball Savant, his fly-ball and line-drive rates fell while his ground-ball and pop-up rates increased.
But one reason that’s less salient is Carpenter’s proclivity for hitting pulled fly balls hard declined substantially. In 2018, he had the fourth-highest pulled hard-hit (95 mph+) fly-ball rate of all hitters—8.5%. In 2019, that rate was cut by more than half to 3.1%. Having hit two-thirds of his home runs this way in 2018 (24/36), he was only able to produce seven such pulled hard-hit fly-ball home runs in 2019.
We typically explain how certain hitters outperform their expected home run totals (in light of their barrel rates and other power peripherals) by pointing to directionality. For instance, I’ve noted that Alex Bregman was able to hit 41 home runs in 2019 despite a suboptimal barrel rate because he pulled a lot of fly balls. He didn’t always need to barrel the ball to hit home runs because the fences down the line are shorter than in center.
That all raises multiple questions. To wit, are hitters who are overly reliant on hard-hit pulled fly balls in one season doomed the next? Are there certain hitters who are particularly adept at this and able to buck the trend? In particular, I was interested in determining whether players who cluster a disproportionate amount of their hard hits as pulled fly balls were able to repeat that phenomenon in the following year.
Background
Here’s the ten-thousand-foot view. In 2019, there were 6,776 home runs, 87.3% of which were fly balls. Fly balls are also repeatable, whereas line drives are more often the product of luck, with line-drive rate taking far longer to stabilize. Accordingly, I focused on fly balls. Of the 6,776 home runs in 2019, 3,383 home runs were pulled fly balls. And of those, 3,195, or 94.4%, were hit “hard” (95 mph+). It made sense, then, to consider only those pulled fly balls hit at least 95 mph; otherwise, this study would be impacted by the substantial number of pulled fly balls that were not hit hard enough to become home runs.
From 2015-19, for each hitter with at least 200 batted-ball events (BBEs) in a season, I extracted his share of pulled hard-hit fly balls from Baseball Savant. From here on, I will refer to this rate as HPFB%. I defined this rate as the proportion of his total batted-ball events, not plate appearances, because his strikeouts, walks, and hit-by-pitches are irrelevant to what happens once he makes contact. At bottom, I’m most interested in whether he can repeat his ability to pull fly balls hard. While striking out, for example, will impact his season-long home run total, his strikeouts will have no bearing on the contact he puts into play.
From there, I compared the sample of HPFB% in one year to the next. For instance, I compared the HPFB% of a hitter with 200+ BBEs in 2018 to his HPFB% in 2019 (only if he had 200+ BBEs in 2019 too). I did this on a larger scale though for all players with 200+ BBEs in back-to-back seasons from 2015-19 by using linear regressions. I had a sufficiently large sample, as there were 783 players who had 200 BBEs in back-to-back seasons between 2015 and 2019.
Regressions tell us the coefficient of determination (R2) between two or more variables, which illustrates how much variance in the sample of one dependent variable (e.g., HPFB% in year x+1) is explained by another independent variable (e.g., HPFB% in year x). The higher the R2, the greater the independent variable explains changes in the dependent variable (though R2 will never exceed 1). I’ll also provide the correlation coefficient (R), which measures the strength and direction of a linear relationship between two variables. R will always exist between -1 and 1, where a correlation greater than 0.8 is typically considered strong and less than 0.5 weak.
Results
First, let’s look at how predictive a player’s HPFB% in a given year was to his HPFB% in the next.
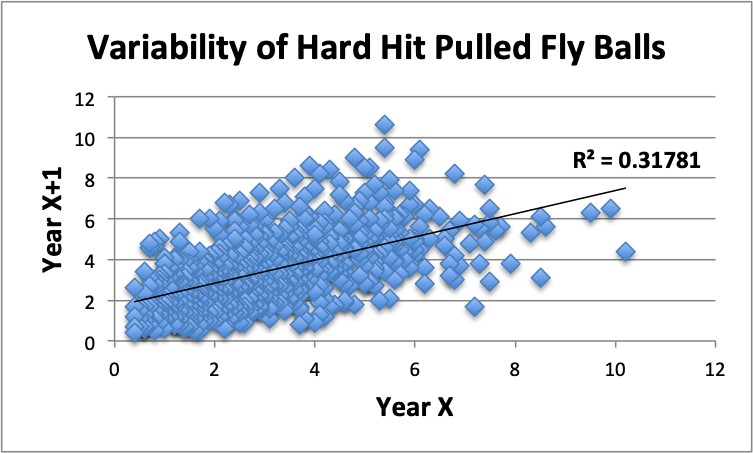
Here, the R2 is 0.3178. In other words, the hitters’ HPFB% in the first year explained only 31.8% of the variance in their HPFB% in the next. That means a hitter’s HPFB% is not strongly predictive of his future HPFB%. Other factors are contributing to the variance, explaining 68.2% of the total variance.
Likewise, the correlation coefficient was 0.56. That describes both the obvious—that the relationship is positive—and the less obvious: that there is a mild, not strong, relationship between the sample of HPFB% in year X to year X+1. In general, then, a hitter’s ability to pull hard-hit fly balls in one year is not predictive of his ability to do so in the next.
One expected retort will be that the hitters who are most adept at HPFB% are best able to repeat their HPFB%. Put differently, perhaps the top 10 or 25 in HPFB% are more likely to have an elevated HPFB% in the following year than other hitters. You might be thinking that these hitters are so good at pulling fly balls that they can sustain high HPFB rates year-over-year.
| Seasons | Top 10 R2 | Top 25 R2 |
| 2015-16 | 0.04 | 0.07 |
| 2016-17 | 0.38 | 0.04 |
| 2017-18 | 0.21 | 0.01 |
| 2018-19 | 0.01 | 0.05 |
This table shows the relationship between the 10 and 25 hitters with the highest HPFB% in 2015 to their HPFB% in 2016. It also illustrates the same for 2016-17, 2017-18, and 2018-19.
In my view, there is no relationship between the hitters who have the highest share of their total balls in play as hard-hit pulled fly balls from one season to the next. There is simply a weak predictive effect for these players, just as there is for the sample at large. The only instance in which there was any discernible relationship between the hitters’ HPFB% and their HPFB% in the following season was for the 10 best such hitters in 2016 and then again in 2017, though to a lesser degree in 2017. And those coefficients of determination (R2) were not significantly different from the entire sample’s 0.3178 mark.
One could still argue that the skill is only repeatable for the hitters with the very best HPFB%. Anticipating this, I returned to the aggregate sample of hitters with 200+ BBEs in back-to-back seasons the last five years. I determined the R2 between the top 10 HPFB rates for all players in any single year to their HPFB% in the following year, and the same for the top 25 in the sample. As before, the predictive effect of HPFB% was weak: 0.04 for the top 10 and 0.02 for the top 25. Here are the top 10 players in the entire sample:
| Player, Year X | HPFB% Year X | HPFB% Year X+1 |
| Max Muncy, 2018 | 10.2 | 4.4 |
| Joey Gallo, 2017 | 9.9 | 6.5 |
| Gary Sanchez, 2018 | 9.5 | 6.3 |
| Robinson Chirinos, 2018 | 8.6 | 5.6 |
| Matt Carpenter, 2018 | 8.5 | 3.1 |
| Edwin Encarnacion, 2017 | 8.5 | 6.1 |
| Mike Zunino, 2017 | 8.3 | 5.3 |
| Curtis Granderson, 2017 | 7.9 | 3.8 |
| Brian Dozier, 2017 | 7.7 | 5.6 |
| Chris Davis, 2015 | 7.6 | 5.4 |
What’s obvious is that each hitter experienced a decline from his extremely high single-season HPFB%. Remember that the R2 for the aggregate sample was 0.3178. Considering this is significantly higher than the R2 for these top 10 players in HPFB% (0.04), players are, interestingly, more likely to repeat or come closer to repeating their HPFB% in the next season if they aren’t a league leader.
Indeed, the table makes that conclusion inevitable. Each of these players had extreme dropoffs in HPFB% from these peak rates in year X. In the second year, Muncy, Carpenter, and Curtis Granderson couldn’t even manage half of their HPFB% from the season prior.
For context, the average HPFB% from 2015-19 was 3.16. Notably, each person on this list still managed an above-average HPFB% the following year. But that much is to be expected. Most of the players who ranked at the top of the HPFB% leaderboard are great hitters because the sample is already filtered by those who routinely pull fly balls at or above 95 mph. Usually, those who hit the ball that hard that frequently are the most prolific power hitters in the league, and thus find themselves at the top of these lists. Consequently, with excellent hard-hit and barrel rates, Max Muncy, who holds the top spot on this list, was able to hit 35 home runs in year x+1 (2019) despite a huge dropoff in HPFB% in 2019.
Yet, the pertinent question is the repeatability of simultaneously lofting and pulling the ball at those launch speeds where a player doesn’t have that kind of raw power. Specifically, can a player whose hard hits manifest disproportionately as pulled fly balls repeat that skill in the following season?
We now know that hard-hit pulled fly balls, generally, are not repeatable. Therefore, these hitters with extremely high HPFB rates saw HPFB% declines in the following year. Yet, a hitter like Muncy, with strong peripherals, continued to hit for power even though a large proportion of his hard hits were previously pulled fly balls because of the sheer quantity of hard-hit balls he produces. Conversely, when Brian Dozier’s HPFB% fell from 7.7 in 2017 to 5.6 in 2018, his home run total dipped from 34 to 21, which was to be expected based on his middling 5.7 Brls/PA% in 2017. He didn’t have the raw power to sustain success when his HPFB% predictably declined.
For the few hitters at the top of these lists with extreme HPFB rates and incongruous barrel rates, regression may be coming. It will reach those whose hard hits manifested disproportionately as pulled fly balls without similarly impressive inherent, raw power. Likewise, hitters with low HPFB rates and strong power peripherals may experience a home run resurgence in the following year.
Ultimately, the data suggests that repeating one’s HPFB% is unlikely. Cheating one’s barrel rate with hard-hit pulled fly balls is difficult to repeat.
Application
Now we know it is not only difficult to predict a player’s HPFB% in 2020 based on what he did in 2019, but also difficult to expect him to repeat an elevated or depressed HPFB% from 2019. Here are the players with the highest HPFB% in 2019 (min. 200+ BBEs):
| Name | HPFB% | Brls/PA% |
| Miguel Sano | 9.9 | 10.7 |
| Edwin Encarnacion | 9.4 | 8.2 |
| Matt Olson | 9.0 | 9.1 |
| Hunter Renfroe | 8.9 | 7.1 |
| Mitch Garver | 8.4 | 9.7 |
| Jay Bruce | 8.2 | 9.3 |
| Mike Trout | 8.2 | 11.0 |
| Cavan Biggio | 7.7 | 4.9 |
| Max Kepler | 7.7 | 6.4 |
| Eugenio Suarez | 7.4 | 8.3 |
Acknowledging that these hitters are unlikely to repeat such lofty HPFB levels, we can speculate as to who would be impacted the most in terms of home runs. Ideally, we would separate the Muncys from the Doziers.
In other words, many of these players will again hit many home runs in 2020, even if their HPFB rates decline, just as Muncy did in 2019 despite having a HPFB% more than twice as high in 2018 as he had in 2019. Our “Muncys,” for lack of a better word, include Miguel Sanó, Edwin Encarnación, Matt Olson, Mike Trout, Mitch Garver, Jay Bruce, and Eugenio Suárez. These hitters all had top-50 barrel rates. Therefore, even if they are overly reliant on pulled fly balls for home runs, they should be fine if their HPFB rates decline as they can continue barreling the ball at a sufficient pace to compensate.
That leaves Hunter Renfroe, Cavan Biggio, and Max Kepler, who stand out on this list for their relatively low barrel rates; Biggio, in particular. Reality may hit them especially hard in 2020 if they again fail to barrel the ball frequently, as they are unlikely to repeat their outlier HPFB rates.
Some similar players with high HPFB rates and low barrel rates in 2019 include: Byron Buxton (6.8 HPFB%, 5.8 Brls/PA%), Austin Hedges (6.8 HPFB%, 4.8 Brls/PA%), Bregman (6.7 HPFB%, 3.8 Brls/PA%), Eduardo Escobar (6.5 HPFB%, 5.2 Brls/PA%), Danny Jansen (6.3 HPFB%, 4.2 Brls/PA%), and Willie Calhoun (6.2 HPFB%, 4.7 Brls/PA%).
On the other end of the spectrum are those hitters with extremely low HPFB rates. How might their 2020 seasons look? Specifically, some of those with decent barrel rates and low HPFB rates may experience better fortune in 2020. Of the players in the bottom 25 of HPFB% in 2019, a few stand out: Pablo Sandoval (1.0 HPFB%, 8.1 Brls/PA%), Shohei Ohtani (1.1 HPFB%, 8.0 Brls/PA%), and Yandy Díaz (1.2 HPFB%, 7.2 Brls/PA%).
If you’d like to conduct your own analysis, you can find the full list of 2019 HPFB rates here. Just divide the Results column (total hard-hit pulled fly balls) by the Total Pitches column (which is actually total BBEs) to get HPFB%.
Conclusion
To reiterate, a player’s hard-hit pulled fly-ball rate (HPFB%) in a given year is not predictive of his HPFB% in the next. If that player had an elevated or depressed HPFB%, expect some regression to his HPFB% the following season. Whether his home run total will follow a similar path depends on the following matrix:
| 2020 HR Total | High HPFB% | Low HPFB% |
| High Brls/PA% | Inconclusive | Likely regression |
| Low Brls/PA% | Likely regression | Inconclusive |
By inconclusive, I simply mean it is difficult to draw a conclusion in connection with a hitter’s home run total based solely on his outlier HPFB% when he has the barrel rate to match.
Of course, you can use other power peripherals than barrel rate in conjunction with HPFB%, such as hard-hit rate, exit velocity, etc. This is only a crude guide for what may happen if a player has an extreme HPFB%. Generally, I recommend looking at anything new, like HPFB%, with as much context as possible. That way, you can avoid future Carpenters.
Photo by David Berding/Icon Sportswire | Adapted by Justin Paradis (@freshmeatcomm on Twitter)
Simple pull rates vary considerably from year to year as do FB rates. I don’t think we look at these things right. Rather than the being the reason for success, they are just observations about what happened. Sometimes it can be used to identify a change in approach but more often than not it is just about as useful as counting the number of singles or times a player struck out – that may be indicative of a change or more likely just the result of baseball not being played in a vacuum. There is an emerging industry of people trying to profit off of the players that actually play the game and they are desperate to find something to sell.The funny thing is that most of this is just people who know close to nothing of actual baseball stumbling around knowledge that has been around for decades.
If you want to know what I think about pulled FB – yes, of course those are most likely to be HR almost by definition. Pull heavy and FB heavy approaches are going to yield the least consistent results, so I would expect extreme volatility from that profile. I wouldn’t say they are doomed, but when it starts to decline it could completely fall apart really quickly. An interesting thing that I believe to be true is that anyone can pull more balls and anyone can hit more flyballs, but players can’t reverse it with much success. I think it is what you do as a last resort – you basically abandon your approach and sustainable mechanics and just start trying to hit dingers. I think of that as the dark side and you can’t really come back from it. Players with real power don’t need to make the same sacrifices to hit the ball out of the park. Your best hitters are not typically pull heavy and they hit lots of HR from gap to gap. Rather than worship the players yanking FB we should probably flag them as flawed hitters because they are but there are always special people that can do things their own way. That’s the problem with projections and analysis – you are going to miss on everyone who is special.. which is what I would think you are looking for in the first place. All you really end up doing is sorting/projecting the middle in some arbitrary order. HR count for a lot in compound metrics, so that volatility won’t be particularly evident there, but I would expect huge slumps and a low BA for sure – which is really what inconsistency looks like. Modern metrics worship the pull heavy type of player that sells out for power. For example, Bryce Harper is very valuable using modern metrics but has far less real value to his team because you can never count on him to do anything in a given AB – nobody has ever accused him of being clutch, yet he will float his season numbers on a few massive runs. Bellinger is the more interesting example as picking on Harper is too easy. Belly had an MVP 1/3 season and spent the majority of the year nowhere near that – he very much employs that approach most of the time. He is super weird though because IMO what he does best is hit the ball the other way, but he didn’t do much of that last year. What a strange season he had. Yelich on the other hand is a superior offensive player and doesn’t employ that strategy. I have mentioned this a few times before, but if juiced balls ever go away these players yanking FB for a living will become AAAA sluggers or worse as the “warning track power” calls would be deafening. In other words, things would go back to how they always were and all of this research that coincides with juiced baseballs would go out the window. On that note, I don’t think juiced balls ever go away as there are too many parasites that would lose out in that world and I don’t know who would profit which is increasingly MLB’s motivation.