


On of the greatest tales in Norse Mythology is that of The Wild Hunt. As the story goes Odin disguises himself as a spiritual hunter and leads the ghosts of ancestors, hunter spirits, fairies and goblins on the greatest hunt of the season. Anything caught in it’s wake has the choice to either join said hunt or risk being torn to shreds by it. By some The Wild Hunt was considered an ill omen but it was also believed to bring life and blessings to the land around it. This is often how I feel about hitters like Hunter Renfroe. Many fans see the .245 AVG and 27.1 K% and see him as the harbinger of a baseball world that harbingers only three true outcomes and little else. They’re missing the bigger picture though as they miss out on the 29.3 HR/FB%, .905 OPS and absolutely insane .352 ISO. Talk about bringing life and blessings to the land around him! In that spirit, I’d like to dive into Renfroe’s season and take a look at how quietly he has transformed into one of the most prodigious power hitters in the league and no one has seemingly noticed.
In order to establish a baseline let’s look at Renfroe’s base numbers over the last three years.
| Year | PA | AVG | HR | R | RBI | SB |
| 2017 | 479 | .231 | 26 | 51 | 58 | 3 |
| 2018 | 441 | .248 | 26 | 53 | 68 | 2 |
| 2019 | 299 | .245 | 27 | 40 | 49 | 4 |
It’s easy to gloss over the most important number in that table so be sure to take note of the plate appearances. Renfroe has put up 2018’s numbers in just over 2/3s of the PAs! He’s already hit more HRs at the All-Star Break then he hit ALL OF LAST SEASON. Just for kicks, lets see what Renfroe’s numbers look like when prorated to the entire season.
| Year | PA | AVG | HR | R | RBI | SB |
| 2019 | 299 | .245 | 27 | 40 | 49 | 4 |
| 2019 Prorated | 520 | .245 | 47 | 70 | 85 | 7 |
Until this year that was the sort of year, we drooled over the likes of Joey Gallo potentially producing and is nearly spot on to the production we come to expect year after year from Khris Davis. In fact, I want to take much of this article and compare these three players as I think by the time you’ll see why Renfroe deserves to be in the same conversation as these guys and why Renfroe might even have some room for more in the future.
Let’s start with his advanced numbers. First we’ll look at Renfroe’s numbers in isolation and then we’ll make the comparisons to Davis and Gallo and see how well they line up. Here’s Renfroe’s advanced metrics over the last three years.
| Year | BB% | K% | ISO | wOBA | wRC+ | HR/FB% |
| 2017 | 5.6% | 29.2% | .236 | .316 | 94 | 18.7% |
| 2018 | 6.8% | 24.7% | .256 | .338 | 114 | 20.3% |
| 2019 | 8.0% | 27.1% | .352 | .366 | 129 | 29.3% |
You’re seeing improvement pretty much across the board. BB% improves 1.2% each year while his ISO, wOBA. wRC+ and HR/FB% all improve dramatically across the board. His K% is also up from 2018 but it’s worth noting that much of that increase is due to same reason we’re seeing an increase in his walk percentage, he’s finding himself deeper in counts more often. Think of it this way. In 2018 Renfroe saw 30.8% of his pitches with two strikes, with just 7.5% of his pitches with three balls and 4.3% of his pitches coming with a full count. On the other hand in 2019 he’s seen 31.8% with two strikes, 9.4% with three balls, and 5.7% of his pitches with a full count. When your working deeper in counts more often both BB% and K% have a tendency to go up so I’m not too worried for about the increased K% since it comes with the corresponding increase in BB% as well. Now how does that measure up with Gallo and Davis? Note that I am going to compare Renfroe’s 2019 numbers to Gallo and Davis’ 3-year averages as that will help eliminate the white noise of any injuries or weird seasons. I feel like this is a way to eliminate outliers which I try to do as much as possible when comparing power profiles.
| Player | BB% | K% | ISO | wOBA | wRC+ | HR/FB% |
| Renfroe 2019 | 8.0% | 27.1% | .352 | .366 | 129 | 29.3% |
| Gallo 3-Year | 14.5% | 37.1% | .314 | .362 | 121 | 30.5% |
| Davis 3-Year | 9.0% | 27.6% | .273 | .352 | 123 | 25.1% |
And just for a bit of visual fun here’s a radar plot that shows visually just how close these guys actually are to each other.
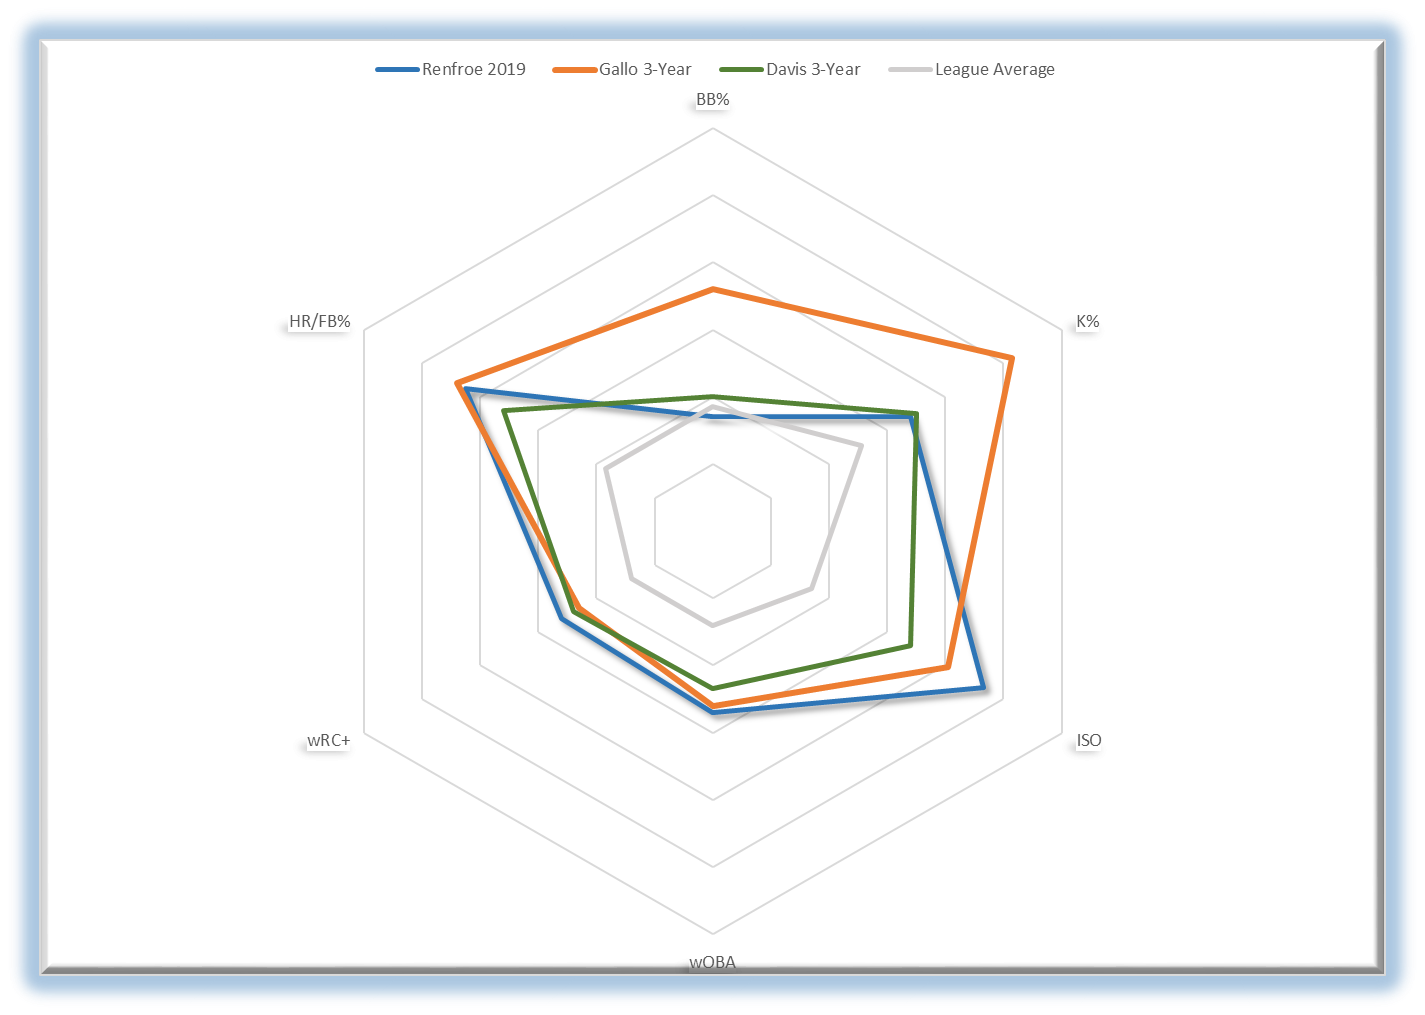
I’ve included the grey line for the league average to try give some perspective. Take ISO for example. Without the league average you might think these three hitters are pretty far from each other but they are clearly much closer to each other than the they are the league average. Same for HR/FB%. It’s pretty easy to see just how much Renfroe’s advanced statistics overlap with Gallo and Khris Davis.
Now what about approach? Have we seen any differences in Renfroe’s approach or batted ball numbers to indicate some improvement?
| Year | Pull% | Cent% | Oppo% | LD% | GB% | FB% |
| 2017 | 50.0% | 31.0% | 19.0% | 16.7% | 37.9% | 45.4% |
| 2018 | 48.8% | 33.1% | 18.1% | 19.7% | 37.5% | 42.8% |
| 2019 | 53.4% | 34.7% | 11.9% | 16.6% | 35.8% | 47.7% |
Renfroe’s always been a strong flyball pull hitter but combining a Pull% over 50.0% (5th highest in MLB) and a FB% over 45.0% (10th highest in MLB) and you have a great recipe for power potential. That batting profile will never be all that kind to Renfroe’s batting average but it will certainly lead to a ton of home runs so long as he hits the ball hard and at the right angle (we’ll get to this later). Before we make our overall comparison I think it’s worth asking if he is particularly vulnerable to the shift. In 2019 Renfroe has faced the shift on 119 of his 273 at bats (43.6%) and he done alright against the shift hitting .244 but it’s largely absent of all power and a greatly reduced FB% (39.5%). This will definitely be something to keep an eye on as Renfroe continues throughout his career and will always hold back his AVG but for now he’s dominating enough when he’s not shifted on that I’m willing to make it a concern and not a full-blown worry yet. All pull-happy sluggers these days always come to a crossroads when it comes to the shift but when we get to his statcast numbers I’ll talk more about how I think he’ll be just fine. Now how does this approach measure up with Gallo and Davis?
| Year | Pull% | Cent% | Oppo% | LD% | GB% | FB% |
| Renfroe 2019 | 53.4% | 34.7% | 11.9% | 16.6% | 35.8% | 47.7% |
| Gallo 3-Year | 48.5% | 29.3% | 22.2% | 20.7% | 28.5% | 50.8% |
| Davis 3-Year | 36.8% | 39.0% | 24.2% | 18.1% | 39.1% | 42.9% |
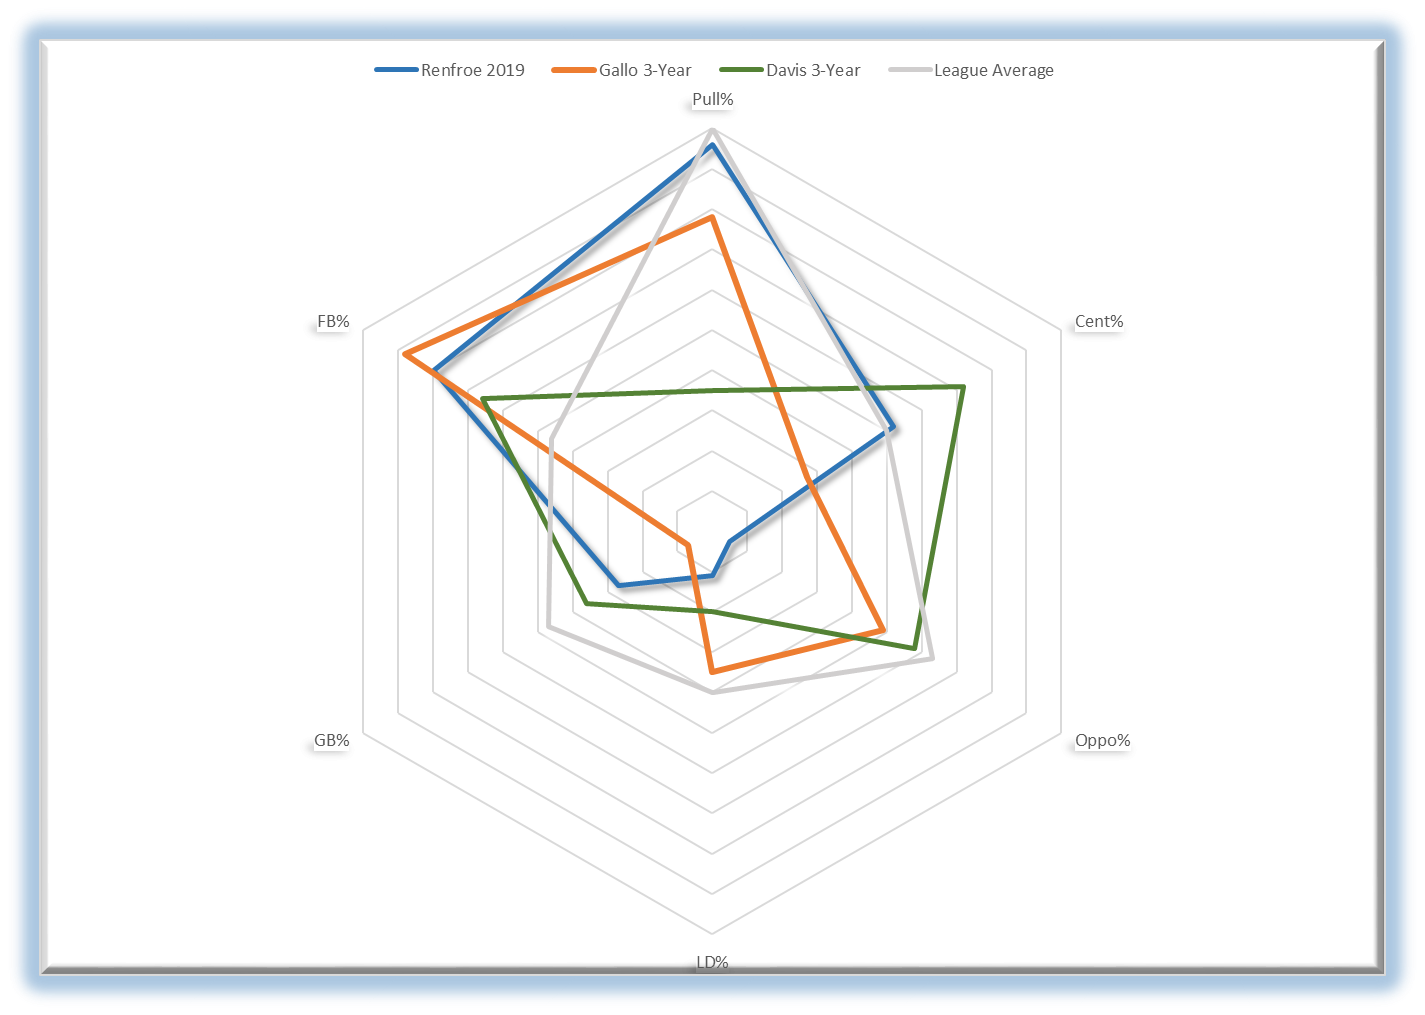
The radar plot isn’t quite as clear cut as the advanced stats but it’s pretty easy to see where they are all bunched together. It’s almost like Renfroe is a blend of Gallo’s extreme pulled flyball tendencies and and Davis’ groundball and centerfield proclivities. Once again when compared to the league average though it is hard not to floored by how close these hitters are.
Now for the fun stuff. What about statcast? Feast your eyes on Renfroe’s three year trends for his statcast numbers.
| Year | BBL% | Exit Velocity | Launch Angle | Distance |
| 2017 | 10.8% | 87.9 | 15.2 | 192 |
| 2018 | 12.4% | 89.9 | 18.5 | 184 |
| 2019 | 14.0% | 91.2 | 19.5 | 208 |
Once again we see that steady year to year improvement from Renfroe. That’s all the signs of a big man who hits the ball really, really hard. Not to beat a dead horse but it’s clear Renfroe has adopted the Gallo train of thought as to how to beat the shift…just hit the ball harder. Boy has he ever. For perspective a 14.0 BBL% is tied for 32nd in MLB while his 91.2 EV ranks 42nd in the game with a 19.5 LA sits at a tie for 22nd and a 44.0 HH% sits at 79th. These are all elite numbers and are encouraging for an elite power hitter especially when you factor in the 208 foot average distance which is good for 23rd in the league. It’s really something else. At risk of becoming repetitive let’s measure those numbers against Gallo and Davis.
| Year | BBL% | Exit Velocity | Launch Angle | Distance |
| Renfroe 2019 | 14.0% | 91.2 | 19.5 | 208 |
| Gallo 3-Year | 23.0% | 93.5 | 21.9 | 226 |
| Davis 3-Year | 16.3% | 91.8 | 14.8 | 200 |
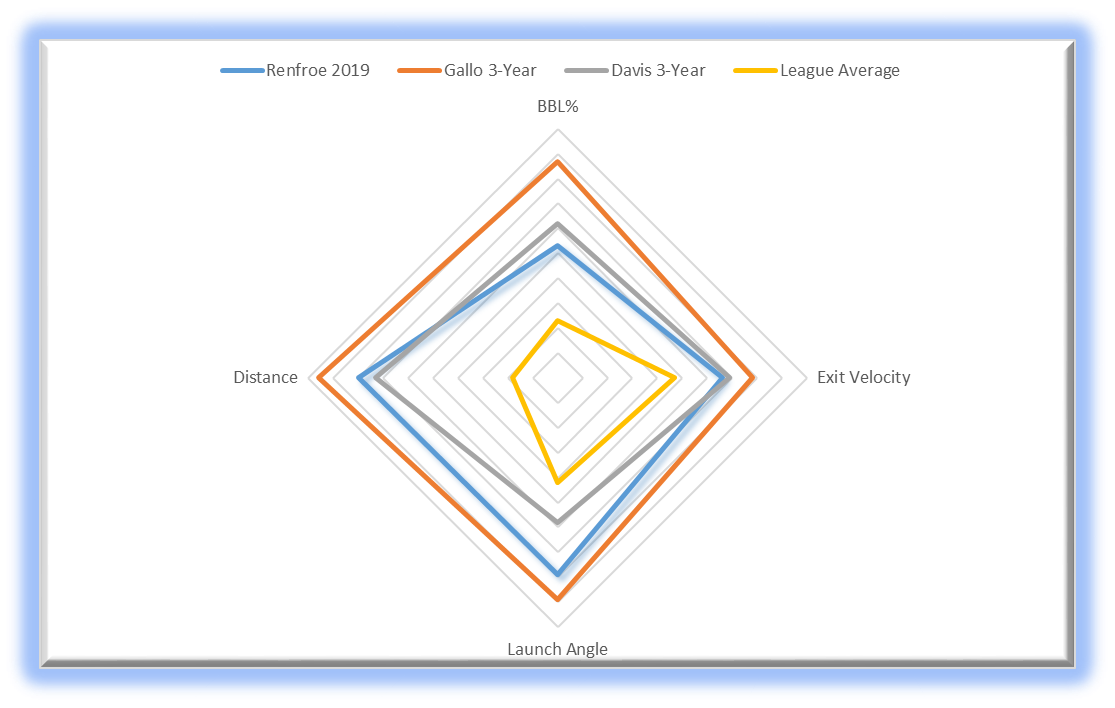
So Renfroe barrels the ball like Davis for the same average distance but has average launch angles and exit velocities that we expect out of Gallo every year. either way they truly do sit right in line with each other with similar overlapping profiles. Before we move on from the statcast section I do want to take a moment and compare launch angle charts. As the Guest of Honor, we’ll start with Renfroe’s.
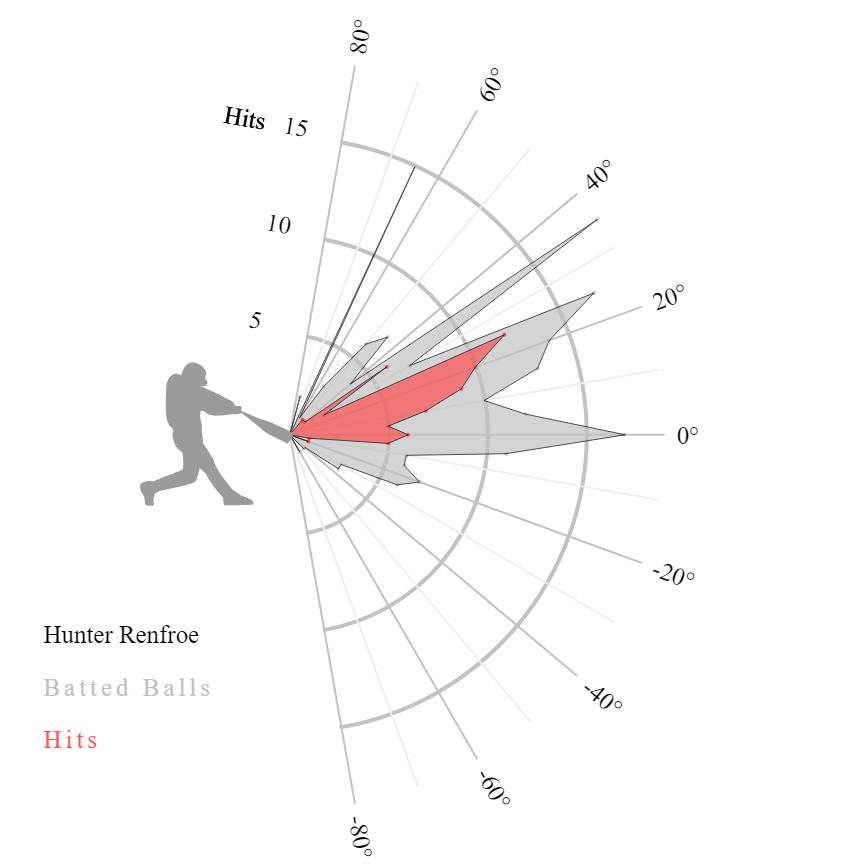
Good Lord. Just look at that. The biggest spikes for his hits sit between 15 and 25 degrees, exactly where you want them to be for a power hitter. It’s honestly pretty darn free of outlier spikes as well. For the most part his launch angles seems like the real deal rather than being skewed by extreme pop ups and ground balls straight into the ground. Now how about Gallo’s from the last three years?
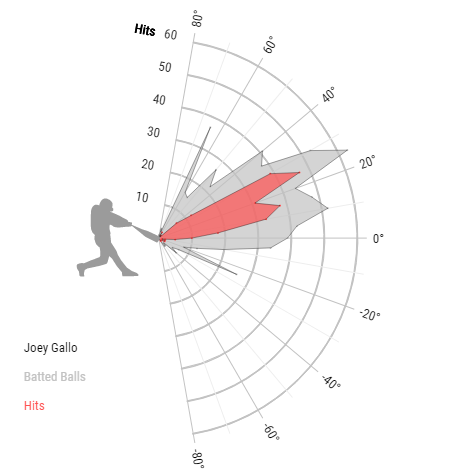
Minus a few extra groundball hits from Renfroe they’re practically identical right? Gallo’s red spikes spread out a bit further from 10 degrees to 30 degrees but that seems to imply his chart is just tilted upwards 5 degrees or so from Renfroe’s but they are still remarkably similar. Now how about Davis’?
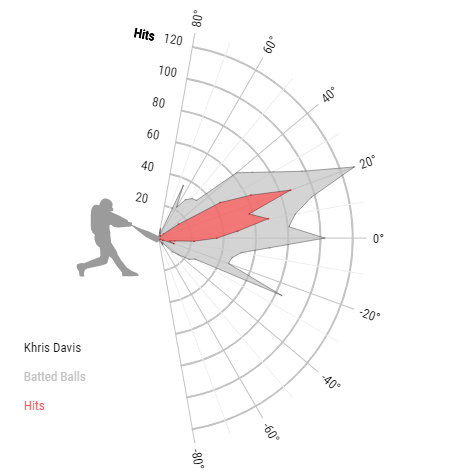
Same ole’ story, same ole song and dance, ma friend. Davis’ launch angle chart looks like a mirror image of the other two hitters. In fact if you had taken these three and lined them all up in a row without names on them I would just have assumed that they were simply different seasons from the same hitter that’s how close they are to each other. It’s simply remarkable.
So now that we’ve established that these three hitters are remarkably similar, what does this tell us? What value should we be drawing now from this comparison? Both Gallo and Davis have a certain dependency (Davis and his eeire love for hitting .247 aside) they both are pretty much as sure a bet as there is to hit 40+ HRs every year. If this season is just the beginning for Renfroe (and the statcast numbers seem to indicate it is.) than let’s make the temporary assumption that he joins those two in their upper echelon home run consistency. Just how rarified is the air up there? Last year only three hitters put up more than 40 home runs (Gallo, Davis, and J.D. Martinez). Only 14 hitters (Gallo, Davis, Martinez, Mike Trout, Jose Ramirez, Nolan Arenado, Francisco Lindor, Giancarlo Stanton, Manny Machado, Trevor Story, Nelson Cruz, Christian Yelich, and Matt Carpenter, whew) put up more than 35 HRs. That’s pretty good company to join if he can continue his torrid pace this year.
Let’s take that information and put it into context for this year, especially since the HR enviroment has changed so much. If you want to grant the premise that any hitter entering today with roughly 23 HRs or so has a shot at hitting 40 HRs on the season how many hitters in 2019 with the new fangled juiced ball do we think have a chance to reach that fabled plateau? There are currently 19 players with at least 23 HRs. I’m gonna go out on a limb and bet that 10 of them actually make it that far. What about 45 HRs though? 26 HRs would do the trick for that pace. That narrows the list down to roughly seven hitters (Cody Bellinger, Christian Yelich, Mike Trout, Peter Alonso, Edwin Encarnacion, Josh Bell, and Renfroe). That’s a nice list to find yourself on. Either way the average 12 team league rosters some 276 players and to have one of the seven hitters who give you a distinct advantage in HRs is an incredible, game changing asset, especially when you consider that three of those players are likely the first three picks in the draft next year and so will be spread out on different teams. so you’re talking four players who could hit 40+ HRs that might be available outside the first round.
But that’s all about next year. I mostly talk about the draft and the end of the season in order to give us perspective on how odd it is that no one is seemingly talking about Renfroe this year. It’s likely that at this point you’re asking me Daniel, if Hunter Renfroe is on pace to hit 40+ HRs and has a hitting profile nearly identical to Joey Gallo and Khris Davis surely he’s not available still 2/3s of the way into the season right? Not so fast my friends! Wait, dang it wrong sport. Do I now have to like wear a giant mascot version of Renfroe’s head while I make this proclamation? Anyways, check out the ownership numbers for Renfroe across the major platforms.
| Platform | % Owned |
| Yahoo | 67% |
| ESPN | 73,3% |
| CBS | 80.0% |
While Renfroe is a bit more owned than most of the players I talk about here, there are still quite a lot of leagues in which he is still out there and available. If you’re hurting for home runs, Renfroe is the perfect trade candidate that might not cost too much, especially if you think the other side might be scared off by the batting average.
There’s also something worth pointing out with Renfroe. The trade deadline is a mere two weeks away and the Padres are rumored to be looking for pitching upgrades. The thing is with Renfroe, Franmil Reyes, Wil Myers, Manny Margot, and Josh Naylor all fighting for MLB playing time in the outfield the rumors all seem to center around moving some of their outfielders to get some pitching help and Renfroe is at the forefront of many of those rumors. This could potentially be a really good thing. We all know Petco Park is a notorious pitcher’s park and Renfroe feasts whenever he is away from San Diego. 16 of his 27 HRs (59.0%) have come on the road which makes me wonder if there’s potential for even more HR production if he does end up getting moved.
Overall I think Hunter Renfroe is making the leap that we all have been waiting for from him. He’ll never be a positive in AVG let alone an asset but he’ll more than make up for it in elite HR production and solid RBI contributions. Run to your waiver wire and see if he’s still available and start targeting him in trades if you need the home runs, because Hunter Renfroe is going to hit plenty of them over the rest of the season. Bringing life and blessing to the land indeed.
(Photo by Justin Fine/Icon Sportswire)
The reason people don’t talk about Renfroe is that they are busy looking at Franmil Reyes. I have been banging that drum all year long. Before that it was Franchy Cordero. They also prefer Myers in an OF corner. All he was ever missing was the opportunity. I think he is flawed, but he fits right in with the other flawed sluggers that you mention. To be fair, his rate accomplishments should be taken with a grain of salt as he is not an everyday player. He gets some tough days off which is why he isn’t one of those other better guys. When you compare Renfroe’s 2019 numbers to Gallo and Davis’ 3-year averages, the noise is comparing half of one year to the ups and downs of 3 full years. I don’t think that is particularly valid. If you don’t buy what I am selling look at his game log for this year – he starts the year as a platoon player/bench guy which is what they clearly thought of him as. It is clear as day that they preferred Reyes to start the year. I don’t think that is true now as they feel that way any more.
As someone not new to Renfroe, he is exactly the same guy he has always been. As a prospect his comp was Paul Bunyan lol. Let’s not pretend that people did any research and wrote him off. I don’ t think most people do much research – they just buy hype and Renfroe is well removed from hype. I think the progression that you see is him getting everyday ABs. SD has always thought of him as the odd man out as they have always given his opportunities to other players. The plate discipline gains are likely largely due to the org finally placing some confidence in him.
Lets talk about the shift for a moment. You don’t need an over shift for dead-pull players to get themselves out – they always have. I am extremely skeptical that it is a significant factor. Even without over shifts, dead-pull players have never gotten a lot of hits unless they are Ted Williams or David Ortiz. The shift is not particularly effective and it doesn’t have much of an effect on anyone’s career. I am not aware of any real data that shows the shift is effective. Dead-pull hitters yanking it into the teeth of a defense suffer with or without a shift – I don’t think you can quantify it very well even if it does matter. The biggest problem with shift data is – what is a shift? From what I have seen the categorizations of “shift data” are extremely crude. A shift isn’t a shift. There are dumb shifts and smart ones. Sometimes a guy is on the grass and sometimes not. The location of the extra infield isn’t standardized so that data can never really mean anything. Before shifts and statcast defenses still shifted especially for a dead-pull hitter, but that probably isn’t considered a shift by todays definition. The data is just inherently trash. The efficacy of the shift would be discussed all day every day if it was a thing but its not. The best that I have ever seen is that dead-pull players have lower babip into a shift, but that is true without an over shift I am sure. I watch actualy baseball every day and I am certain that the shift gives away more than it takes away, but how do you quantify that? 90+% of the plays made in an over shift are hit exactly where you would position the defenders in a typical alignment. The shift is mindlessly deployed more often than not just throws away one defender. There are a lot of good reasons why you can’t assess it with any accuracy, but it sure doesn’t pass the eye test.
Unless you’re just looking for dingers, generally speaking, Laureano over Renfroe, correct?
Absolutely! I am all in on Laureano, even if you’re looking for dingers as he’ll put up plenty of them himself. I like Renfroe alot but I am all in on Laureano and he would be my top priority.