


Since Andrew Perpetua joined the Mets in January 2019, fantasy analysts have been left wanting in their player analyses. The reason is he has stopped updating xStats.org, a website where one could go and find a host of innovative statistics based on exit velocity, launch angle, etc.
For instance, Andrew calculated his own xHit metrics (e.g., x1B, x2B), xAVG, xOBP, xSLG, xBABIP, Value Hit rate, Poor Hit rate, and then his own batted ball types (Dribble Ball rate, High Drive rate, etc.). And those were just the hitting metrics. But one I’ve been struggling without is xHR. Indeed, one easy place to quickly check if my analysis of a player’s true power skill was correct was to go to xStats.org and find his xHRs.
Sure, you can go there and still find players’ historical xStats dating back to 2015. But I was itching for xHR totals for active players this year. Thus, I created pHR, short for Predicted Home Run, a new way to determine how many home runs a player should have.
Methods
To begin, I used multiple regressions to determine which metrics best explain the variability in home runs. Regressions tell us, among other things, the coefficient of determination (R2) between two or more variables. An R2 illustrates how much variance in the sample of one dependent variable (e.g., HRs) is explained by another independent variable (e.g., Brls/PA%). The higher the R2, the greater the independent variable explains the variance in the dependent variable (though R2 will never exceed 1).
For my regressions, I chose HR/PA% as the dependent variable. The reason I chose HR/PA% instead of HR totals was to control for varying plate appearances in the sample. If Aaron Judge and Giancarlo Stanton had differing plate appearance totals in a given year, the statistics that they contribute to the regressions should not be weighted equally. I actually began by using HR totals as the dependent variable and then simply adding PAs in as one independent variable, but doing so failed to effectively control for plate appearance totals.
Next, in order to approach this neutrally, I downloaded a lot of data. In fact, I gathered as many statistics that I thought might possibly be relevant to explain the variance in HR/PA%. I did this for all players with a minimum of 150 BBEs in any single season from 2015-2018. This gave me a nice, large sample of 1,319 players.
Figuring the R2 between Brls/PA% and HR/PA% R2 might be very high, I began there. Lo and behold, it was a whopping 0.7662. In other words, 76.62% of the variance in players’ HR/PA% was explained by players’ Brls/PA%. Then, I began adding in other independent variables to see what else might explain additional variation in HR/PA%.
Here’s the tricky part. If you just add in more variables, the R2 will continue increasing. No matter what you add in, R2 will always go up. However, it’s important to tell whether an additional dependent variable is actually contributing to greater precision in the model, as opposed to the R2 simply increasing by chance.
To that end, for each new variable I added to the regression, I examined the adjusted R2:
The adjusted R-squared is a modified version of R-squared that has been adjusted for the number of predictors in the model. The adjusted R-squared increases only if the new term improves the model more than would be expected by chance.
Thus, where I added a new variable and the R2 increased but the adjusted R2 decreased, I knew the increase was due to chance rather than any unique additional variance accounted for by the new variable.
In sum, here are the variables that actually contributed to the model by improving the adjusted R2:
| Metric | P-value |
| Brls/PA% | 3.54E-07 |
| Pull% | 5.01E-16 |
| GB% | 2.11E-08 |
| FB% | 5.24E-12 |
| xBA | 6.96E-25 |
| Soft% | 6.56E-12 |
| xSLG | 1.22E-41 |
| PA | 0.002677 |
| Age | 0.004471 |
I’ve provided their P-values as well so you can see they were all statistically significant. You can discern statistical significance where the P-value is less than 0.05, as we would then reject the null hypothesis that there is no relationship between the independent variable (in the context of the other independent variables) and the dependent variable. Indeed, a P-value under 0.05 indicates that a given independent variable accounted for unique variance in the HR/PA% sample.
Each of the above metrics—when added in one-by-one and cumulatively regressed against HR/PA%—improved the adjusted R2 of the model and retained P-values under 0.05. Finally, Colin Charles checked the Bayesian Information Criterion of the model to ensure there was no overfitting, as it penalizes models with too many needless variables. Nevertheless, as with the Adjusted R2 and P-value method, the BIC indicated that the best model included all of the above variables. These metrics, therefore, became the foundation of the pHR model.
There are certain variables that you may be thinking should not correlate with home run hitting. For example, if we’re checking HR/PA%, why would a player’s PA total matter? Isn’t it already accounted for on the back end? My guess would be that better players (some of which are sluggers) generally get more playing time, which accounts for some additional variance in HR/PA% that the others were missing.
But that says nothing of the variables that had no significance because they did not increase the Adjusted R2 of the model and their P-values were below 0.05. In order to be completely transparent, I thought it relevant to provide them too. They are:
| Metric |
| BB% |
| K% |
| Sprint Speed |
| xwOBA |
| IFH% |
| IFFB% |
| Swing% |
| O-Swing% |
| O-Contact% |
| Z-Swing% |
| Z-Contact% |
| Contact% |
| Swinging Strike% |
| Exit Velocity |
| Hard Hit% |
| Hard% |
| Line Drive% |
| Brls/BBE% |
| Exit Velocity on FB/LD |
| Launch Angle |
| GB/FB |
| Cent% |
| Oppo% |
| BABIP |
You may be surprised to see things like Exit Velocity on FB/LD or Launch Angle on this list. We often look to those metrics to evaluate a power hitter. However, bear in mind that they must explain unique variance in the HR/PA% sample, beyond what the independent variables in the first table already tell us, to have statistical significance in a multiple regression context. My guess is that much of what Exit Velocity on FB/LD or Launch Angle tells us is already accounted for by Brls/PA%, FB%, or xSLG.
There are also common metrics missing from these lists, such as SLG, HR/FB%, and ISO. I never tested them in the model because I did not want to artificially inflate the R2 of the model by including metrics that actually account for home runs. For example, I included xSLG in my regression (which improved the pHR model) and not SLG because the former accounts for exit velocity, launch angle and Sprint Speed, but not actual HR totals.
Ultimately, after discarding all of these irrelevant stats either because they failed to improve the model or because they accounted for actual home runs, the pHR model was complete. The R2 for all of the variables from the first table (e.g., Brls/PA%, Pull%, FB%, etc.) and HR/PA% was 0.8420. Of course, it will be difficult to reach 1 as there will always be luck factors such as quality of opposing pitcher, home ballpark, and weather. And yet, the fact that these variables explain 84.2% of the variance in qualifying players’ HR/PA% from 2015-2018 is still excellent.
But I didn’t just want to know how much variance in HR/PA% is explained by other metrics. No, I wanted to create a statistic that fantasy baseball players can use to evaluate players.
Introducing pHR
The next step to creating pHR was to take the intercept and coefficients (weights) from the regression and create a formula. With that formula, I was able to plug in actual stats from players to derive their pHR/PA%, or put differently, what their HR/PA% should have been given their Brls/PA%, Pull%, GB%, etc.
From there, I multiplied each player’s pHR/PA% by his actual PA figure to get a pHR total. I’ve posted the pHR total for each player next to his actual HR total on Tableau so that you can make your own evaluations. My hope is that this is something you can use moving forward.
Before diving into illustrative examples, I want to make a few points. First, from 2015-2018, pHR shared a 0.9097 R2 with actual home run totals. In other words, 90.97% of the variance in players’ home run totals can be explained by pHR:
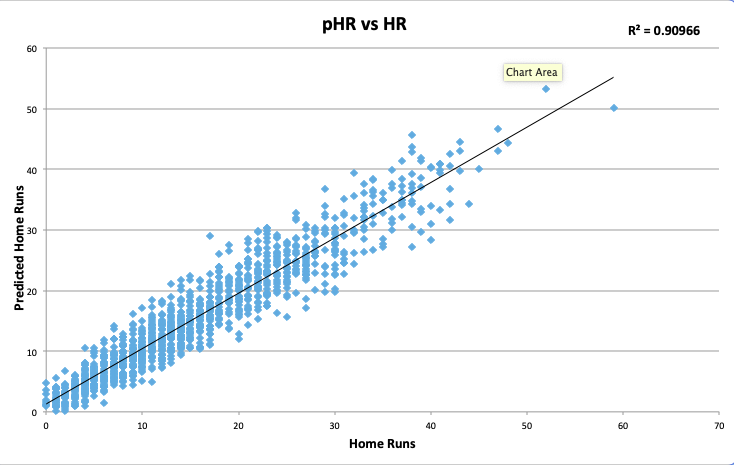
It’s incredible that we can explain that much variance without using a single home run actually hit. And therein lies the value of pHR. No independent variable in the formula contains a single unit accounting for homers. Therefore, pHR will not share the same faults as HR totals because it is not subject to the same flaws as home run totals: flukey variance or luck. It is solely a measure of how many home runs a hitter should have based on what happened to other players with similar Brls/PA%, Pull%, FB%, xSLG, etc.
But beyond this, it’s also worth noting the predictive power of pHR. For 2015-2018, I compiled a sample of all players with 150 BBEs in any pair of consecutive seasons (i.e., 2015-2016, 2016-2017, and 2017-2018). Put differently, if a player had 150 BBEs in each of 2015 and 2016, for example, then he made the list. There were 759 such results.
From there, for the entire sample I regressed players’ pHR/PA% (to control for PAs) in the first year against their HR/PA% in the next year to determine its predictive value. I did the same for HR/PA% to HR/PA% in the next year, and Brls/PA% to HR/PA% in the next year.
| Metric | R2 with HR/PA% in t+1 |
| HR/PA% | 0.3961 |
| Brls/PA% | 0.4244 |
| pHR/PA% | 0.4466 |
So, in terms of predictive power, pHR/PA% was better than Brls/PA% and HR/PA%. It’s also much easier to discern a player’s future home runs just by looking at his pHR total because I’ve provided it for you in the same units as home runs, rather than using a ratio like Brls/PA%.
Of course, its predictive advantage over Brls/PA% is marginal at best. I could have derived a formula for a predictive home run metric instead of predicted home runs, but most fantasy baseball players are interested in whether a player has gotten lucky or has earned his home runs. In other words, you should use pHR to see if a player’s home run total is an outlier based on the results pHR describes for him considering what happened to all hitters between 2015-2018 with similar Brls/PA%, Pull%, FB%, xSLG, etc. You can use it to see how a player will perform next season, but the value add is not great beyond Brls/PA%.
Discussion
Think of it this way. Imagine you’re looking up a pitcher’s strikeout rate and see it’s 25%. You also find that his swinging strike rate is 9%. You quickly calculate in your head that his expected strikeout rate, based on his swinging strike rate, should be around 2x his strikeout rate, or 18%, and that he’s gotten a bit lucky. So there’s a real possibility his strikeout rate might come down.
Consider pHR in the same vein. In the above example, swinging strike rate is the input, the coefficient is 2, and the output is expected strikeout rate. In this case, we have a number of inputs like Brls/PA%, there are corresponding coefficients that we’ve derived from the regression, and the output is pHR. We’ve already done the math for you so there’s no mental math. And you can compare pHR to a player’s actual home run total to determine whether he’s gotten lucky and it might change.
But as with any new statistic, pHR is best illustrated by examples. Let’s see who it likes the most this year.
| Name | HR | pHR |
| Christian Yelich | 16 | 13.3 |
| Joey Gallo | 12 | 12.5 |
| Cody Bellinger | 15 | 12.1 |
| Marcell Ozuna | 12 | 12.1 |
| Jose Abreu | 10 | 12.1 |
| George Springer | 16 | 11.8 |
| Gary Sanchez | 11 | 11.6 |
| J.D. Martinez | 8 | 11.5 |
| Josh Bell | 12 | 11.3 |
| Luke Voit | 10 | 11 |
What’s most interesting is that pHR buys Christian Yelich’s repeat MVP performance, but only so much. It likes him better than all other players in the league, but less than he’s actually produced to this point. That’s true of many of the players on this list. The reason is that it’s easier to get an outlier total based on luck in terms of actual home runs, than it is to have such an excellent Brls/PA%, Pull%, etc. that pHR would give you an outlier pHR total. Yelich is a great example of using pHR to show how actual home run totals are subject to luck and random variance.
I’m not surprised to see Joey Gallo second on this list, with Gary Sanchez and Jose Abreu not far behind. All three sluggers rank in the top six on Statcast’s Brls/PA% leaderboard. Remember that Brls/PA% explained the most variance in the HR/PA% sample, and therefore is weighted the most heavily in the pHR formula.
Next, let’s take a look at the five players with the biggest difference between their HR and pHR. In other words, the “luckiest” players in MLB.
| Name | HR | pHR | HR-pHR |
| Tommy La Stella | 10 | 4.8 | 5.2 |
| Alex Bregman | 13 | 8.2 | 4.8 |
| Joc Pederson | 13 | 8.3 | 4.7 |
| George Springer | 16 | 11.8 | 4.2 |
| Michael Brantley | 10 | 5.9 | 4.1 |
Thinking about picking up Tommy La Stella? Think again. With a meager 6.6 Brls/PA%, .265 xBA, and .413 xSLG, it’s no wonder that pHR dislikes him. Some of the other names are surprising, however, given they’re skilled hitters.
These four all outperformed their home runs last season according to Andrew Perpetua’s now-defunct xHR. It’s possible they are skilled at overperforming their expected stats (as xBA, xSLG, and Brls/PA% are all variables in the formula), which is having an effect on their predicted home runs. Indeed, Nick Gerli found that players with heavy pull tendencies can outperform expected statistics. This could be a limitation of pHR, or put differently, part of the 9% of the variance in HRs that it did not explain from 2015-2018.
Still, pHR does account for Pull%, so I’m not convinced this is the reason. Instead, it’s possible that they’ve been lucky to this point, and pHR doesn’t buy their success with good reason.
Relatedly, let’s examine the “unluckiest” players in MLB according to pHR.
| Name | HR | pHR | HR-pHR |
| Nicholas Castellanos | 3 | 7.1 | -4.1 |
| J.D. Martinez | 8 | 11.5 | -3.5 |
| Jose Ramirez | 4 | 7.2 | -3.2 |
| David Dahl | 3 | 6.2 | -3.2 |
| Justin Smoak | 5 | 8 | -3 |
Always fun to see a Tiger mess up the results of an expected statistic. Has Nicholas Castellanos simply been unlucky or is Comerica suppressing his HR total? There’s really no way to know, but this gives me an opportunity to note that pHR does not control for home venue. Perhaps he continues to underperform pHR and our collective expectations. Or again, maybe he’s just been unlucky and will pick it up at the dish. It’s certainly not a bad thing to be at the top of this list.
I’ve written recently about Jose Ramirez’s struggles and how I felt they were deserved. Now, apparently, I’m writing about how they aren’t. In my article, I did note that, to that point, he should have had three homers instead of one. Now, that total would be six given the three he’s hit since the writing of that article, just shy of his 7.2 pHR. However, even 7 pHR isn’t great given the lofty expectations surrounding him, and I’m not surprised when examined in the context of his below average 5.2 Brls/PA% which is likely driving the low pHR figure.
Of course, J.D. Martinez is awesome and a somewhat slow start we can chalk up to bad luck (as pHR suggests). And maybe pHR will push some people to buy low on David Dahl. In this instance, pHR is also serving as your annual reminder that Justin Smoak isn’t hitting as many home runs as his raw power and batted ball profile would suggest.
Conclusion
Once more for good measure: You can find the pHR for each player with at least 10 PAs in a given season dating back to 2015. I’d also like to add special thanks to Colin Charles, who helped scrape the data so that the table constantly updates with daily stats. I cannot overstate how critical he was to the process of developing pHR.
Hopefully, pHR helps many people with evaluations, just like Andrew’s xHR helped me. With pHR, we can discern a real slugger from a flash in the pan.
Stay tuned for more pStats to come.
Featured Image by Justin Paradis (@freshmeatcomm on Twitter)
Love these articles! Very interesting read and was shocked to see those four names after La Stella in the over performers – although Springer makes some sense since I don’t think anyone would say he’s a threat to be a HR leader. Keep ’em coming!
Thanks so much!
This is fantastic. Losing xStats has been a bummer, so it’s nice to know smart people are working on new things to fill in. Appreciate all the time you put into this.
Glad you enjoyed! Thanks for reading
Very impressive work!!! One of your best articles yet!
I wonder if there’s anything to the fact that 3 of the top 5 HR overperformers are Astro’s.
I hadn’t thought of that but it’s definitely interesting! Maybe it’s all that pine tar :o
Bless you, Dan Richards. It’s a great article, a great stat, and also a great place to send people when they ask why I’m so “down” on Tommy La Stella.
You can send em to me and I’ll set em straight. Glad you really enjoyed it Scott!!!
That list of five “lucky” players should not be included in a fantasy advice column because it might seem sensational or click-baitish to include All-Stars on the sand list as a guy you’re trying to tear down in La Stella.
La Stella owners are overjoyed with his first 30 games and don’t care about any new metric that says he’s lucky, or he’s never done this before. The main point is he is doing it now. And now is all that matters in the new landscape of fantasy baseball.
I quite literally subtracted one column from another to see who the *model* thinks has been overperforming. I don’t feel one way or another and this wasn’t an “advice column.”
Besides, if your takeaway from this entire article is that Tommy La Stella is a good player, then you’ve sorely missed the point. He was not the focus.
FIRST RATE work my dude. As an aspiring stats nerd, I truly appreciate the detailed explanation when you could have chosen to gloss over it. Very much looking forward to more articles of a similar vein.
Thanks for the feedback! I’m really glad you enjoyed it and it’s comments like these that make me want to continue.
Was this article written a while ago? Because all of La Stella’s numbers are now significantly higher than stated in this article. 8.6% Barrels, .291 xBA, .507 XSLG.
Granted it looks like pHR still doesn’t like him 5.1 versus 11.
I am correct that his Brls/PA% is 6.8%, you’re referencing his Brls/BBE%, which is 8.6%. You can review Statcast leaderboards to see the discrepancy.
It’s possible I made a mistake on the xBA and xSLG. I wrote the bit about him Tuesday, so it’s also possible (though highly unlikely) that his xBA and xSLG have increased since.
Nice catch though! Thanks for reading
I just took my ap stats exam yesterday and love how this connects baseball with complicated statistics! I was also wondering if this is the same process you’d go through to find other x or p stats or if there is a different process and if so how you’d change it. Love the article
Probably the same but with different stats if i’m looking for a different outcome. I’m really glad you liked it though! :)
As someone mentioned, the Astros are a bit strange. Could it be there tiny stadium to why they are on the list?
Dahl is interesting. I use exvelo as my evaluation and he has awful exvelo. But according to you, he’s been unlucky. Odd stuff I must say, but using your formula, he is due for some good luck. Plus playing in Colorado is something positive if the Rockies just play their youngsters.
And JD Martinez appearing on both lists are a bit strange. Does this suggest he MIGHT be the best hitter in baseball, If he is both elite and VERY unlucky?
On JDM: another Pitcher List writer mentioned that pHR might overestimate his homers specifically, because he pulls a lot of GB and hits a lot of FB the opposite way.
So, he’s pulling a lot, and hitting a lot of FB, two of my inputs, but not in good ways. Next iteration will substitute in pulled FBs specifically