


Boy, did I go down the rabbit hole this time. Let me explain.
Last week, I thought a fun idea for an article would be diving deep on the high ground-ball rate sluggers (e.g., Christian Yelich) to see how they’re hitting so many home runs and whether it’s sustainable. The thinking behind the article was to see which ground-ball sluggers could maintain their lofty home run totals. Of course, a primary reason for their success was exit velocity. When they do actually hit fly balls and line drives (FB/LD), they generally hit them quite hard. The percentage of their total hits that were hit above 95 mph (Hard Hit%) was high, too.
Fine, that’s all well and good. But analyzing Wilson Ramos and Wil Myers is where things got really confusing. The easiest way for me to explain is with a table.
| Name | LA | GB% | Pull% | Exit Velocity on FB/LD | Hard Hit% | Brls/PA% | HR/PA% |
| Wilson Ramos | 4.4° | 54.9% | 40.1% | 95.4 mph | 47.0% | 5.5% | 3.6% |
| Wil Myers | 9.2° | 43.6% | 50.2% | 95.5 mph | 45.7% | 4.7% | 3.2% |
I was struck by how Ramos’ Barrel% and HR/PA% were higher than Myers’. Myers more than doubles Ramos’ average launch angle, hits fewer ground balls, hits his FB/LD harder, and hits the ball “hard” nearly as often. In addition, Ramos’ Pull% was 10 points lower than Myers’, so Myers took advantage of closer fences more frequently. What would make Ramos’ Barrel% and HR/PA% better than Myers’?
And that’s when I had an epiphany. Maybe Ramos, despite producing more ground balls that drag down his average launch angle, still hits a greater percentage of his total balls in play at the best launch angles for power than Myers, thus offsetting the extra ground balls and producing more barrels. Put differently, maybe he’s more efficient than Myers with his non-ground balls. For his percentage of best-launch-angle balls to be higher than Myers’, he would have to hit more FB/LD at those angles despite having fewer opportunities to do so due to his higher GB%. Likewise, while Myers hits fewer ground balls overall, perhaps the remainder of his total balls in play were hit either above or below the best launch angles for power more often than Ramos’.
Broadly speaking, maybe ground-ball hitters who are able to hit more of their non-ground balls at the best launch angles can maintain higher home run totals (in combination with high exit velocities, of course). Maybe it’s even a skill, such that these guys can always best their low average launch angles and high ground-ball rates. Does it even matter that they hit a high share of ground balls, if they’re still hitting enough fly balls at great angles for homers otherwise?
Experimenting
So I set out to quantify the angles that produce the best power outcomes, and each player’s percentage of balls in play at those angles. Fortunately, there’s a handy table from Statcast that I used (reproduced below as a graph) to pick the best angles for home runs.
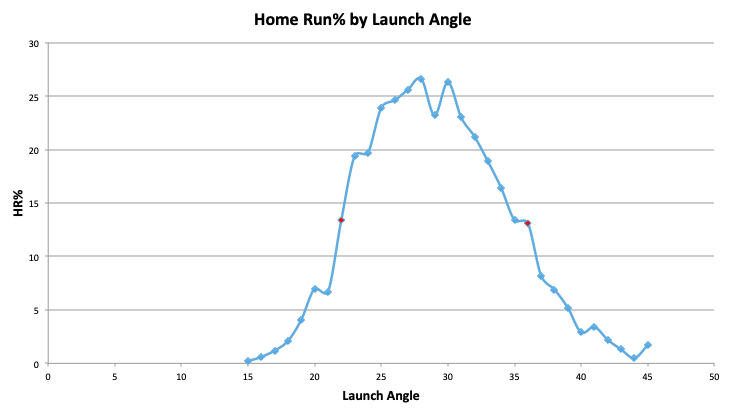
As you can see, the best launch angles for home runs are between 22-36° (highlighted in red), because the percentage of home runs per ball in play at each launch angle tapers off at 21° and 37°. As a result, I wanted to see the percentage of balls hit between 22° and 36° for each player. I call this percentage HROpp%, short for Home Run Opportunity Percentage. Put simply, this provides the opportunity each player gives himself to actually hit home runs. It’s the percentage of balls he hits in play in the band of launch angles that really could become a home run.
For some context, the average HROpp%—or the average percentage of balls in play that were hit between 22° and 36°—for all hitters with at least 150 batted-ball events (BBEs) in 2017 was 16.71%. In 2018, the average was 17.35%. Importantly, HROpp% appears to be, in part, a measure of skill. The R-squared between 2017 and 2018 was 0.28147. Put differently, about 28% of the variance in the 2018 HROpp% sample can be explained by 2017 HROpp%. Similarly, the R-squared between 2016 and 2017 was 0.2423. Having a high (or low) HROpp% clearly is repeatable to a degree.
Application
In addition, the R-squared between 2018 HROpp% and HR/PA% was 0.1095. That’s neither incredibly high nor insignificant. Andrew Perpetua put it best when he wrote, “Exit Velocity trumps angle.” It’s more important for home runs, then, that a hitter is able to hit the ball hard than he is capable of hitting at the appropriate angles. If a low average-launch-angle hitter hits hard enough, he can still capitalize on the few opportunities in which he finds himself in the 22-36° range. However, both HROpp% and raw power are necessary for great home run success. A hitter needs both raw power and sufficient home run opportunities to truly be an elite power hitter.
Let’s use an example.
| Name | LA | GB% | HROpp% | Exit Velocity on FB/LD | Hard Hit% | Brls/PA% | HR/PA% |
| Ryan Braun | 5.8° | 48.4% | 12.1% | 97.4 mph | 49.5% | 7.8% | 4.47% |
| Christian Yelich | 4.7° | 51.8% | 16.1% | 97.2 mph | 50.8% | 8.8% | 5.53% |
As you can see, ground-ball sluggers Ryan Braun and Christian Yelich both hit their FB/LD extremely hard (10th and 13th overall, respectively), and they hit the ball hard often. In fact, they’re nearly identical in those respects. And neither gets a boost from home park, because they play for the same team. Still, by just looking at the Statcast leaderboards, one would expect Braun’s Barrel% and HR/PA% to be higher than Yelich’s given Braun’s higher average launch angle. Braun even hits fewer ground balls. Yet, Yelich bested Braun in power because his HROpp% was much higher. Yelich isn’t stronger than Braun, he just capitalizes on his non-ground balls by elevating them between 22° and 36° more frequently.
I’d also note that Braun’s HROpp% was similarly about 12% in 2017 and 2016 (remember how I said it was repeatable?). So, even though he’s got elite power, Braun shows no signs of altering his approach, such that his ceiling is probably capped at about 30 HRs (if he plays a full season). He just doesn’t elevate often enough at the proper angles to exceed that output. However, he’s also a testament to how much more vital exit velocity is than launch angle to home run output. His Barrel% was still well above average and he hit 20 homers in 445 PAs despite hitting so few balls between 22-36°.
That brings me back to Myers and Ramos. Afraid of Ramos next season given his low launch angle and high GB%? Don’t be. He produced great exit velocity on his FB/LD and a high Hard Hit%, so he’s primed to capitalize when he actually hits the ball in the air. Significantly, he also had a 15.13 HROpp%. That’s below average (17.35%) to be sure, but does not deviate to such a degree that he would have been unable to capitalize on his raw power. Hence the 5.5 Barrel%, which, while not elite, is pretty good for a catcher.
But Myers is cause for concern. You can’t simply posit that injury sapped his power, because, like Ramos, his exit velocity on FB/LD and Hard Hit% were both near-elite. And even though his average launch angle was higher, his HROpp% was significantly lower: 11.87%, ninth-lowest among all hitters with 150 BBEs. This explains why both his HR/PA% and Barrel% were lower than Ramos’, despite maintaining similar raw power metrics and double the average launch angle. Myers struggled to fit his FB/LD into the 22-36° launch angles, sapping his power and portending an even lower ceiling than Braun given the weaker exit velocity and worse park.
Thus, Ramos generally elevates less than most hitters in the league, including Myers, but when he does, he is more skilled at reaching the 22-36° launch angles. Given that there is year-to-year correlation between HROpp%, this signals that Ramos can potentially retain his high GB% approach and continue his success, while Myers will need to significantly alter his approach to hit more home runs next season. Myers just doesn’t hit the ball hard enough to have such a low HROpp% and still hit a decent number of home runs like Braun.
Leaderboards
The way I like to conceptualize the interplay between exit velocity and launch angle is a hitter with great raw power will be elite with a high HROpp%, and a hitter with bad raw power can be only mediocre, but not great, with a high HROpp%. Whereas a player with great raw power but a bad HROpp% (e.g., Braun) can still be a good power hitter because exit velocity trumps launch angle. And a player with bad raw power and a bad HROpp% likely will hit little to no HRs. I’ve put this in a matrix for you to illustrate:
| Great exit velocity | Bad exit velocity | |
| High HROpp% | 1. Elite power | 2. Mediocre power |
| Low HROpp% | 3. Good power | 4. Bad power |
I also think taking a quick look at the top 10 in 2018 HROpp% (min. 150 BBEs) will help show the interplay between exit velocity and launch angle.
| Name | HROpp% |
| Matt Carpenter | 26.83% |
| Brandon Belt | 26.53% |
| Lucas Duda | 25.33% |
| Nicholas Castellanos | 24.15% |
| Daniel Descalso | 23.98% |
| Daniel Murphy | 23.71% |
| Yan Gomes | 23.69% |
| Eugenio Suarez | 23.53% |
| Paul DeJong | 23.27% |
| Eduardo Escobar | 22.99% |
Matt Carpenter is an example of box one of our matrix. Have you ever wondered why Matt Carpenter was so successful last season? How he hit 36 home runs? Well, there are a lot of reasons, but it wasn’t because he hit the ball harder than anyone else in the league. His FB/LD traveled at 94.4 mph (76th overall) and his Hard Hit Rate was 44.6% (43rd overall). In fact, Ramos and Myers best him in both of those categories. This is good, not great, raw power. He also pulled the ball quite a bit (48.3%) and hit copious fly balls (46.9%), but so did a lot of other players, and most fly ball hitters with strong pull tendencies still didn’t hit 36 homers. These things all helped, but it was in combination with his unparalleled ability to produce hits at the exact angles he needed to make them more likely to leave the park. And therein lies the value of HROpp%: a hitter with good raw power can be one of the best power hitters in the league if he’s efficient with his batted balls by hitting them at the best angles for home runs.
That brings me to our next hitter, Brandon Belt, who illustrates box two of the matrix. First, Belt’s inclusion on this list highlights how powerful it can be to hit at these launch angles. He hits his FB/LD 90.5 mph on average (260th overall) and he hits the ball over 95 mph just 31.6% of the time (239th overall). Yet, he managed an above-average 6.8% Barrel Rate (67th overall) because he hit the ball at the best launch angles for power more often than any other hitter besides Carpenter. Second, Belt also highlights how “exit velocity trumps angle,” and how HROpp% must be used in connection with other metrics to predict home run success. Belt hit only 14 homers in 456 PAs last season, despite maintaining excellent launch angles, because he doesn’t hit the ball very hard or hit it hard often. He also plays in a ballpark where pulled fly balls from lefties go to die. His home run ceiling is consequently limited by his raw power, despite the great launch angles. This shows that while a high HROpp% can help a hitter get the most HRs out of his batted balls, it only goes as far as his raw power allows.
Moving on, here are the bottom 10 in 2018 HROpp% (min 150 BBEs):
| Name | HROpp% |
| Orlando Arcia | 8.37% |
| Jose Reyes | 10.00% |
| Melky Cabrera | 10.14% |
| Jarrod Dyson | 10.80% |
| Eduardo Nunez | 10.84% |
| Eric Hosmer | 11.02% |
| Rafael Devers | 11.48% |
| Jon Jay | 11.82% |
| Wil Myers | 11.87% |
| Yangervis Solarte | 12.00% |
We’ve already shown box three with Braun. For box four, let’s consider Melky Cabrera. He hit his FB/LD 90.5 mph (258th overall), and his Hard Hit Rate was 41.0% (85th overall). Sound familiar? His exit velocity on FB/LD was the exact same as Belt’s, and he actually hit the ball hard considerably more often. And yet, his Barrel% was less than a third of Belt’s. This is explained by his HROpp%, which was so low that, though he had similar power, he was unable to utilize it as Belt did.
Going Forward
If you’re curious about every player’s HROpp% going back to 2015 (min. 50 BBEs), I’ve posted them all here. To the extent you find it helpful, my advice is to use HROpp% in connection with Statcast’s exit velocity metrics.
To sum it up, you can use HROpp% to:
- Separate those ground-ballers with raw power that are skilled enough to hit homers (e.g., Ramos, Yelich) from those with limited ceilings (e.g., Myers, Braun).
- Identify why certain hitters with good raw power and average launch angles (e.g., Carpenter) are more successful than others.
- Explain how certain players with limited raw power hit more homers than their counterparts (Belt vs. Cabrera).
It’s time to start thinking critically about how we use launch angle and batted ball data to evaluate power prowess. It’s time to use HROpp%.
It’d be interesting to determine the underlying factors in this, and how sticky it is. Is it simply having a narrower band of LA (low StDev in LA), which would eliminate the really high and really low angles? Or is there more to it? Presumably, to get an ideal average launch angle we’d not only need to know EV, but also the spread, or StDev, of launch angles for a particular hitter. It may be be that hitters with a tight spread do better at a lower average launch angle because they get the benefit of all those line drives without really hitting many worm burners directly into the dirt in front of the plate.
There are probably two ways to do it. Like you mention above, having a tight spread and hitting lots of low drives and home runs, or hitting lots of ground balls and maximizing with the remainder of your BIPs. The former feels more like Freddie Freeman, and the latter like Eric Hosmer circa 2016-17, Braun, Ramos, etc. (which we know because of their high GB%).