


Mike Moustakas and I have a long and storied fantasy baseball history. Six years ago, my significant other and I were invited to join a home league hosted by a mutual friend of ours. The exciting part about the invitation was that we were going to do the draft live and in person at Spring Training. I had been playing Fantasy for close to a decade but for my girlfriend, this was her first fantasy league ever let alone her first live draft. This was the year Mike Moustakas was supposed to break out and he was my #1 sleeper target. Long story short, we ended up with consecutive picks with my girlfriend picking right before me. I had a plan, I really did. I was gonna draft Moose in the 15th round. The 15th round rolls around and I can’t find Moustakas anywhere. I use the search function. I scan the 3rd baseman, I look everywhere and for the life of me I cannot find him. So I glance over at my girlfriend’s computer and ask her if she can find him on her computer, which she can. Finally, I am able to find him on my computer, but I’ve made the fatal mistake of letting my girlfriend know that I was targeting him and wouldn’t you know it, right before my pick, she snatches him up right in front of me! Now, we are a couple that high fives often, so much so that our friends introduce as “the couple that high fives a lot.” As I start throwing out accusations of treason and betrayal she simply looks at me, holds up her hand and says with a smile “High-Five?” Thus was born her team name “High Fives Of Betrayal.” I couldn’t even be mad at her.
Since that day, I have been slightly obsessed with Mike Moustakas. The classic case of what might have been. I finished in second place that year. I want to say, Pablo Sandoval was my 3rd baseman that year. Would I have won that year with Moose by my side? I have like Sliding Doors-style dreams about that season. So when Mike Moustakas broke out in 2017 with 38 HRs a few years later, believe me, I was there and the grapes were sour. Then 2018 came around and the AVG and HRs dropped and the grapes were less sour. Yet this offseason, when researching my overrated/underrated column for 2nd Baseman, I was sucked right back in. I was convinced that the power would hold steady if not recover slightly and the AVG would come roaring back with a vengeance. I also compared him to a mini-corn dog (they’re so good!) but that’s beside the point. The actual point is I was very wrong. He’s been even better than that, way beyond my expectations so far this season. I had predicted 30 HR and a .270 AVG. At the rate Moose is currently going, he might get that before the All-Star Break. The best part is all the evidence suggests that it is very, very sustainable. Let’s start with what his numbers would look like at the end of the year if he continues at his current pace.
| Year | PA | G | AVG | HR | R | RBI | SB | 2B |
| 2019 So Far | 271 | 62 | .280 | 21 | 45 | 45 | 3 | 14 |
| 2019 Prorated | 706 | 162 | .280 | 55 | 117 | 117 | 8 | 37 |
I honestly had to triple check my math to make sure I did the proportions correctly. That’s not just best 2nd Baseman in 2019 numbers, that’s NL MVP numbers. Obviously, a lot could happen over the rest of the season and a straight proration is a quick and dirty projection. It’s not fully accurate by any means. What it does do is tell you just how good Moustakas has been so far this year. By the way, did you see the 2Bs numbers as well? If he continued this pace we’re talking about 93 Extra Base Hits! 52.2% of all his hits so far this season have been for Extra Bases. That’s nuts. This is before we mention the fact that he’s already two SB away from tying a career high. Not enough hay is being made about how good Moustakas has been. Let’s dive in a little deeper though. Check out his underlying stats over the last 3 years.
| Year | BB% | K% | OPS | wOBA | wRC+ | .ISO | LD% | FB% | GB% | Oppo% | Cent% | Pull% | HR/FB% |
| 2017 | 5.7% | 15.7% | .835 | .345 | 114 | .249 | 19.5% | 45.7% | 34.8% | 23.3% | 33.0% | 43.7% | 17.8% |
| 2018 | 7.7% | 16.2% | .774 | .329 | 105 | .208 | 19.7% | 46.3% | 34.0% | 23.1% | 34.2% | 42.6% | 12.8% |
| 2019 | 7.7% | 18.8% | .940 | .397 | 140 | .313 | 22.3% | 44.0% | 33.7% | 28.2% | 30.8% | 41.0% | 24.7% |
Okay I know I threw a lot of numbers up there so let’s talk about them in two categories The first set is about perspective:
| Year | OPS | wOBA | wRC+ | .ISO |
| 2017 | .835 | .345 | 114 | .249 |
| 2018 | .774 | .329 | 105 | .208 |
| 2019 | .940 | .397 | 140 | .313 |
These numbers are helpful at putting into perspective just how good Moustakas has been so far this season. Over last three years, he has been an above average hitter by wRC+ so it’s not surprising wRC+ likes him again this year but so far he’s been 41% better than the average hitter which is fantastic. wOBA paints an even more compelling picture. While he’s always been an average to above average hitter by wOBA (especially for a hitter that doesn’t walk a ton), his current .390 wOBA ties him for 18th in the league with Carlos Santana and Kris Bryant and is tied with Tommy LaStella for first overall at second base. His current OPS of .940 ranks 16th in the league and #1 amongst Second Baseman by about 50 points. Based on OPS+, he is 40% better than the average hitter. Finally, his ISO is the true standout statistic for Moose, as his .313 ISO ranks 11th in the league and leads all Second Baseman by 56 points. He’s easily been the best second baseman in baseball and it’s not even close.
Now let’s look at his approach. The second set of data I listed above is designed to give a start at answering the first question at the heart of this article which is: how is he doing it, aka what is different?
| Year | BB% | K% | LD% | FB% | GB% | HR/FB% | Oppo% | Cent% | Pull% |
| 2017 | 5.7% | 15.7% | 19.5% | 45.7% | 34.8% | 17.8% | 23.3% | 33.0% | 43.7% |
| 2018 | 7.7% | 16.2% | 19.7% | 46.3% | 34.0% | 12.8% | 23.1% | 34.2% | 42.6% |
| 2019 | 7.7% | 18.8% | 22.3% | 44.0% | 33.7% | 24.7% | 28.2% | 30.8% | 41.0% |
Okay, so both the BB% and K% are slightly elevated but nothing alarming or that would indicate change, especially when you note that his plate discipline ratings are virtually identical from year to year. LD% is up and GB% is down which is certainly what we want to see but again is it enough to explain the huge boost in production? Maybe some of it but I’m not satisfied with some of it so let’s keep digging. The first thing that stands out is the elevated HR/FB% which is extremely high. Only three players in baseball finished 2018 with an HR/FB% greater than 25.0%—Joey Gallo, Christian Yelich and J.D. Martinez—so it’s reasonable to expect some regression in the HR/FB%. With that being said, I have two reasons to think it won’t fall all the way back to 2017’s 17.8%. The first is that league-wide HR/FB% is up 2.1% from 2018’s 12.7% all the way to 14.8% in 2019. It would be unusual for league-wide rates to be up that much and see a masher like Moustakas not see a share of that increase.
We’ll cover the second reason once we get to his Statcast data, but before we do that I want to touch on his batted ball data real quick. As you can see, there is a year to year decrease in Moustakas’ Pull% and his Cent% also drops from 2018’s 34.2%. This all adds up to a 3.6% increase in Moustakas’ Oppo% which I firmly believe has helped lead to his immense success so far this season. It seems like going the other way is a deliberate answer by Moose to counteract teams shift heavy approach towards him. In fact, Robert Murray over at The Athletic covers this subject beautifully which cements for me that this is a genuine change in approach as opposed to white noise. To give an idea of just how much success Moustakas is finding when he goes the other way, I’m going to compare Moustakas’ opposite-field batted balls with the league average in several key statistics.
| Player | xBA | xSLG | xwOBA | ISO | AVG Exit Velocity | AVG Launch Angle |
| League Average 2019 | .273 | .456 | .309 | .190 | 85.0 MPH | 25.2 |
| Mike Moustakas 2019 | .314 | .515 | .356 | .245 | 86.4 MPH | 26.7 |
As you can see, Moustakas is performing well above the league average when he hits the ball to the opposite field this season. All the above numbers are elite with the ISO, in particular, catching my eye. That’s an elite ISO for pulled balls let alone for opposite field batted balls. Once you factor that in, it’s clear where a lot of the additional power output is coming from.
Next, I want to talk about Moustakas’ Statcast data as I think it really completes the puzzle. Here are his numbers over the last three years including 2019:
| Year | Average Launch Angle | Average Exit Velocity | BBL% | Total BBLs | Oppo BBLs | Hard Hit% |
| 2017 | 18.3 | 87.3 | 8.6% | 40 | 1 | 33.5% |
| 2018 | 19.6 | 89.3 | 8.8% | 42 | 3 | 39.1% |
| 2019 | 18.5 | 90.3 | 12.6% | 24 | 3 | 45.5% |
Here, the decrease in launch angle is actually a good thing. My suspicion is that a large portion of that decrease in Launch Angle is due to the extreme decrease in Infield Fly Ball% from 19.2% in 2018 to 11.9% in 2019 and an overall decrease in Pop Up% from 13.8% in 2018 to 13.1% in 2019 to go along with the increased LD%. This is a perfect example of how we sometimes need further context to really understand a change in averaged stats. With that in mind, I want to take a look at Moustakas’ Launch Angle Charts from the last three years.
2017: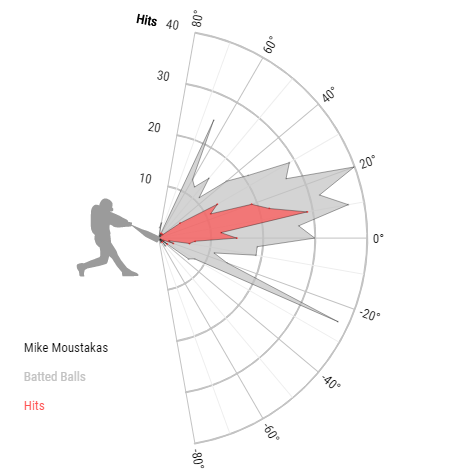 2018:
2018: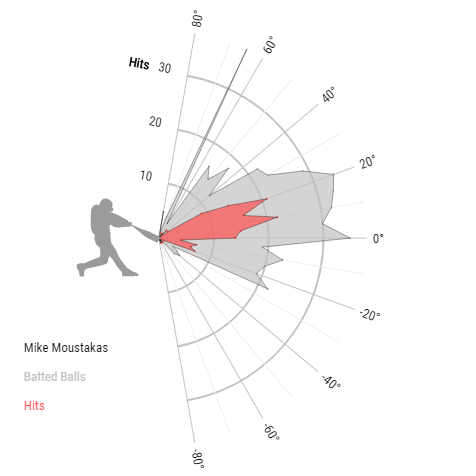
2019: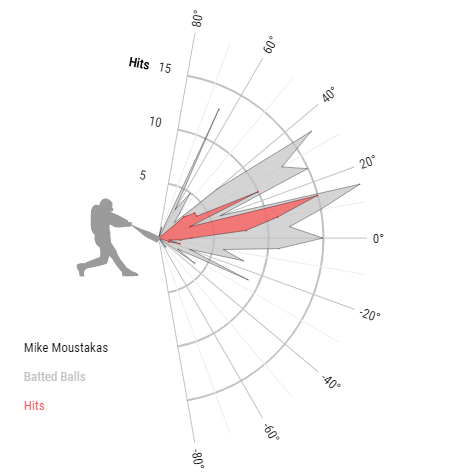
A few notes on the charts because, while I find them immensely useful, sometimes at a glance they can be overwhelming. The grey spike represents all of Moustakas’ batted balls in that year. The red areas represent all of his hits. The further the spike extends outward on the chart, the more batted balls/hits with that launch angle. At a glance, a few things stand out to me. The first and perhaps most encouraging is how the last large red spike in 2019 ends at 5 degrees. Very few groundball hits for Moose so far this season compared to past seasons. The other thing that revs my motor here is the red spike on the 2019 chart that sits right around 18 degrees. Here’s how many hits Moose had in each of those years with a launch angle of 15 -20 degrees and their results and Statcast data alongside a prorated 2019:
| Year | # of 15 – 20 Degree Hits | xBA in this range | xSLG in range | Exit Velocity in range | Hit Distance in range | Oppo Batted Ball in range | BBL in range | 1B in range | 2Bs in range | 3B in range | HRs in range |
| 2017 | 32 | .659 | 1.101 | 92.3 | 297 Ft. | 5 | 4 | 8 | 10 | 0 | 4 |
| 2018 | 33 | .607 | 1.003 | 90.9 | 284 Ft. | 7 | 7 | 7 | 7 | 1 | 1 |
| 2019 | 19 | .684 | 1.323 | 98.7 | 315 Ft. | 3 | 8 | 6 | 7 | 0 | 2 |
| 2019 Prorated | 50 | .684 | 1.323 | 98.7 | 315 Ft. | 8 | 21 | 16 | 18 | 0 | 5 |
You can see why it is so important to look at hits with this sort of launch angle. I think these numbers speak for themselves. He’s on pace to hit way more batted balls in this range than ever before and he’s hitting them harder, farther and based on the barrel numbers, is barreling the ball over double the previous year’s totals. This easily explains the elevated doubles numbers and the batting average improvements. Now, let’s repeat this exercise for his other large spike in his 2019 chart, where hits and batted balls overlap right between 22 and 27 degrees, and see what we find.
| Year | # of 22 – 27 Degree Hits | xBA in this range | xSLG in range | Exit Velocity in range | Hit Distance in range | Oppo Batted Ball in range | BBL in range | 1B in range | 2Bs in range | 3B in range | HRs in range |
| 2017 | 34 | .499 | 1.288 | 89.7 | 331 Ft. | 6 | 9 | 0 | 0 | 0 | 6 |
| 2018 | 35 | .588 | 1.741 | 95.8 | 355 Ft. | 9 | 16 | 0 | 1 | 0 | 11 |
| 2019 | 13 | .499 | 1.621 | 95.1 | 352 Ft. | 5 | 5 | 0 | 0 | 0 | 5 |
| 2019 Prorated | 34 | .499 | 1.621 | 95.1 | 352 Ft. | 13 | 13 | 0 | 0 | 0 | 13 |
While Moose is hitting balls in this range at the same rate as previous years, he’s getting better results. This might be due to some ballpark luck, as I’ve talked about the last few weeks, but none the less, we are seeing the success in this range from last year carry over to 2019. When you combine these numbers with the previous chart, it becomes pretty clear where his success has been coming from in terms of power, especially once you factor in that he is still achieving this level of production while going the other way more than ever with batted balls in these ranges. These numbers are the second reason I think his power production is sustainable.
So at this point, I feel like we’ve established how Moustakas is achieving his incredible numbers so far this season but as I mentioned before, this only answers the first question on our minds. That second question, that thing that everyone is wondering right now is how legit is all this production? Does luck play a role in what has happened here? Let’s take a look at a combination of BABIP and overall xStats to get an idea of just how legitimate Moustakas’ numbers are.
| AVG | xAVG | SLG | xSLG | HR | pHR | wOBA | xwOBA | BABIP | Depth Charts BABIP |
| .280 | .275 | .593 | .540 | 21 | 14.90 | .397 | .377 | .276 | .266 |
So xBA and BABIP support the results so far and xwOBA is close enough that we can call those results supported as well. The elephant in the room is the HRs compared to Dan Richard’s fantastic new stat pHR and the 50 points of SLG that go along with the missing HRs. This is where my last couple of Going Deeps come in handy. A quick glance at his home run distances makes them seem pretty legit as only three of his home runs were shorter than 375 feet and none of them were shorter than 350 feet. Fourteen of them went further than 400 feet. This is not to call out pHR in any way, this is just a case where diving into why the numbers disagree can shed some light onto why the two numbers differ. I’m willing to meet the two numbers somewhere in the middle and say Moose should have around 18 HRs at this point in the season. Even if all his numbers were to mirror the xStats and pHR numbers exactly, that would still put him on pace for an above average wOBA, solid AVG, and 40+ HRs. It’s hard to argue with those numbers.
So what conclusions are we supposed to draw from this? Second Base so far this season is a black hole, a barren wasteland of mediocrity and sadness. Second Base makes fun of catcher but only because it’s trying to compensate for its own inadequacies compared to the other positions. Only 10 Second Baseman even have a wRC+ over 100. The tenth best wOBA for Second Base is Jonathan Schoop’s .329! You don’t often do well in fantasy analysis by recommending people buy high on a player. It’s always risky business taking that leap, but given the Second Base landscape, if you missed out on one of the top ten options, I cannot recommend enough that you go out and get Mike Moustakas. Even if he ends up reverting back to normal, dependable Moustakas in the second half that’s going to carry you through. Barring injury, it seems destined that Moose ends up with 40+ HRs with 90+ Runs and 90+ RBIs and at least a .270 AVG. He’s hitting the ball harder, squarer and father than ever before and doesn’t seem to be showing any signs of slowing down.
Featured Image by Justin Paradis (@freshmeatcomm on Twitter)
IIRC last year Moose got off to a hot start as well (not sure if it was as hot as this year, but he was good early), and then he regressed a lot over the remainder of the season. I have no idea if that’s been a career trend for him, but that might be worth checking.