


Lots of hay is being made about Paul Goldschmidt’s three-home-run game. Or the fact that Yoan Moncada has yet to swing and miss. Or Yu Darvish’s uniquely bad debut.
I try not to overreact to these kinds of things. Instead, with the season underway, I’d like to take a step back and look at how league trends are affecting fantasy baseball. Keeping these in mind is probably more relevant to roster moves, trades, and the like than the above oddities from week one. Indeed, if you know that, for instance, stolen bases are at a 21-year-low, you might think twice about flipping Adalberto Mondesi after a strong week one for a starting pitcher, as you won’t be able to replace his production on the wire.
Various writers have written about some of these trends on other sites, but I thought I’d collect it all for you, supplemented with my own research, and then explain how it is informing my approach to the 2019 season. At the very least trends are interesting, if not useful.
Batting Average is on the Decline
Hopefully, you were aware of the fact that league-wide batting average has been on a free fall when you were drafting last week. If not, let me drop some knowledge on you.
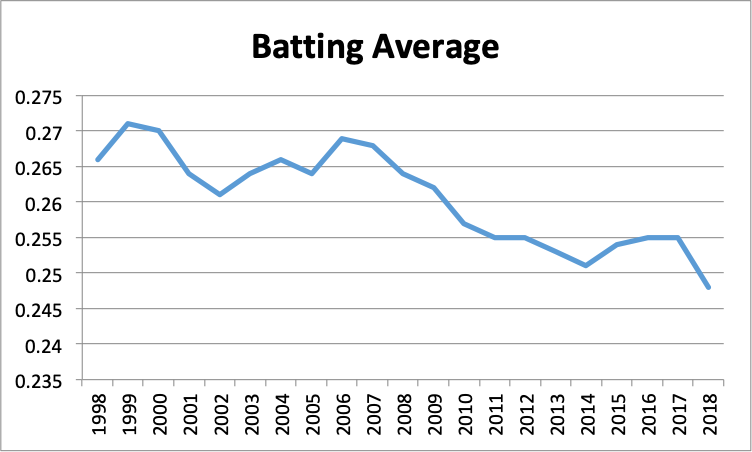
In 2018, batting average across the league fell under .250 for the first time. One could speculate that the fly ball revolution has contributed to this decline. BABIP on fly balls is of course low. It’s also true that league-wide BABIP dropped from .300 to .296, a seven-year low. But the overall fly ball rate actually dropped one-tenth of a percentage point from 2017 to 2018. That rate was actually higher in the late 2000s than in the last few years too, even though batting averages were higher back then.
No, the more likely culprit is the historic rise in strikeouts. Indeed, 2018 saw a league average strikeout rate of 22.3%, the highest in history, and the trend has been year-over-year increases since the 1990s when 17% was the norm, the 1980s when 14-15% was the norm, and the 1970s when the average was in the single digits.
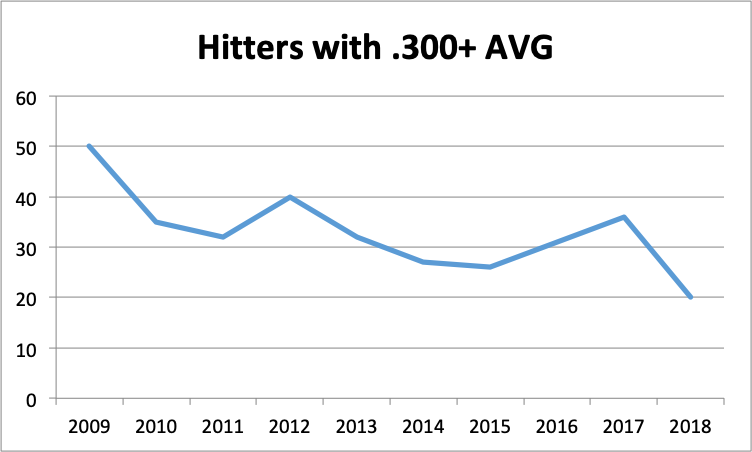
This trend has impacted hitters at the very top as well. In 2018, there were only 20 hitters with averages over .300, less than half the total of 50 in 2009. For our purposes, this makes batting average a precious commodity worth the reach in drafts and makes it harder to find on the waiver wire. It also means that you should hold on to whatever batting average you’ve already got for dear life.
Home Runs Remain Historically High
You may have noticed that the league broke the Opening Day home run record the other day. As I said before, we should be careful to draw conclusions from isolated events, but it would also be unwise to ignore the symptom of a larger trend.
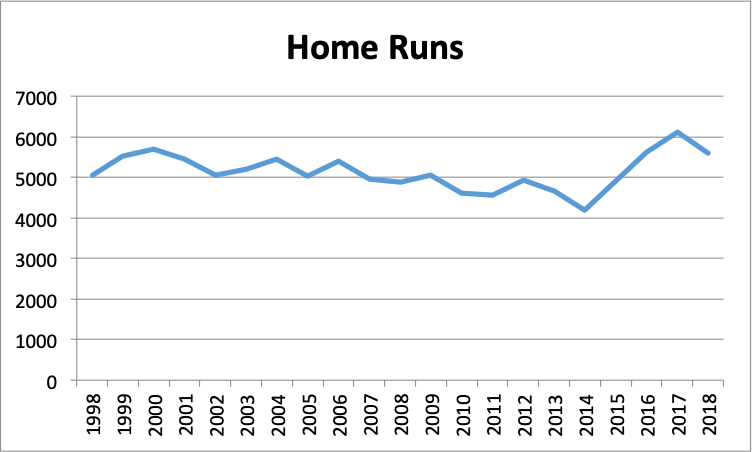
Sure, home runs haven’t been on a perfect upward trend since the 1990s because, during the Steroid Era, MLB set new home run records in 1999 and again in 2000. But in 2017, even those records were eclipsed. And again, in 2016 and 2018, the home run totals were higher than in 1999.
It remains to be seen whether the new three true outcomes approach to baseball will revert back to historical norms. Perhaps the ball truly is juiced and MLB lowers the seams going forward. Or maybe more hitters continue to elevate at greater rates. However, with league-wide home runs sitting at record rates, the fact is that home runs are more ubiquitous than ever.
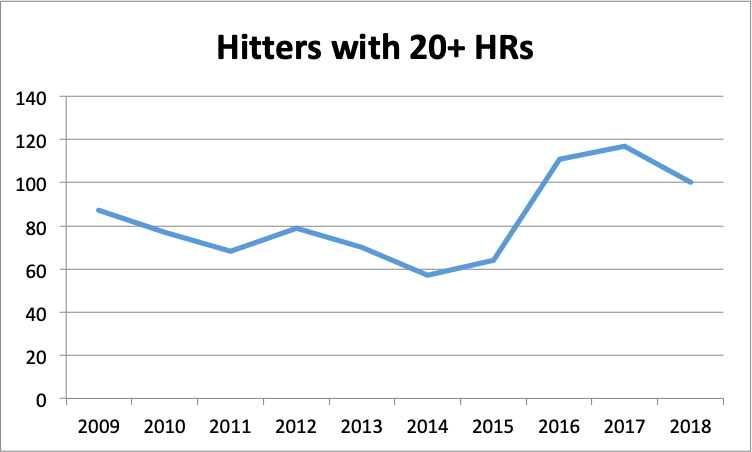
There are far more hitters in today’s game swatting 20 dingers than ever before. I remember thinking it was strange when, in 2016, Jean Segura, Addison Russell, Danny Espinosa, and Michael Saunders all hit over 20 homers, but that’s the reality we live in—it’s been three years of this now.
You should adjust your approach to fantasy baseball accordingly. Power is absurdly ubiquitous. With 20+ homer candidates all going late in drafts like Hunter Renfroe, Jackie Bradley Jr., Pete Alonso, Luke Voit, and others with that potential on the waiver wire such as Chad Pinder, Tyler White, and Ryon Healy, don’t make plays for guys like Gleyber Torres, Marcell Ozuna, and Rhys Hoskins. Their primary contribution will be homers and RBI, but it may not be so much different from those other guys.
Of course, this means you’ll need more power to be competitive in those categories. But you can stack a lineup with cheap power and remain competitive. I’d trade Torres, for instance, for a player like Justin Turner, who will do far more to put you ahead of the field in batting average than Torres will in power, then grab Pinder off the wire who can do exactly what Torres does. The reason is that everything is relative in fantasy baseball. In fact, I’d make that swap that even though I’m a Yankee fan.
Stolen Bases are Disappearing
Much has been made of the diminishing returns of stolen bases. Some have estimated that a player’s stolen base success rate must be at least 66%, while others have suggested higher, such as 72%, for the steal to be worth its potential opportunity cost.
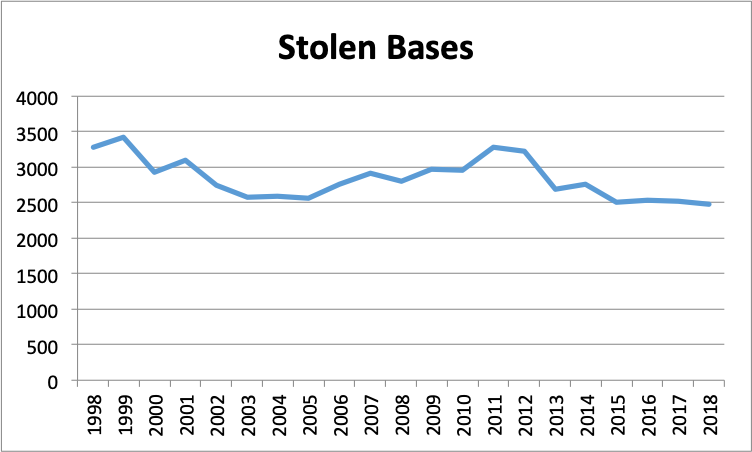
2018’s dip under 2,500 stolen bases is the lowest since 1994. No doubt this is the result of the promulgation of analytics and the newfound knowledge that, absent reaching a certain threshold success rate, steals aren’t worth it. Managers are understanding this more and more, so the reason for the decline in the stolen base is more red lights. But let’s focus on the effect, rather than the cause.
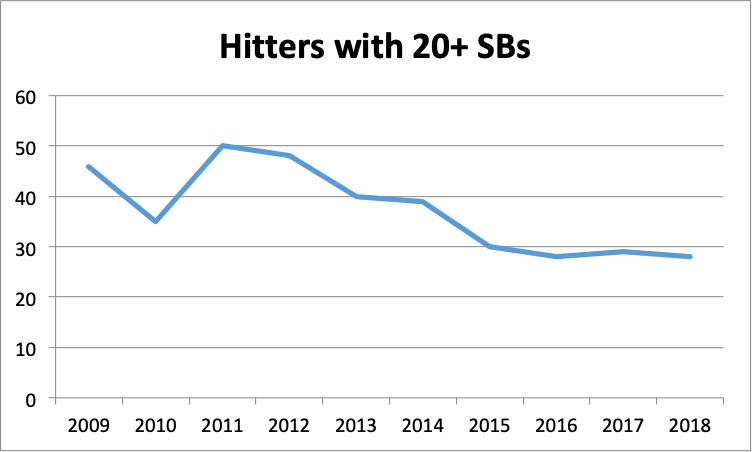
You may be aware of the fact that, in 2018, no player swiped over 50 bases for the first time since 2012. Whit Merrifield’s 45 steals represents the lowest-highest total since 1958. While I do expect at least one player to steal over 45 this year (Trea Turner), the fact remains that there are fewer and fewer players stealing bases. As recently as 2011 there were 50 players with 20+ SBs, now there are fewer than 30.
As with batting average, you should guard your steals with your life. Hopefully, you drafted some, because they will be hard to find on the wire. Now more than ever, stolen base specialists like Billy Hamilton, Mallex Smith, and Dee Gordon carry value. I used to avoid them like the plague, but I like to zig when others zag, and I took a chance in many leagues on them given the league-wide dearth in steals and these players’ newfound depressed value.
Starters are Pitching Fewer and Fewer Innings
Another advent of analytics is greater awareness of the third time through the order penalty. Realizing that, as the lineup turns over, wOBA, OPS, and many other acronyms get worse for pitchers because batters see them for a third time (and they tire), managers are increasingly pulling starters early. Managers also want to save pitchers’ limited bullets for the playoffs. It makes a lot of sense for real baseball, but has consequences for fantasy baseball.
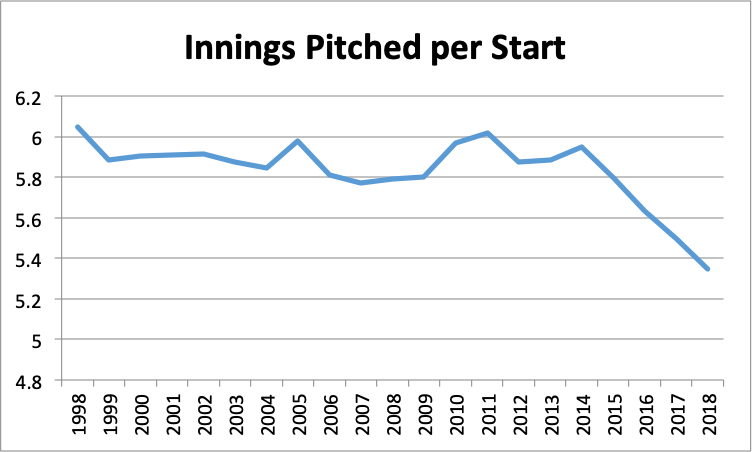
That’s a precipitous drop. Starting pitchers, on average, used to pitch over six innings per start. Now, that number has dropped under 5.4. Shorter starts are reflected in other ways as well.
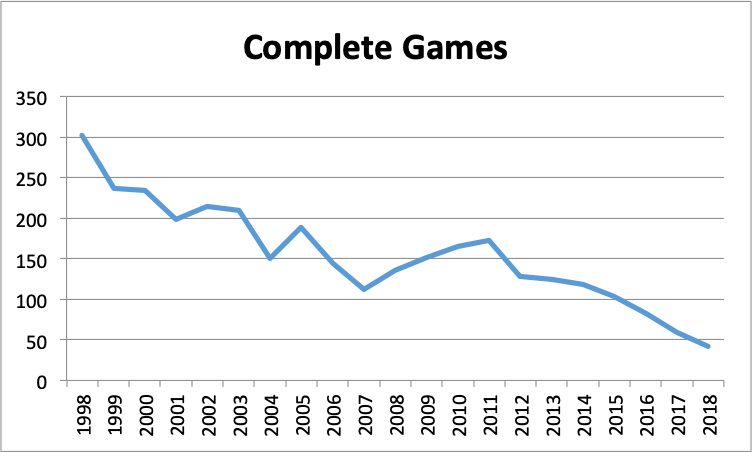
For the first time in many years, there were fewer than 50 complete games in a season. In addition, just 13 pitchers tossed 200 innings last year.
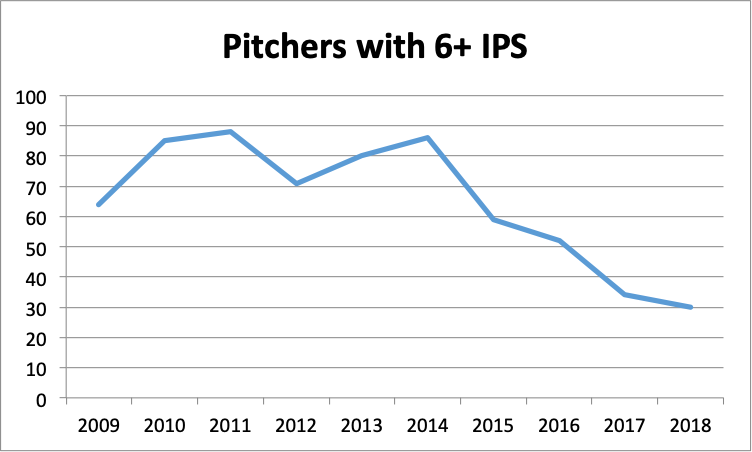
While it used to be that the typical starting pitcher went six innings, now only 30 do so on average. Certainly, having a deeper arsenal mitigates some of the third time through the order penalty. Just ask Trevor Bauer and his many pitches. It’s something most of these 30 pitchers have in common.
But what does this mean for us? I’d recommend investing in volume-heavy pitchers on the cheap, either via trade or waiver wire. Guys like Jeff Samardzija or Kyle Freeland can go six innings or longer regularly, perhaps as a result of some combination of stuff, tenacity, and their managers’ styles. I don’t really care about the reason though, just the result. More innings means more strikeouts and a better shot at wins or quality starts. Conversely, you possibly should reconsider your investment in guys like Nick Pivetta. Some combination of losing gas, third time through the order penalty, and Gabe Kapler put him at a paltry 5.1 IPS for 2018. Indeed, Pivetta only threw 4.2 innings in his 2019 debut. Just food for thought.
Starters’ Strikeout Rates are on the Rise
By beginning with the decline in batting average, I was unable to bury the lede for this one. As more hitters increasingly pursue the all-or-nothing approach, both home runs and strikeouts have become more prevalent while batting average has declined. It’s also true to some degree that pitchers are striving for more strikeouts than ground balls, as 2018 represented the lowest ground ball rate amongst starters since 2002, though it was only between one and two percentage points lower than it had been in recent years.
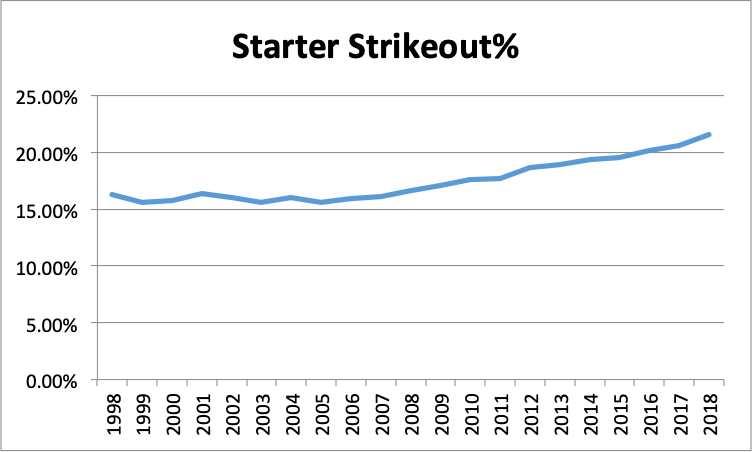
As you can see, strikeout rates are on the rise for starting pitchers, with the norm now sitting at a hefty 21.6%. Swinging strike rates have, unsurprisingly, increased too.
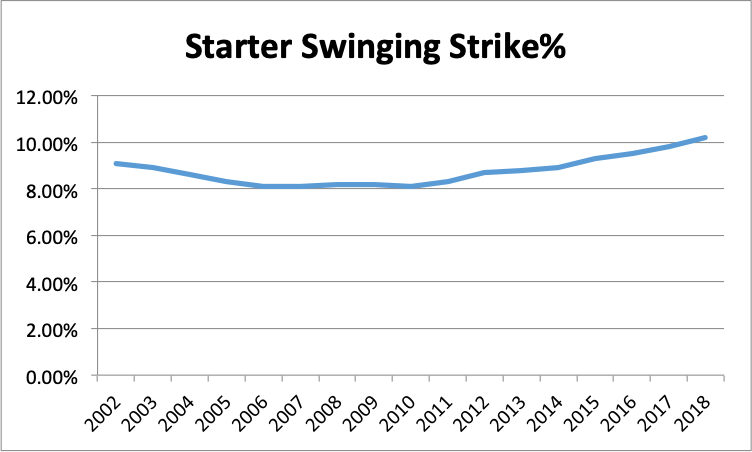
As I said before, everything in fantasy baseball is relative. You only win if your pitchers strike out more batters than your opponent’s. Swinging strike rates under 10% and strikeout rates under 21% are no longer even MLB average, let alone good enough for a fantasy baseball roster.
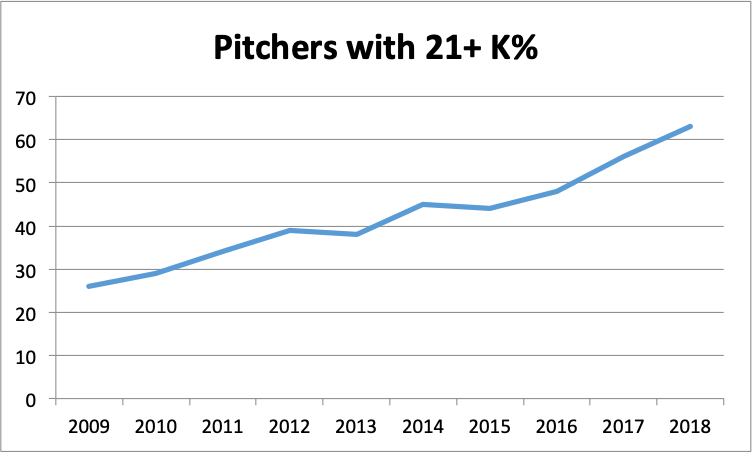
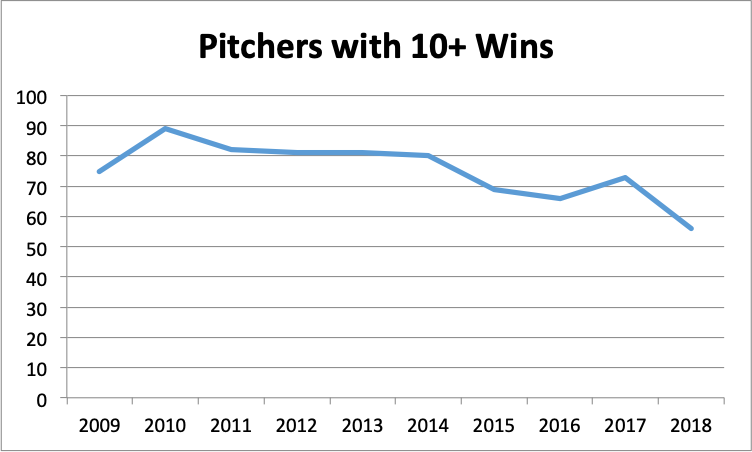
Accordingly, there are more starting pitchers with 21%+ strikeout rates than ever before—more than double the number in 2009. With that in mind, Madison Bumgarner, Kyle Hendricks, and their 19.8% strikeout rates are putting you in a deeper hole than you might otherwise think.
Likewise, strikeout pitchers should be available on the cheap, meaning that perhaps it makes sense to swap expensive strikeout pitchers with questionable ratios, like Jose Berrios or Robbie Ray, for a great hitter, then just play the wire. As hitters are striking out more and more, I fully expect guys like Chris Paddock, Ross Stripling, Kenta Maeda, Pablo Lopez, and others with similar strikeout upside will be available at a much cheaper cost than Berrios and Ray. They were in the draft, and more of them will appear on the wire. They could give you similar production, just at a much cheaper cost.
Starters’ Wins are Disappearing
It’s becoming more and more difficult to earn wins in today’s game. No doubt the result of starters having shorter leashes, as they give their lineups fewer innings—and, therefore, opportunities— to score runs so they can leave with the lead.
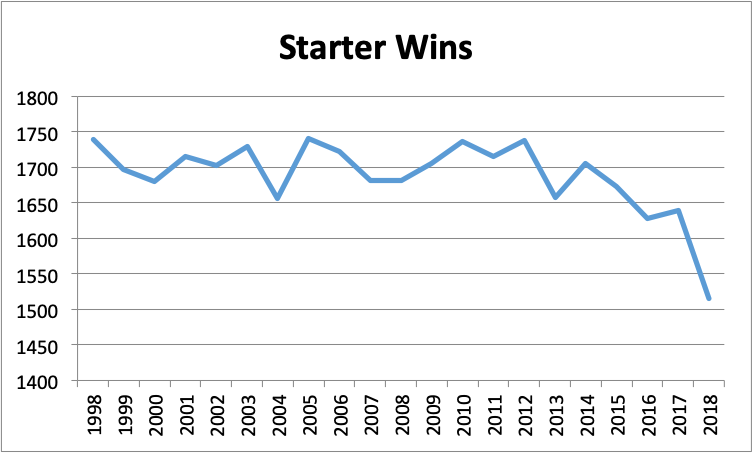
This trend in wins makes starting pitchers on great teams significantly more valuable, while starting pitchers on terrible teams are less valuable than ever. Even though Jacob deGrom was the best pitcher in baseball last year, the Mets inability to deliver him wins sapped a lot of his value relative to aces on other fantasy teams.
46 pitchers, including Sonny Gray, Zach Eflin, and Shane Bieber, each of whom pitched fewer than 130 innings, earned more wins than deGrom. Of course, I’m not saying they’re better pitchers than deGrom, just remember that their wins hold a lot of value because wins are disappearing.
Thus, even bad pitchers like Rick Porcello have value just by virtue of the team name on their jerseys. On the one hand, I’d again be looking to dump Bumgarner, or even Luis Castillo, because their win expectancies are much lower given the teams they play for. If you can get a good hitter for one of them, it might make sense to do so and scour the wire for pitching. On the other hand, guys like Nathan Eovaldi and J.A. Happ who provide production and wins are probably giving you a greater leg up on your competition than you think.
Honorable Mentions
It should be noted that the amount of relievers earning large numbers of saves has also declined due to analytics. Now, managers play their best relievers at the moments in the game that feature the highest leverage, and managers like to play matchups, which results in more closer committees. Alex Fast wrote a great piece about it, I recommend giving that a read.
Separately, Hard%, as measured by Baseball Info Solutions and reported on Fangraphs’ player pages, is at an all-time high, while Medium% is at a corresponding historical low.
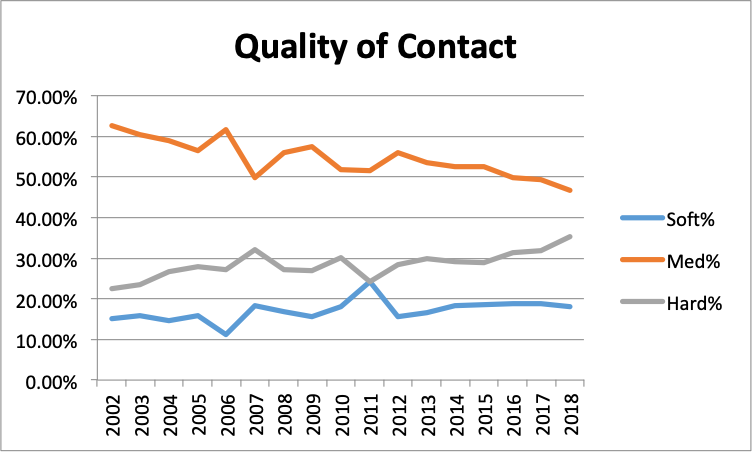
The average Hard% was 35.3% in 2018, up significantly from 31.8% in 2017. I’ve written more about this phenomenon, which you can read here and here. The short of it is that it appears that actual hard contact is not actually up across the league. For example, the average Hard Hit%, as measured by Statcast as the percentage of balls hit at 95+ mph, was lower in 2018 than it was in 2015. Due to inexplicable fluctuations, the subjective nature of these metrics, and the fact that Hard% does not correlate as strongly to power as many Statcast metrics, I don’t use Baseball Info Solutions’ quality of contact metrics anymore to evaluate players.
Conclusion
Trends are always subject to change. Perhaps we hit the high-water mark for home runs in 2017 and it’s all downhill from here. Don’t make decisions exclusively based on what I’ve noted, but keep these trends in the back of your mind.
I fully expect my strategy for 2020 to change based on new data from this season, I’m just not sure how. Nevertheless, I’m excited to see what 2019 brings.
Featured Image by Justin Paradis
Fantastic article. Dan Richards clearly a go to source on strategy!
Thanks! Much appreciated
Hey Dan – Great read and analysis! What are the top three sites that you used to collect your info? Than
Thanks John! Mostly Fangraphs League Leaderboards and Baseball Reference