


Understanding the success of a pitcher is one of the more complex analytical processes in existence. Handedness, repertoire, velocity, effective velocity, spin rate, movement, control, location, and sequencing are all ingredients in the primordial stew that eventually determines whether the pitcher is successful in the long run.
Given how all these variables interact with each other, it’s often difficult to determine what might be influencing a sudden breakout or a period of ineffectiveness. Fortunately, the sabermetric community has developed a hallmark bellwether statistic, swinging-strike rate, that captures the outcome of all of these variables in a nice, tidy bow.
Swinging-strike rate, measured as swings and misses divided by pitches, is an effective stat because it captures two components of a pitcher’s ability at once: the ability to induce whiffs (the swing-and-miss numerator), along with a pitcher’s control (total pitches, the denominator, which will be lower when the pitcher throws fewer noncompetitive balls).
But swinging-strike rate has several issues, perhaps the biggest being that it ignores a pitcher’s ability to induce called strikes, which is a true skill. It is also reliant on the behavioral biases of opposing hitters, as swinging-strike rate can be skewed by the varying swing rates of different players and teams in smaller sample sizes.
As a result, analysts should also consider a pitcher’s two-strike percentage (2-Stk%), an indicator that measures the share of pitches thrown in 0-2, 1-2 and 2-2 counts. Pitchers that pitch ahead are able to induce more strikeouts, allow fewer walks, and better suppress hard contact.
Two-strike percentage is just as robust as swinging-strike rate in explaining pitcher performance; however, it has the added benefit of capturing a pitcher’s called-strike ability. It also explains more of a pitcher’s contact suppression skill because exit velocities and barrel rates drop significantly in two-strike counts. Additionally, because two-strike percentage is less dependent on opposing batter behavioral tendencies, it can also reveal hints at an underlying change in pitcher performance sooner than swinging-strike rate.
Laying the Groundwork
I first noticed that there might be something to two-strike percentage when digging into German Marquez’s second-half surge in 2018. Marquez polarized the usage of his fastball and breaking pitches within counts, using the fastball to get ahead early and the slider or curve to punch hitters out with two strikes. Clearly, this tactic worked for Marquez, who became one of only seven pitchers in the past five years to post a half-season with a sub 2.50 ERA, FIP, and xFIP.
Marquez’s two-strike percentage increased from 23.4% in the first half to 27.4% in the second, a 4% gain that registered as the fifth-highest of any starter. When looking at the rest of the two-strike percentage surger leaderboard, it became apparent that almost every pitcher also experienced a marked improvement in run prevention as well.
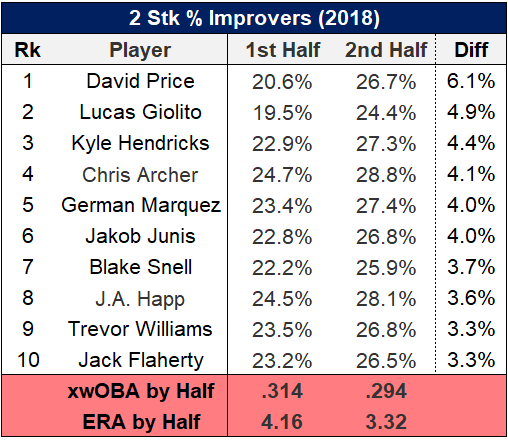
The cohort included second-half breakouts from Marquez, Kyle Hendricks, Blake Snell, Trevor Williams, and Lucas Giolito. They averaged a 4.16 ERA in the first half that plummeted to 3.32 from July 1 onward. Their cumulative xwOBA also experienced a similar decline.
But while this evidence is eye-catching, it’s ultimately anecdotal. We need more than 10 data points over a half-season to prove that two-strike percentage is a reliable measure of pitcher skill.
From there, I sorted starters from 2016 to 2018 who pitched a minimum of 400 innings, which came to 67 pitchers in total, and then analyzed how their two-strike percentage compared with metrics such as ERA and FIP.
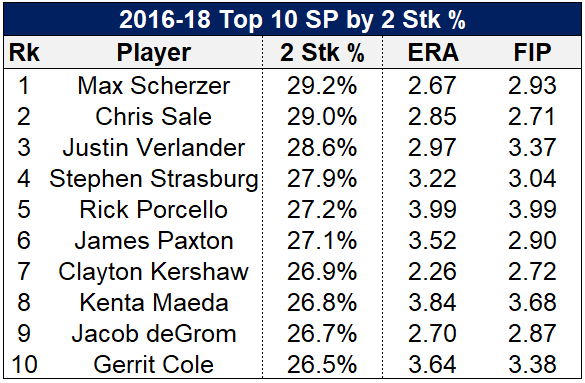
The top 10 in two-strike percentage from 2016 to 2018 is occupied by some of baseball’s best pitchers, headlined by Max Scherzer, Chris Sale, and Justin Verlander in the top three. The only real outlier is Rick Porcello, a crafty pitcher with good command but a lack of a reliable, whiff-inducing out pitch. Porcello’s presence on the list highlights that two-strike percentage should not be used in isolation but in concert with stats such as swinging-strike rate, an indicator which better identifies Porcello’s weaknesses.
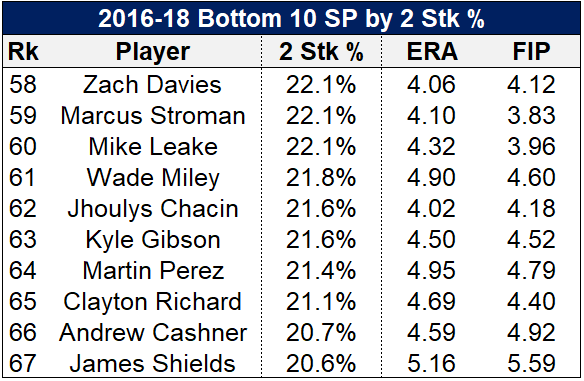
For as good as the top 10 in two-strike percentage looks, the trough looks equally bad. James Shields, arguably the worst pitcher in baseball the past three years, also has the lowest two-strike rate at 20.6%. The remainder of the bottom 10 is scattered with uninspiring names such as Mike Leake, Martin Perez, Clayton Richard, and Andrew Cashner.
I then used this data set to run correlations on two-strike percentage against strikeout rate, walk rate, BABIP, home runs per nine innings, ERA, and FIP. The results, with a comparison with swinging-strike rate included for good measure, are outlined below:
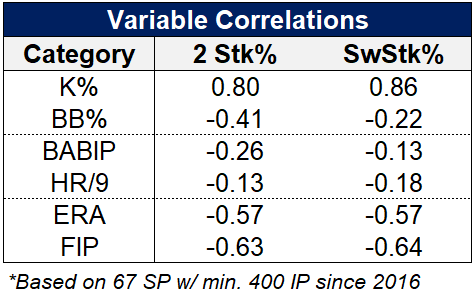
I was struck by the robustness of the results. Two-strike percentage is swinging-strike rate’s across-the-board equal, with near identical correlations on strikeout rate, ERA, and FIP, while two-strike percentage is actually better at relating to walk rate and BABIP.
Better than SwStr%?
The correlation between two-strike percentage and swinging-strike rate is 0.64, indicating that there is some redundancy in what both metrics attempt to explain. That’s not surprising because most pitching metrics correlate strongly with each other. This relationship also makes sense, with the ability to induce a swing and miss resulting in a greater ability to get ahead in counts, while getting the hitter to two strikes will improve the odds of a swing and miss.
If both stats tell similar stories, albeit, with some nuances, the pertinent question becomes which metric stabilizes first. Swinging-strike rate has long been known as the gold standard in fast-stabilizing pitcher metrics. Does two-strike rate exceed this standard?
To find out, I analyzed 126 starters who threw at least 300 pitches in a minimum of three months of the 2018 season. I then calculated the standard deviation exhibited by these pitchers in their monthly performance in both two-strike percentage and swinging-strike rate.
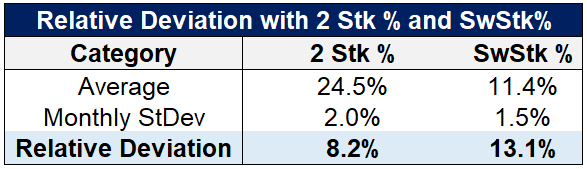
The relative monthly deviation of two-strike percentage was lower than swinging-strike rate, at 8.2% compared with 13.1%. In layman’s terms, this means that two-strike percentage exhibits less random variance than swinging-strike rate and is a more reliable small sample size indicator of pitcher performance.
How It Works
Now that we’ve established why two-strike rate is important, let’s dig into the how. The first place we need to start is by looking at how hitters behave via their swing rates in different counts.
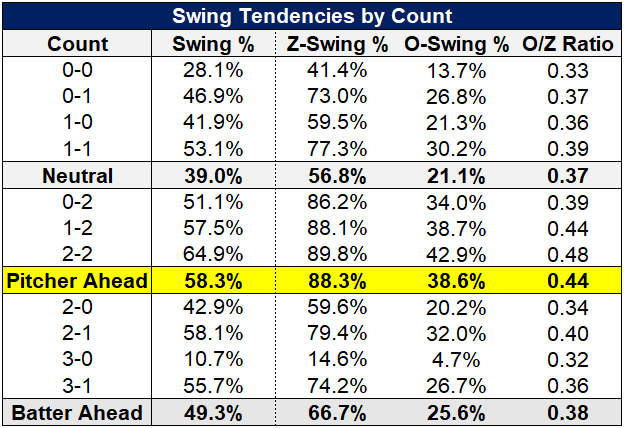
One thing is immediately clear — pitching with two strikes puts considerable pressure on the hitter to swing, with a swing rate of 58.3% compared with 39.0% in neutral situations and 49.3% with the batter ahead. Forcing the hitter to swing more is advantageous to the pitcher, as hitters can’t be as selective with targeting the locations and pitch types they like. The other benefit is that hitters swing at more outside pitches with two strikes, evidenced by their higher O/Z ratio, which is simply the ratio of outside swings divided by zone swings. The next step is analyzing if hitters make contact differently by count.
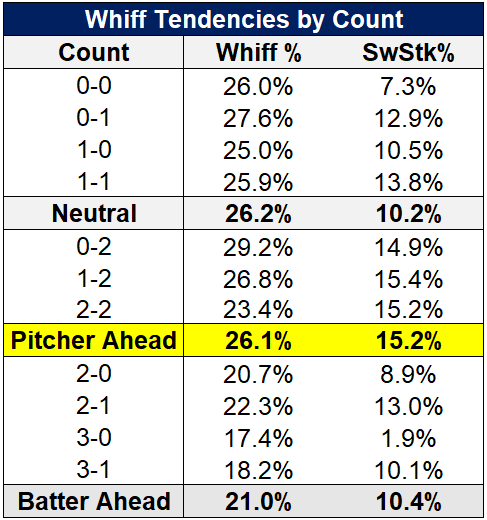
To my surprise, whiff rate does not go up with two strikes. It actually goes down as hitters put more defensive hacks on the ball. Swinging-strike rate does go up markedly with two strikes, but this is only because batters swing more. It’s in this sense that one can see how two-strike percentage is a precursor to swinging-strike rate and potentially a better stat to use overall, as two-strike percentage influences swinging-strike rate much more than the other way around. But what happens when hitters do make contact?
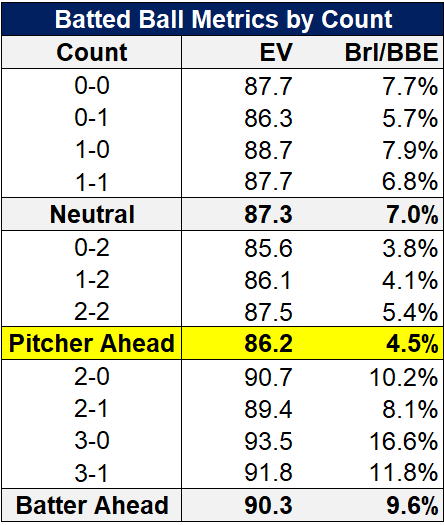
Here we find a massive difference. The exit velocity of hitters with two strikes is 86.2 mph, compared with 87.3 in neutral counts and 90.3 with the batter ahead. This likely explains why two-strike percentage has a decent negative correlation with BABIP. Barrel rate (barrels divided by batted balls) follows suit, ranging from 4.5% with two strikes to 9.6% with the batter ahead.
Pitchers to Target
Thanks for sticking with me through all of that. Now that most of the hard work is done, let’s identify some pitchers that could be confirming and/or teasing breakouts based on increases in their two-strike percentage since August 15 of last season ( allowing for roughly two months of playing time through the start of 2019).
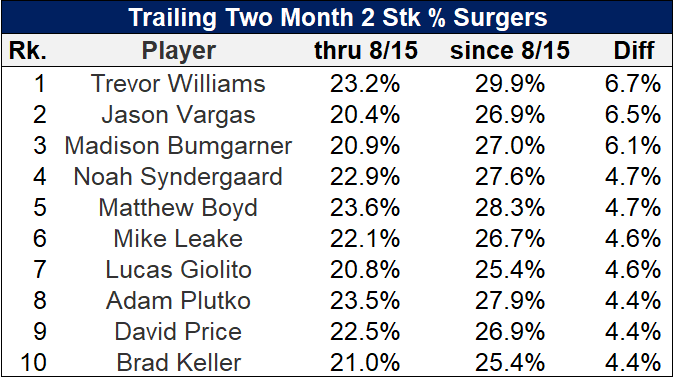
Williams, a player I wrote about earlier this week, is ignored by many in the fantasy and sabermetric community despite some very encouraging signs in his underlying profile. His 29.9% two-strike rate is the second-highest in baseball over the last two months. Meanwhile, Madison Bumgarner has been left for dead by many in light of dramatic and whiff rate declines, yet he has still been a strong run preventer as of late, likely because he’s improved significantly in getting ahead of hitters.
Matthew Boyd’s presence helps confirm the breakout he is currently undergoing. Perhaps Noah Syndergaard, already known as a top-tier pitcher, is ready to take himself to the next level of the elite by refining his approach to complement a devastating arsenal. Giolito, despite a rough start to 2019, has looked like a different pitcher over the last two months, both in terms of two-strike percentage and swinging-strike rate (as well as other indicators such as xFIP). While he may never reach his heralded potential as a top prospect, he at least seems on his way to decency.
Names such as Jason Vargas should obviously be viewed with scrutiny and reinforce that two-strike percentage should not be used in isolation but in addition to metrics like swinging-strike rate.
Pitchers to Avoid
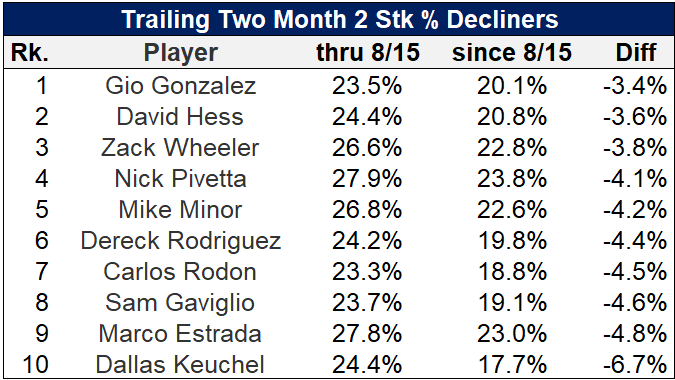
Dallas Keuchel had a rough finish to 2018 in both the two-strike percentage and swinging-strike rate departments. Perhaps teams know this and thus are hesitant to sign the 31-year-old to a long-term contract. Pitchers such as Marco Estrada, Sam Gaviglio, David Hess, and Gio Gonzalez were likely on few radars to begin with, but they have even less reason to be so now.
Zack Wheeler and Nick Pivetta, two pitchers with a lot of helium heading into 2019, have had very disappointing starts. Wheeler relied heavily on contact suppression in the second half of 2018, a skill that is now leaving him as his wonky control is forcing him to pitch more in hitter’s counts. Pivetta, previously known for his pinpoint accuracy, has also struggled with control early in 2019. While these two can certainly turn it around, I would monitor their two-strike rates before making any decisions on whether to liquidate or acquire them.
(Photo by Keith Gillett/Icon Sportswire)
Fantastic work.
Thank you!
Pivetta was never known for “pinpoint accuracy”. He has good control, but bad command (e.g. he can force the ball into the zone, but can’t put it where it should be). You can see this with eyeballs, but also in the stats (inflated HR numbers, similar to what we saw with Pineda and Robbie Ray who had the exact same problem).
That’s a good point. A decent walk rate and K/BB doesn’t always correlate with having great command.
Where can we find 2 strike percentage stats on our own?
Really great read man, good job! I second what Issac asked above. Love to know where your getting your 2-stk stats. Keep up the good work.
Thank you NotBurtReynolds!
To answer your Isaac’s question – you can pull this data from Baseball Savant’s search functionality! Go to the ‘Count’ section and select 0-2, 1-2, and 2-2.
Here are the leaders in 2 Stk % since September 1st of last season:
https://baseballsavant.mlb.com/statcast_search?hfPT=&hfAB=&hfBBT=&hfPR=&hfZ=&stadium=&hfBBL=&hfNewZones=&hfGT=R%7C&hfC=02%7C12%7C22%7C&hfSea=2019%7C2018%7C&hfSit=&player_type=pitcher&hfOuts=&opponent=&pitcher_throws=&batter_stands=&hfSA=&game_date_gt=2018-09-01&game_date_lt=&hfInfield=&team=&position=SP&hfOutfield=&hfRO=&home_road=&hfFlag=&hfPull=&metric_1=&hfInn=&min_pitches=500&min_results=0&group_by=name&sort_col=pitch_percent&player_event_sort=h_launch_speed&sort_order=desc&min_pas=0&chk_position=on#results
Man, this is solid. Thanks. A few thoughts:
1. May seem implied, but does 2 strike percentage assume pitchers do not improve accuracy with elevated pitch counts? Basically, does “warming up” make an argument?
2. Not directly related, but this article made me wonder if batters could have a 2 or 1 strike “handicap”? As though a metric for improving hitters would be how well they fare under the pitcher-ahead counts.
Thanks for the comment, Cody!
I haven’t looked into how 2 Stk % changes across innings and pitch counts, but this is a very good idea that I will explore further at some point.
That’s a great point about hitters. While good hitters will likely be involved in a lower share of two-strike counts overall, how a hitter does in terms of batted ball quality and whiff rate in those counts might show naturally reactive they are, since guessing largely gets thrown out the window. I will certainly look into this more.
Thanks Nick, happy researching!