


(Photo by Samuel Stringer/Icon Sportswire)
With the recent completion of the baseball season, a new series will be added to Pitcher List in review of the year. The series will be a quality of contact report broken down by position group. This may seem familiar, as the idea stems from past Fangraphs work. Former Fangraphs writer Tony Blengino did reports of this sort in the past. This will look similar to Blengino’s reports.
Each position has two charts. The first chart is the quality of contact report. It includes overall unadjusted and adjusted contact (first and last columns). The unadjusted figure is the individual’s batted ball performance relative to league average, and the adjusted figure is the expected batted ball performance for the individual. 100 is the league average, so a score of 107 would signify a batted ball performance 7% above average. The chart also includes raw Statcast exit velocities for each batted ball category (excluding pop-ups) and the unadjusted/adjusted performance for each batted ball category. For example, the U – GB – A is the unadjusted – adjusted score on ground balls. The highlighted cells signify a certain standard deviation from the average (key is below chart). The players chosen had to meet a minimum of 250 plate appearances at first base. Now, let’s begin with the first basemen from the American League:
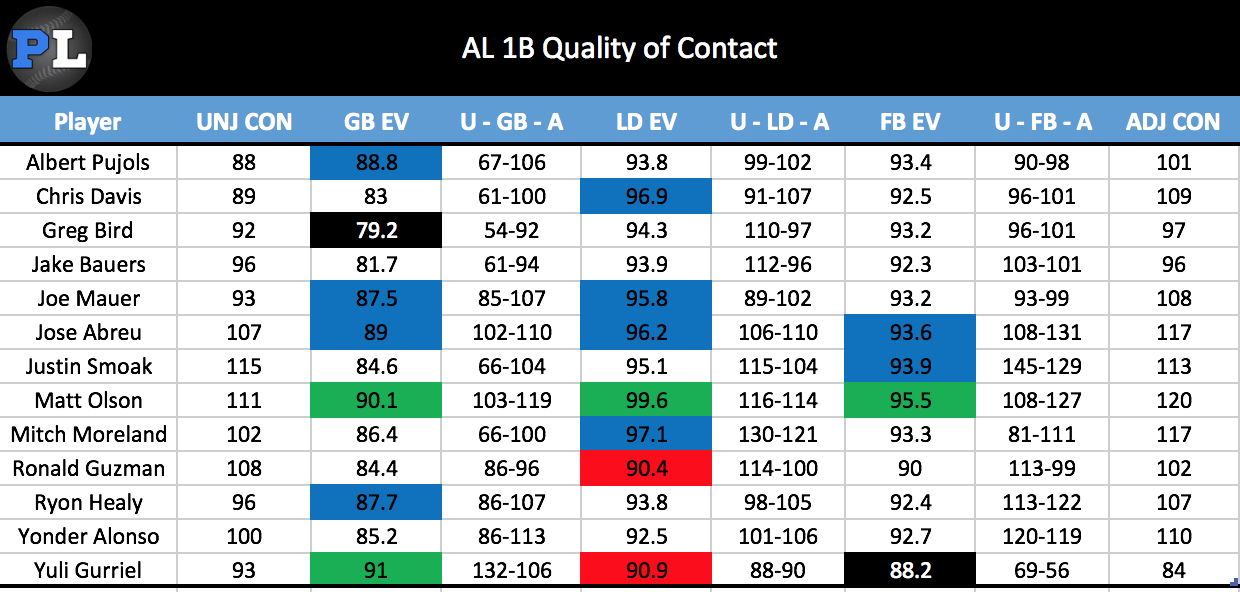
Green = Two deviations greater than average
Blue = One deviation greater than average
Red = One deviation lower than average
Black = One and a half deviations lower than average
The second chart includes frequency data from xStats.org batted ball categories. If you are unfamiliar with xStats, Dave Cherman provided a great run down to xStats here. I included these as they give a more comprehensive breakdown of batted ball distribution and certain batted ball types provide future predictability. It also includes the walk and strikeout rates for players. The highlighted cells follow the same standard deviation method as chart 1.
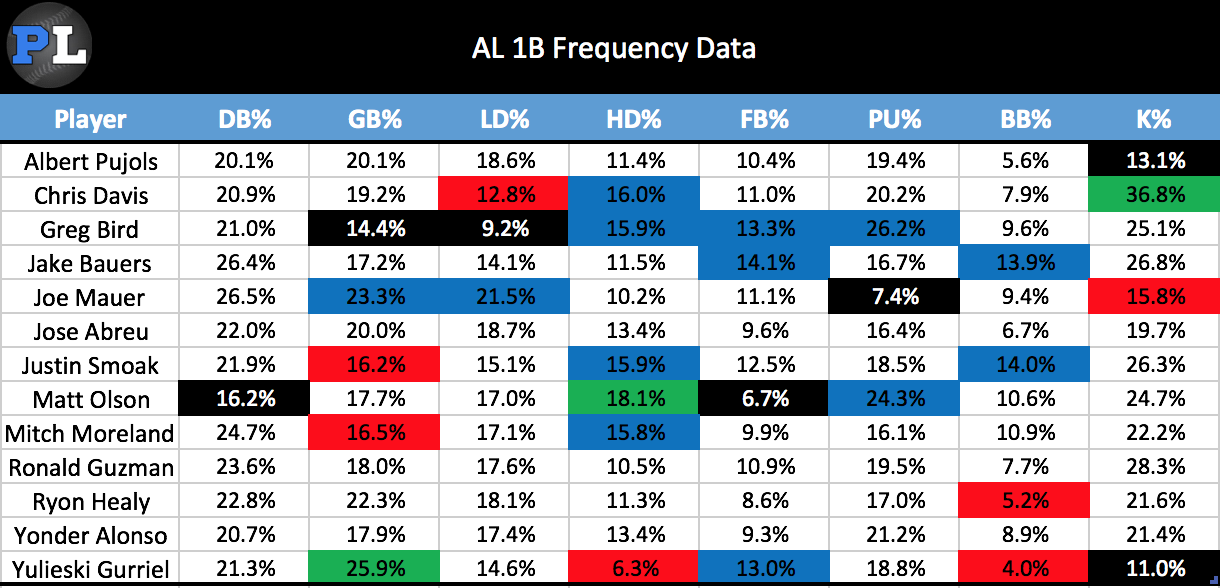
Green = Two deviations greater than average
Blue = One deviation greater than average
Red = One deviation lower than average
Black = One and a half deviations lower than average
Even with the different batted ball categorization between Statcast and xStats, there is still some overlap in naming between the two. To reduce the confusion, I have this table as reference:
| Statcast | xStats | ||||
|---|---|---|---|---|---|
| Batted Ball | Launch Angle | Abbreviation | Batted Ball | LA Average | Exit Velocity |
| Ground Ball | Less than 10˚ | DB% | Dribbler | -19.3˚ | 73.6 mph |
| Line Drive | 10˚ – 25˚ | GB% | Ground Ball | -0.7˚ | 92.3 mph |
| Fly Ball | 25˚ – 50˚ | LD% | Low Drive | 12.8˚ | 94 mph |
| Pop Up | Greater than 50˚ | HD% | High Drive | 24.7˚ | 102.5 mph |
| N/A | N/A | FB% | Fly Ball | 29.4˚ | 88.9 mph |
| N/A | N/A | PU% | Pop Up | 46.2˚ | 84.6 mph |
I noted that xStats batted ball categories help with quality of contact breakdown because they include more predictability year over year. To elaborate, high drives are the most predictable of the ability to hit the ball hard. Dribblers and pop ups are the most predictable of a lack of contact authority. Low drives are the biggest indicator of batted ball luck, as they have a very high BABIP but are the least predictable batted ball. Ground balls and fly balls also have very low predictability across seasons.
Additionally, as you can see in this chart, xStats batted ball types are not set at a specific angle range like Statcast is. xStats combines angle and exit velocity to determine the category of a batted ball. When referencing these batted balls in a situation that might be unclear, I will say whether it comes from Statcast or xStats. Any reference to a player’s average exit velocity is always discussing the Statcast categories.
Let’s start breaking down performance:
The position group as a whole mostly recorded above average expected contact performance, with the exception of Greg Bird, Jake Bauers, and Yuli Gurriel. Gurriel lags behind the rest of the group with a score of 84, and his score of 93 in the unadjusted portion lags behind as well. Gurriel’s season performance was barely salvaged by his ground ball performance, as he paces the group in ground ball exit velocity and unadjusted ground ball performance. Anything under 10 degrees falls in the Statcast ground ball category, but obviously things coming off the bat at a positive angle create far better results. Gurriel kept most of his ground balls in the above zero degrees (.337 wOBA) rather than the less than zero (.112 wOBA). Gurriel led the group in GB%, with his rate being two deviations above average. His incredible performance on ground balls can likely be contributed to this. Above 10 degrees, Gurriel did not shine. His line drive and fly ball exit velocities were one deviation and one and a half deviations below average, respectively. Gurriel was last in the group in balls hit at the optimal high drive range (1.154 wOBA), the category that demonstrates a repeatable skill to hit the ball hard. I wouldn’t expect a sudden power surge from Gurriel.
It was another lost season for Bird, as he was mediocre across all adjusted batted ball categories. He did demonstrate his ability to crush the ball is not lost, as his HD% was well above league average. Low drive rate (.727 wOBA) does not represent any repeatable skill and generally regresses towards the mean. Bird posted an incredibly low LD%, as an average performance in this category would have improved his batted ball numbers. The rookie Bauers stepped into the show hot, but a miserable second half tanked his overall numbers. Bauers performed at or near average in all exit velocity categories and in his batted ball distribution. A 13.9% walk rate did help negate some of the mediocre batted ball performance, though.
The aging Albert Pujols did nothing of note in his batted ball numbers, aside from an impressive ground ball exit velocity. Being the slowest man in baseball will mostly negate any ground ball authority, as seen in Pujols’ unadjusted ground ball performance. His plate discipline is long gone, and merely average contact numbers aren’t making up for that.
For how miserable his season was, Chris Davis‘ contact numbers are surprising. His overall adjusted contact performance was nine percent better than league average, and he scored at least average in every adjusted category. Davis also posted a high drive rate one deviation above average. Below average unadjusted performance in every batted ball category contributed toward the poor overall performance, and a low drive rate one deviation below average certainly didn’t help. Oh yeah, and the 36.8% strikeout rate.
Joe Mauer continued his typical line drive style, hitting a ton of his batted balls between 0-19 degrees. He produced significantly more batted balls than average in both the xStats ground ball and low drive categories – with the exit velocities to match in that range. This backs his .330 BABIP. Still, lack of elevation and limited high drives crushed his power numbers and stunted his overall contact performance. Mauer didn’t go out on a notable offensive season, but that does not prevent us from remembering how great prime Mauer was.
Jose Abreu is one of the exit velocity stars of the group. His exit velocity was a deviation above average for every Statcast batted ball category, resulting in the second best adjusted contact score of the group. His xStats batted ball breakdown does not standout nearly as much, but it also holds no red flags.
Justin Smoak crushed his fly balls, posting a great fly ball exit velocity and adjusted fly ball performance. His great high drive rate backs that. Solid numbers in the other categories culminated in a plus adjusted and unadjusted contact performance overall.
If you’re looking for the man of this group, look no further than Matt Olson. He paces the group in adjusted performance and his exit velocities are two deviations above average average for every batted ball category. His minuscule dribbler rate paired with an incredible high drive rate combine to create a batted ball profile from the gods. Olson did demonstrate a little bit of a pop-up issue, limiting his BABIP potential. However, the overall batted ball numbers and solid plate discipline are quite impressive.
Mitch Moreland quietly posted solid adjusted contact numbers this season, tying for second in the group in that figure. He finished with a great high drive rate and above average exit velocities. However, the majority of his Statcast ground balls fell below zero degrees, as he hit too few in the 0-10 degrees range. Moreland’s adjusted numbers heavily outperform his unadjusted numbers, which resulted in an unimpressive season.
Ronald Guzman, Ryon Healy, and Yonder Alonso all turned in above average adjusted contact performance despite nothing notable. Their xStats batted ball profiles have no significant deviations from the mean, and their statcast exit velocities mostly remained in the realm of average.
Now we can move on to the National League first basemen. Here is the same quality of contact chart as the first:
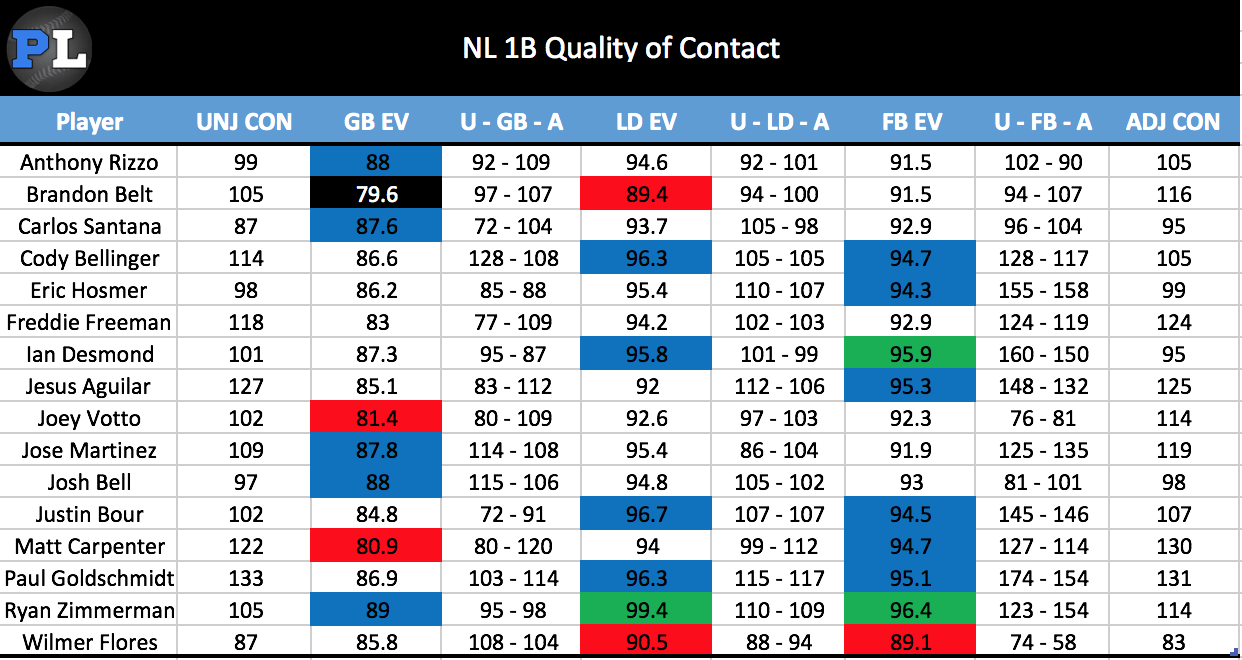
Green = Two deviations greater than average
Blue = One deviation greater than average
Red = One deviation lower than average
Black = One and a half deviations lower than average
That is our Statcast batted ball data, with contact adjustments for ball in play types. Here is xStats frequency data:
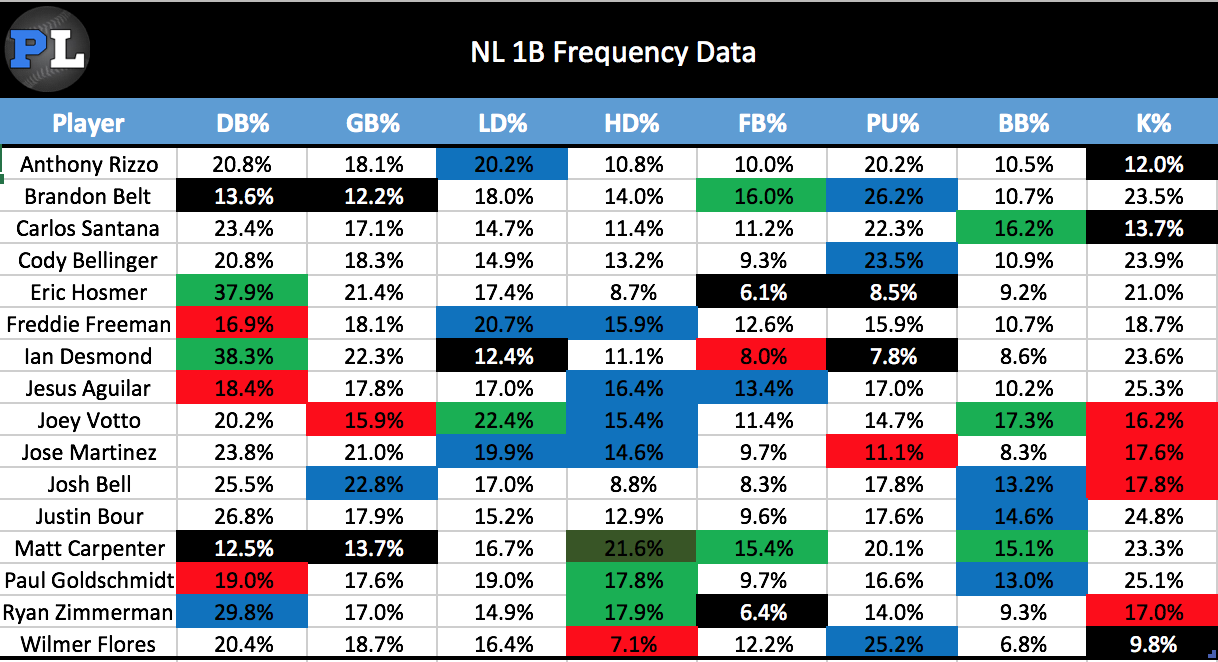
Green = Two deviations greater than average
Blue = One deviation greater than average
Red = One deviation lower than average
Black = One and a half deviations lower than average
Paul Goldschmidt and Matt Carpenter lead the pack for the National Leauge. Goldschmidt posted unbelievable Statcast fly ball numbers as shown by both his unadjusted and adjusted scores in that category. He was at least 14% better than league average in adjusted performance in all three ball in play (BIP) types in the Statcast data. Goldschmidt also had the significantly low dribbler rate paired with the significantly large high drive rate – the combination that forms the perfect representation that a player has the ability to drill the ball. Carpenter shined just as much across the board in the Statcast data. He didn’t quite have the exit velocities of Goldschmidt, but his frequency data makes up for that. Carpenter refused to put the ball on the ground. His 12.5% dribbler rate is absurdly low, and you may have noticed his HD% is a different shade of green. That is because his high drive rate was an absurd three deviations above the average. Carpenter’s exceptional play this year is entirely backed by the quality of contact numbers, shown by his incredible skill to hit the ball at optimal power launch angles.
Following those two, Freddie Freeman and Jesus Aguilar put together superb contact seasons. Freeman didn’t have any outstanding exit velocities, but his consistency across all Statcast batted ball types culminated in a great adjusted contact score. Freeman had the same small dribbler/large high drive rate as the other players who have performed well in adjusted contact. That combination is a clear theme in producing great contact. Aguilar’s breakout is supported by some great contact authority, especially in the Statcast fly ball department. Aguilar proved to be the same story as the other successful players with regard to dribbler and high drive rate – categories that are great future predictors of hard contact ability.
Anthony Rizzo‘s contact quality is a bit underwhelming compared to years past, posting disappointing adjusted contact numbers for Statcast line drive and fly balls. A significant drop in high drive rate from years past can be linked to the lesser power numbers. Rizzo still had the beautiful plate discipline, though.
Minuscule xStats dribbler and ground ball rates limited the number of BIP on the ground for Brandon Belt, which can be a great thing. He still posted a solid adjusted contact score, but Belt’s pop up rate increased significantly with that decrease in ground balls. He also traded some high drives for fly balls compared to years past, a sign that his contact authority may be decreasing. His home park hasn’t started doing any favors yet, either.
This is a contact quality report, but we can start with Carlos Santana by acknowledging he was an absolute plate discipline God. However, his contact authority was mediocre across Statcast BIP types and his xStats batted ball frequencies don’t hint at anything different. His contact authority certainly wasn’t worthy of the .231 BABIP he registered, but it didn’t shine too brightly on him.
You might look at Cody Bellinger‘s adjusted contact scores across Statcast batted ball categories (all at least 5% better than average) and wonder how he mustered a meager 105 score overall. Look no further than his xStats batted ball frequencies, which show a pop up problem. His exit velocities were great on his air balls and his other xStats BIP types show no red flags. Pop ups can really kill you.
Eric Hosmer showing what he can do with his fly balls while also putting everything on the ground is just too predictable. Hosmer holds the best adjusted contact fly ball score of the group. He also has a heinously high dribbler rate, hits no high drives, and hits no fly balls. Do great things happen when Hosmer elevates? Yes. Does he ever elevate? No. Ian Desmond followed right in Hosmer’s footsteps this year. His fly ball exit velocity and adjusted fly ball score are beautiful. He also posted an even higher dribbler rate than Hosmer. Desmond’s high drive rate is better than Hosmer’s, but he still put too many balls on the ground. At least both never popped up, though.
Joey Votto displayed a surprising lack of fly ball authority in his Statcast data. His xStats batted ball frequencies don’t show any launch angle issues, as his high drive rate increased from last year and was well above average. Lost exit velocity in his high drives is likely to blame for the drastic decrease in home runs. Votto’s launch angle still looks superb, but we may be witnessing a steady loss of contact authority. Being the beneficiary of a ridiculously high low drive rate doesn’t look good either. Of course his plate discipline was still there for all of us to enjoy.
After a great small sample in 2017, Jose Martinez was hyped up coming into the season. He did not disappoint. He had plus adjusted contact numbers across his Statcast categories and avoided pop ups, resulting in his 119 overall adjusted contact score. xStats backs the power numbers with an above average high drive rate and no red flags in other categories. Martinez proved his batted ball authority and looks good for next season.
Josh Bell‘s quality of contact figures are rather underwhelming. His ground ball exit velocity and high xStats ground ball rate speak to his higher BABIP, but his air ball quality is far from exceptional. The drop to 12 home runs are seen in his xStats high drive and fly ball rates. Exceptional plate discipline allowed for an above average offensive season for Bell, but the contact authority was certainly lacking.
Justin Bour displayed exceptional contact on his Statcast fly balls, posting a 146 adjusted contact score in that category. His xStats don’t show anything as impressive, but also no immediate red flags. A steep decline in low drive rate can likely be attached to the drop in production from 2017.
Finally, we have Ryan Zimmerman and Wilmer Flores. His health struggles have prevented him from making big contributions in recent seasons, but Zimmermancan still punish the ball. His air ball exit velocities were both great and his high drive rate points to his contact authority. On the flip side, a continually increasing dribbler rate does not match that impressive high drive rate. Any further gains in the dribbler rate could put Zimmerman in a contact danger zone. Ending with Floresis not ending on a high note. Terrible air ball exit velocities. Low high drive rate, high pop up rate. Not much to say other than Flores’ contact authority is terrible.
Comparing the two leagues, the NL outperformed their AL counterparts at the top end of the group. The AL first basement were largely disappointing. Only Olson produced an adjusted contact score of at least 120 in the AL. The NL had four players produce at least that number. The American League dragged first basemen to their worst production in a season as a position group this century. The National League held their weight compared to past years, but the American League actually finished with below average numbers relative to the whole league. That is incredibly unusual for a position known for offensive production.
Awwww, yes. I was super bummed when Blengino’s work stopped appearing on FG, so glad to see something similar being continued here
Same here. Always enjoyed Blengino’s unique work at FG and was sorry to see him leave. Another smart move by Pitcher List to pick up on this type of analysis.
Can you comment on Tyler White? Thanks!
Good work! This is a handy easy access tool.
I’m curious about the xStats pop-up designation. Perhaps I’m colored by what my expectation for a “pop-up” is, however the 40-43 launch angle range still provides for some meaningful hits (109 HRs in 2017), so I don’t know why they wouldn’t choose say, 45 as the cut off, when the meaningful hits basically cease all together.
I just updated it in the article, but xStats no longer defines their batted balls at a specific angle range. The current categorization is done from a combination of launch angle and exit velocity. So there are significantly less home runs at the pop up level when looking at the definition.