


Sorry, folks, despite the Shakespearean reference in the title, there will be no bad adaptations in today’s article (as my readers all breathe a sigh of relief). Last week we looked at how several ballparks have a tendency to create an environment where a batted ball that normally would be home run ends up a double instead. Oftentimes, this was due to some anomaly in the field itself—be it a large wall such as Boston’s Green Monster or Progressive Field’s Little Green Monster, or the sheer size of the outfield itself such as in Coors Field, PNC Park, Chase Field, or Globe Life Park in Arlington. This week I wanted to take a look at the other side of things. Are there hits that in certain parks end up getting over the fence for a home run that would normally be either a double or a harmless fly-ball out in most fields? It turns out that is absolutely the case.
Much like before, I wanted to establish a set of qualifications that would help narrow down which home runs we would look at. The thing is this time around, we’re kinda looking at a much simpler set of criteria. After looking at most of the parks, I really feel like homers under 375 feet in distance are the kind of home runs we wanted to look at. Anything hit further than that, we’re looking at home runs that would pretty much be home runs in any park. In that spirit, I searched Baseball Savant for homers under 375 feet and then grouped them by ballpark. Here are the top 15:
| Ballpark | HRs under 375 ft. |
| Minute Maid Park | 35 |
| Yankee Stadium | 28 |
| T-Mobile Park | 26 |
| Great American Ball Park | 24 |
| Rogers Centre | 22 |
| Citizens Bank Park | 20 |
| Comerica Park | 19 |
| Guaranteed Rate Field | 18 |
| Progressive Field | 18 |
| Petco Park | 17 |
| Oriole Park | 17 |
| Fenway Park | 15 |
| PNC Park | 14 |
| Oracle Park | 14 |
| Busch Stadium | 13 |
As you can see, there are a lot of parks that are pretty well noted for their home run tendencies. Just like last week, though, I want to dive deeper into a couple of the ballparks at the top of the rankings and see if we can discover some of the reasons those parks are sitting pretty at the top.
Part One: The Ballparks
Minute Maid Park (Houston Astros)
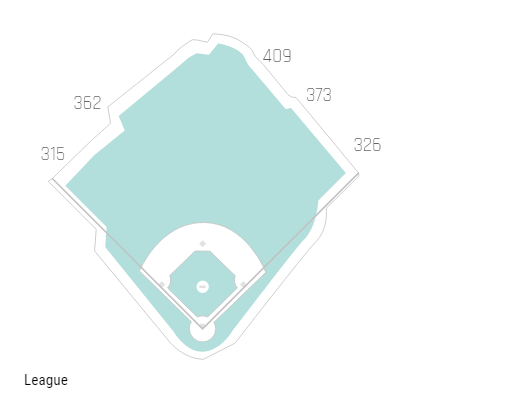
I almost included Minute Maid Park in last week’s piece, given how large the park is in center field and the power alleys, but then I looked at the data. Minute Maid Park wasn’t even in the top 15 for the “doubles that could have been home runs elsewhere” category yet actually sat atop the leaderboard for the opposite statistic. In fact, it leads the No. 2 park by over eight home runs! Why? Take a look at the 19-foot left field wall. At first, you would suspect that to have lead to more doubles, but that 315-foot distance is close enough to home plate to negate the height of the wall. What normally would be a routine fly ball ends up clearing the fence for a home run. Think of it this way: In 2019, over 3,018 balls have been hit in the air that traveled between 310 and 340 feet. On those batted balls, hitters have a .157 average with only 19 home runs. Five of those home runs 0ccurred at Minute Maid Park. That’s over 25%! Check out this home run by Eddie Rosario as an example:
Now here’s a routine fly-ball out that was only about 7 feet shorter:
Those two balls are practically identical, but the former was a home run while the latter was a harmless fly ball. It’s hard to deny that hitting the ball in the air to left field in Minute Maid Park could easily earn a hitter a few extra home runs he wouldn’t get in other parks.
Yankee Stadium
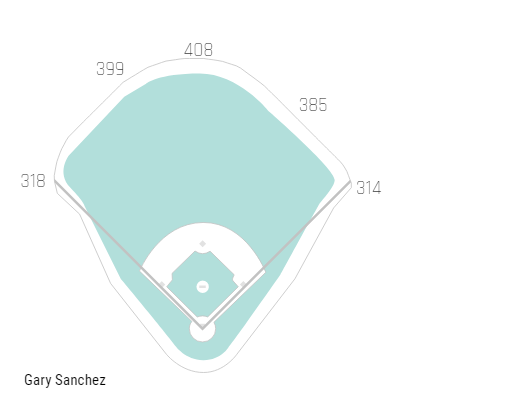
This time, we’re moving to the other side of the field. Both fences are pretty short distance-wise at the foul poles and tout only 10-foot-high fences. This essentially turns any pulled fly ball that would be an easy out in most parks into a potential home run in Yankee Stadium. This 335-foot Aaron Judge home run is a good example:
Of the 89 home runs hit so far in Yankee Stadium, 68 of them (76.4%) were hit to either left or right field. Of those home runs, 8.8% (6) of them were hit shorter than 350 feet. If you bump that threshold up to 360 feet, that number goes up to 16 home runs (23.5%). Just like Minute Maid, this seems like a recipe for stealing a few home runs throughout the season.
T-Mobile Park
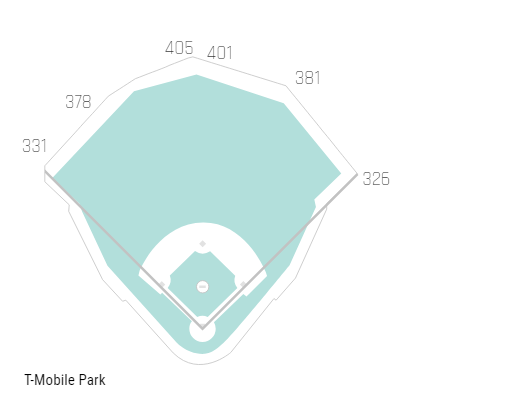
T-Mobile’s appearance on this list is something of a surprise, as at first glance there isn’t any distinguishing feature that would seemingly lend itself to a lot of freebie home runs, but my suspicions is that the right field and left field walls are still pretty short down the lines and don’t increase too drastically until you get to the power alleys. 74.1% of all the home runs hit in Seattle were to left or right field. Of the nine home runs that traveled less than 360 feet, four went less than 340 feet.
Great American Ball Park
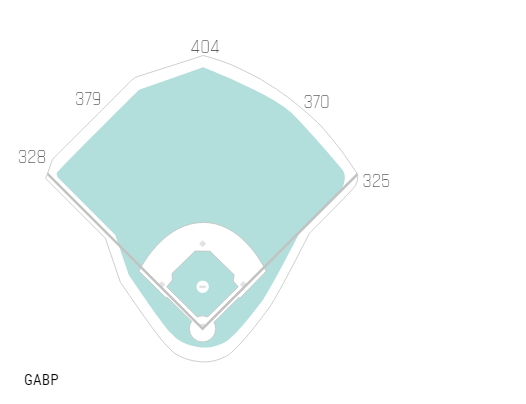
GABP is very, very similar to T-Mobile in that there isn’t anything unique about its fence line, yet it’s even smaller than T-Mobile all the way through the power alleys. There have been 15 home runs hit this season there that traveled less than 360 feet, with eight of them going less than 350 feet. Take this Jose Pereza dinger to right field:
That ball isn’t even hit down the line; it’s hit about 20 or so feet inward from the line when it eeks its way over the fence. How far did it actually go? A mere 341 feet. I think somewhere Coors Field and PNC Park are pointing and laughing.
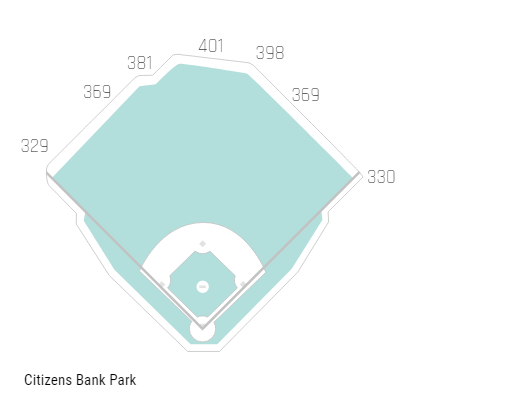
Rogers Centre and Citizens Bank Ballpark
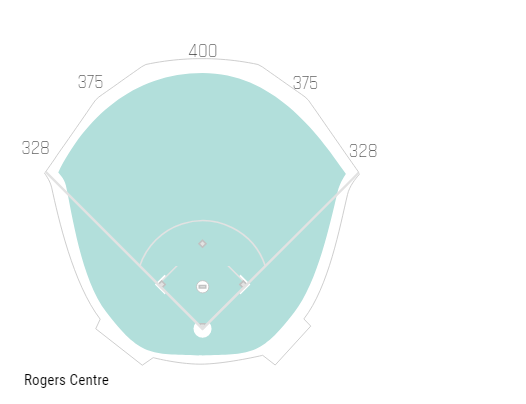
You can see the pattern emerging here. Ballparks like Coors, PNC Park, Chase Field, and Globe Life Park tend to use their enormous outfields to turn home run balls into doubles. It follows that ballparks like the Rogers Centre, the Great American Ball Park, and T-Mobile Park use to their small outfields to do the exact opposite. In this home run at Roger Centre by Eric Sogard, take a look at how far away from the line this ball was hit.
That’s what a good 75 to 100 feet off the line? It still only went 360 feet. This is exactly what I’m talking about. When the power alleys are that shallow you can end up with a lot of balls getting over the wall that would fall for doubles off the wall in other parks. Citizens Bank Ballpark falls into much the same category but also might have the most extreme case of shallow power alleys:
These sort of ballparks simply extend the range of fly balls that could turn into home runs that would normally be an out or an extra-base hit in another park. OK so now we’ve taken a look at the ballparks that provide the greatest opportunity for good fortune home runs but what about the players? Are there any players that have hit an improved number of home runs this year that may have benefited from this type of home run luck? You better believe it.
Part Two: The Players
It’s important to remember that I’m not looking to take away these home runs from these players. What I’m hoping comes from this exercise is that we are able to put their home run numbers into the proper context. This way we can get a better idea of how sustainable their home run output is, or in DFS or daily leagues, have a better idea perhaps as to when to play these players.
I feel like starting with Alex Bregman makes a lot of sense. If you remember our criteria from, we are looking for homers that went less than 375 feet, as those are the home run distances that would most likely allow park specific configurations to come into play. It is also worth noting that if you remember the data from last week, we should be finding less. Bregman is a perfect example of how a specific park can help boost your home runs, as he has hit six homers that qualify in 2019, which is tied for most in the league.
Here they are:
| Number | Distance | Spray Chart Direction | Number of Parks Where It Might Not Have Been A HR | Park It Was Hit In | Launch Angle | Exit Velocity | HR% |
| 1 | 352 | Left Center Field | 24 | Minute Maid Park | 36 | 93.0 | 12.1% |
| 2 | 360 | Left Field | 0 | Tropicana Field (Tampa) | 19 | 104.4 | 6.0% |
| 3 | 360 | Left Field | 17 | Target Field (Minnesota) | 38 | 98.3 | 11.4% |
| 4 | 362 | Left Field | 0 | T-Mobile Ballpark | 35 | 96.5 | 12.7% |
| 5 | 365 | Left Center Field | 22 | Comerica Park (Detroit) | 25 | 98.7 | 20.6% |
| 6 | 372 | Left Center Field | 20 | Comerica Park (Detroit) | 25 | 100.0 | 32.5% |
It’s important to remember that HR% doesn’t take spray-chart direction into consideration, but we like to see at least a 20.0 HR%. The flaw in HR% can be seen in homer No. 2, where once you look at the location of the home run (it was pulled right down the line) there weren’t any parks it wouldn’t have gotten out of. I mostly just use it as a quick way of evaluating the launch angle and exit velocity combination. It’s also worth noting that four of these home runs came in parks that are in the top10 of home runs that meet our qualifications. My basic rule is that if the number of parks it might not have been a home run in are over 20 and the HR% is under 20.0% or the distance is under 370 (and not hit down the line), then we should count it for our purposes as a potential non-HR.
Note there is some subjectivity here. If you want to give more weight to one variable over another or use another threshold, go for it. These are just the criteria that I find most useful. As you can see here, there is somewhere between one and three home runs that might not have been home runs in other parks. Bregman has 18 homers so far this year, and obviously, he’d still be an MVP candidate even if he only hit 15, but getting all three of these good-fortune home runs helps push him even further into the elite. It’s also worth mentioning that last year, Bregman hit 51 doubles—yet this year he has only hit 10, which would put him on pace for fewer than 30 doubles.
It certainly seems like he is trading doubles for home runs (which is awesome), and getting a few of these homers to break his way might also have a huge part in that trade-off.
Rosario is another big home run breakout who has undergone the process of trading doubles for home runs. He is on pace for about eight fewer doubles than last year and nearly double the home runs. For the most part even, the homers that fit our criteria have been no-doubters thanks to their spray-chart location. Overall, Rosario had five home runs that fit the criteria, and there are two, in particular, I want to focus on:
| Number | Distance | Spray Chart Direction | Number of Parks Where It Might Not Have Been A HR | Park It Was Hit In | Launch Angle | Exit Velocity | HR% |
| 1 | 339 | Left Field | 22 | Minute Maid Park (Houston Astros) | 30 | 96.2 | 16.7% |
| 2 | 361 | Right Field | 0 | Rogers Centre (Toronto Blue Jays) | 32 | 96.2 | 20.8% |
| 3 | 367 | Right Field | 0 | Camden Yards (Baltimore Orioles) | 32 | 100.2 | 34.9% |
| 4 | 373 | Right Center Field | 24 | Citi Field (New York Mets) | 34 | 98.9 | 10.2% |
| 5 | 374 | Left Center Field | 20 | Guaranteed Rate Field (Chicago White Sox) | 31 | 100.8 | 34.9% |
No. 1 on this list is the one I mainly wanted to point out. In fact, let’s watch it again:
That just barely gets over the wall in Houston but would have a shot at becoming an out or double in somewhere around 22 parks and only has a 16.7 HR%. This is the perfect example of a good-fortune home run. The specific dimensions of the park he happened to hit it in determined the outcome of the at-bat rather than the batted ball itself. I would likely also consider No. 4 but eliminate No. 5 based on the very high HR%.
Eugenio Suarez
With 14 home runs on the year, Eugenio Suarez is picking up right where he left off last year. He does have a few home runs (three) that meet our criteria and point to the obvious benefits of playing in a smaller stadium like the Great American Ball Park. Check it out:
| Number | Distance | Spray Chart Direction | Number of Parks Where It Might Not Have Been A HR | Park It Was Hit In | Launch Angle | Exit Velocity | HR% |
| 1 | 339 | Right Field | 20 | Great American Ball Park (Cincinnati Reds) | 34 | 94.8 | 12.2% |
| 2 | 340 | Left Field | 22 | Great American Ball Park (Cincinnati Reds) | 30 | 86.7 | 0.0% |
| 3 | 372 | Left Field | 0 | Petco Park (San Diego Padres) | 25 | 102.5 | 64.2% |
Here’s homer No. 1 so you can get an idea of how close it was:
That’s a home run that happens because of GABP for sure. How about No. 2?
Same deal. Those both barely get out in the teeny-tiny GABP. These are absolutely location/good-fortune-based homers. Now the probability that Suarez is in GABP when he hits that ball is way higher given that he plays 81 games there a year, but he was definitely fortunate to hit it in his home park. If he continues at his current rate, you’re talking about five or six home runs that are dependent on taking place at home. That could swing a season.
So, how do we use this information? I see a few important applications:
- If a player’s overperforming their expected home run total, then I might follow this process to see if his home run results are skill-based or park-based. This can help me get a feel for how much of an improvement the player is making or if it’s the random-number generator doing its thing.
- When a player changes parks, I think this could be really useful as well. If you remember from last week, I wondered if David Dahl would do better as a home run hitter in a different park because Coors has robbed him of a few home runs. Could we say the same about Suarez if he ever moved out of GABP? As we head into the beginning of trade season both in fantasy and in reality, I think this could be a great tool to have.
- It can help temper overreactions to small samples. Sometimes an evaluation like this can work as an effective means of providing a bucket of cold water to your expectations for a breakout player.
I think we so often evaluate player’s home run totals in a vacuum. The number that is there is all you need to know. I hope over the last two weeks I’ve been able to make an effective case for looking deeper at those home runs and trying to provide further context to those numbers, which allows us to make more accurate predictions and estimations about a player’s potential output for the rest of the season.
(Photo by Keith Birmingham/Zumapress/Icon Sportswire)
Good stuff. Thanks Daniel. I didn’t see your doubles article. So, forgive me if this has been addressed. The distance a ball travels is also relative to the ballpark conditions with many variances for each game. In other words, altitude, temperature, barometric pressure, wind strength and direction, etc.. So, while applying the distance of a ball hit to other parks’ dimensions may be accurate a considerable amount of the time, in many instances it won’t – right (especially in Coors)? Thanks.