


Part one of this series unpacked the inner workings of the infield shift, exploring fielder positioning, general batted ball tendencies of hitters, and the shift’s ability to prevent hits across the diamond. Part two will build upon that foundation and bring the analysis to a micro level, dissecting how specific hitters are shifted and the subsequent results on their batting performance.
A Brief Refresher
The infield shift works because the average MLB hitter pulls 46% of their ground balls and hits 40% to center, leaving only 14% to the opposite field. This predictable pattern makes it advantageous for teams to shift their infielders to better defend ground balls that are hit pull side and up the middle.
However, there is a large discrepancy between the effectiveness and subsequent usage of the infield shift between left-handed and right-handed hitters. MLB teams shift lefties on 32% of all pitches, while righties are only shifted 10% of the time. Shifting a right-handed hitter requires the defense to leave a very large hole to the right side of second base, allowing batters to outperform on balls hit to center and opposite fields compared to a standard infield alignment. Consequently, the threshold of pulled ground balls needed to justify a shift is higher for a right-handed hitter, resulting in less overall right-handed shifts.
A visual representation of this phenomenon is outlined below:
https://gfycat.com/BestAllDouglasfirbarkbeetle
Yankees catcher Gary Sanchez singles on a weakly hit ground ball to right center. In a perfect world, the first baseman could slide over to cover this position, but he needs to stay close to the first base bag in order to complete the potential putout, leaving a large vacancy in the infield. When a lefty is shifted, this hole to the opposite side of second base doesn’t exist, since the third baseman is free to move to the shortstop’s normal area.
Shifts against left-handed hitters lower batting average by 46 points (.248 to .202); however, the overall figure is dependent on the ground-ball spray of the specific batter. The infield shift lowers batting average on pulled ground balls from .205 to .109 (96 points) and from .241 to .214 (27 points) on balls hit to center. Shifted ground balls to the opposite field increase in effectiveness from a .401 to .554 average. However, these type of hits account for only 12% of ground balls by those facing shifts. Shifts against right-handed hitters only reduce batting average by 19 points, with a 74-point reduction on pulled ground balls but a 20-point increase on balls hit to center.
When to Shift
Using batting average differentials between standard and shifted infield alignments, filtered separately against left-handed and right-handed hitters, is the first step in understanding when teams should shift hitters. Based on a specific hitter’s spray rates, it is possible to estimate their batting average on ground balls against both standard and shifted infields. Theoretically, so long as the shifted batting average is lower than the standard batting average, teams should shift the hitter.
However, in order to justify the managerial exertion and continued player movement required by the shift, teams likely will opt for a standard alignment if the benefit from shifting is minuscule. As a result, I’ve applied a 15-point batting average improvement on ground balls as a cutoff. Ground-ball spray combinations resulting in a batting improvement of fewer than 15 points are highlighted in red and deemed as results that indicate a “no shift” decision.
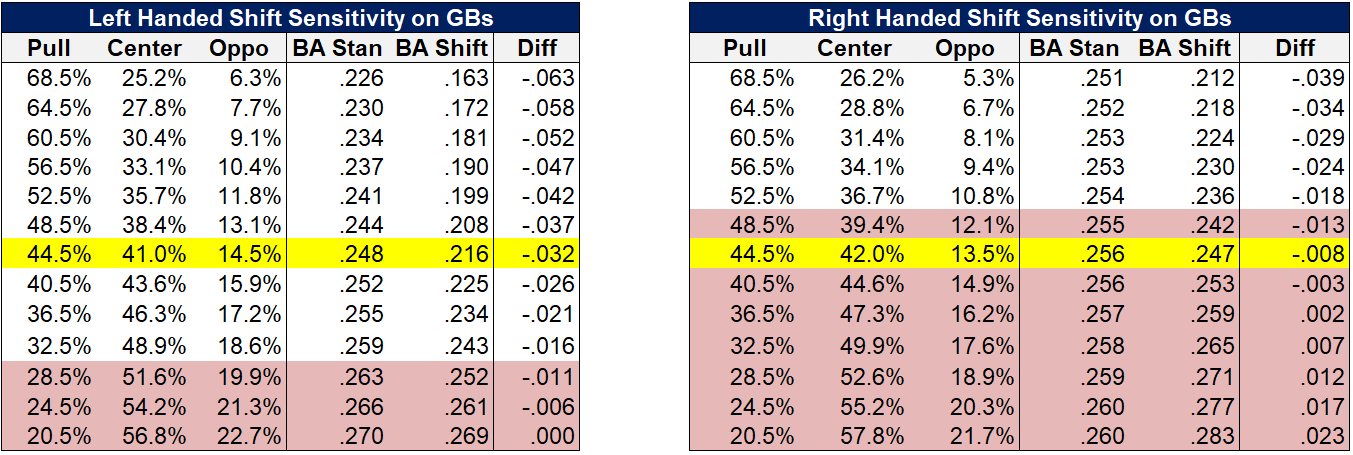
The shift cutoff for left-handed hitters is a 32.5% pull rate. This threshold translates to nearly every left-handed hitter being a candidate for the shift, as there were only two lefty hitters with ground-ball pull rates lower than that mark in 2018 (Red Sox 3B Rafael Devers and former Tampa OF Mallex Smith). This indicates that we are only in the proverbial fourth or fifth inning of shifting on left-handed batters and that the 32% lefty shift rate will climb significantly over the coming years.
Since shifting a right-handed hitter produces inferior batting average outcomes compared to a left-handed hitter, the decision threshold for shifting is much higher at a 52.5% pull rate. Considering that 30% of right-handed hitters pull ground balls above this rate, it is reasonable to expect increases in righty shifting going forward as well. However, given the structural limitations to shifting righties, the absolute growth will be more muted.
Note that this analysis is based on the average major league hitter. Certain hitters might have higher or lower exit velocities on ground balls, which can cause variations to these averages. Hitter speed is also an important factor that this analysis ignores, as faster players will obviously find it easier to earn base hits on a variety of ground ball types. Accordingly, these thresholds might not generically apply to every player.
Who’s Getting Shifted?
It turns out that MLB teams aren’t stupid. The correlation coefficient between pulled ground-ball rates and shift rates for left-handed hitters was 67% and 51% for righties in 2018.
The tables below display the 10 most shifted hitters among both lefties and righties in 2018, along with two different pulled ground-ball rates. The first column shows the pull rate on ground balls, while the second shows the percentage of pulled grounders in relation to all of the player’s batted balls. Understanding the difference between these two figures is key.
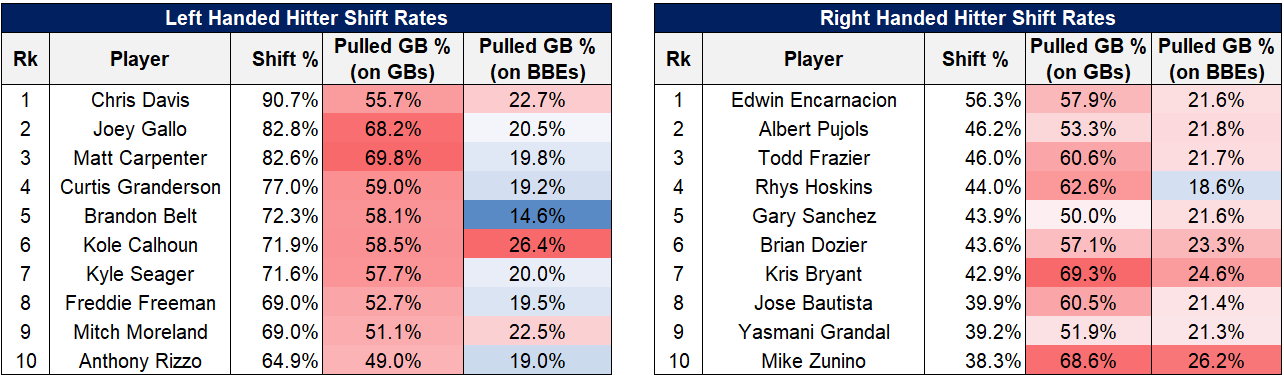
Teams primarily base their decision to shift a hitter on their pull rate on ground balls (Pulled GB / Total GB). However, a batter’s ratio of pulled ground balls to total batted balls (Pulled GB/Total BBE) is also very important since this figure multiplies the impact of the shift. For instance, San Francisco 1B Brandon Belt pulled 58.1% of his ground balls in 2018 and was thus shifted 72.3% of the time. However, since only 25.0% of Belt’s batted balls were on the ground, his pull ground-ball rate as a percentage of all batted balls was a mere 14.6%. Thus, the shift will penalize Belt severely on the ground balls he hits; however, the overall impact to his batting line is softened since he hits so few balls on the ground generally.
Meanwhile, a player like Los Angeles Angels OF Kole Calhoun is punished significantly more by the shift. Over 45% of Calhoun’s batted balls were grounders last year, giving Calhoun a lefty MLB high Pulled GB/BBE ratio of 26.4%. Calhoun’s 2018 batting average of .208 trailed his expected batting average of .253 by a staggering 45 points. Unfortunately for Calhoun, some of this differential can be chalked up the shift, and there will be a structural ceiling on his production so long as he continues to hit so many pulled ground balls.

The top right-handed shifted batter was former Cleveland DH Edwin Encarnacion by a substantial amount, with a 56.3% shift rate compared to second place Albert Pujols at 46.2%. The ground-ball pull rates of right-handed hitters were higher than lefties, which is consistent with righties demanding a higher threshold of pulled grounders in order to justify a shift. Fortunately, many of these hitters are unlikely to face shift rates in the 70-80% range that the top lefties are facing. However, hitters like Cubs 3B Kris Bryant and Rays C Mike Zunino, who are in the 95th+ percentile of pulled ground balls, will probably experience increased shifting in the future.
Translating the Impact
While infield shifting is still in its relative infancy, certain players, such as Rangers OF/1B Joey Gallo and Cardinals 1B/3B Matt Carpenter are already close to experiencing “max shift”. Both players were shifted on over 82% of their plate appearances in 2018, a level that serves as close to full shift capacity when considering the impact of base runners.
Against lefties, teams are incentivized to shift with no runners on (64% of PAs) and with a runner on first (13% of PAs), however, shift rates plummet when there is a runner on second base or multiple runners on base (23% of remaining PAs). As a result, it is inherently difficult for a player to be shifted more than 90% of the time.
With that in mind, just how much is the shift negatively affecting players like Gallo? Parsing out Gallo’s ground-ball hit frequency in 2018, and adjusting it for a hypothetical scenario that he faced no shifts, should present a reliable answer to this question.
(As a reminder, the adjustment factors for lefties on batting average against the shift are as follows: pulled GBs at -.094, center at -.027 and opposite field at +.153. The adjustments for righties are pulled GBs at -.074, center at +.020 and oppo at +.121.)
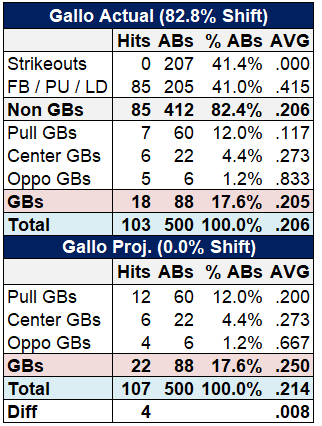
Gallo swatted 103 hits in 500 at-bats in 2018, resulting in a .206 batting average. 82.4% of Gallos’ at-bats ended in either a strikeout, fly ball, pop up or line drive, leaving room for only 88 ground balls (17.6%). Gallo pulled 60 of those ground balls and performed poorly on them, only garnering seven hits for a .117 average.
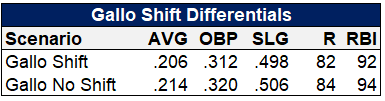
However, assuming Gallo was never shifted, his projected hits on pulled ground balls would increase from seven to 12. Additionally, he’d likely lose one opposite field hit, resulting in a net gain of four hits in a non-shifted environment. This would increase his overall average from .206 to .214, and likely result in two more runs and RBIs respectively.
Those differentials are significant but perhaps less stark than the consensus would expect. Gallo would likely argue that the shift robs him of more than four hits per season. After reviewing his pulled ground-ball spray from 2018, he might have a case:
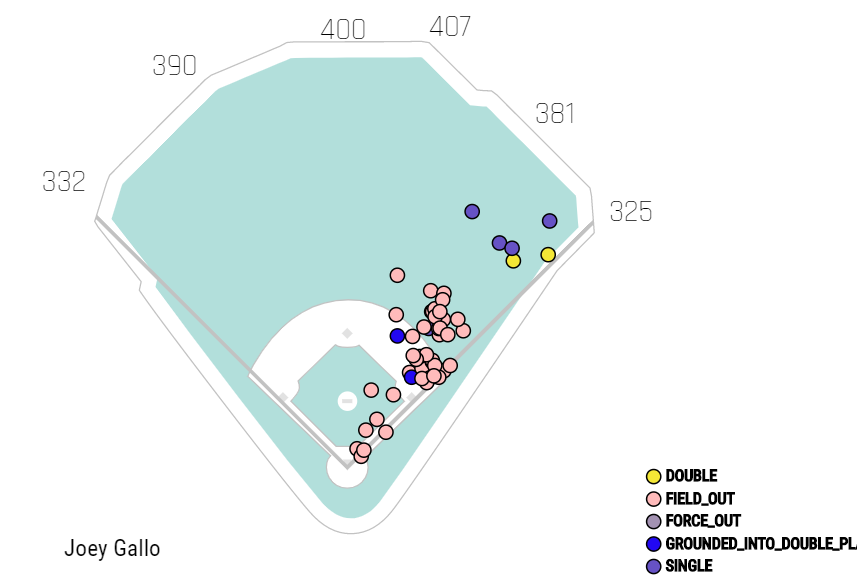
There are approximately 15 ground balls fielded in the shallow outfield by a shifted second baseman. However, it’s unlikely that all of those balls would have resulted in hits against standard infield alignments. A decent second baseman could have fielded some of them from his standard infield position.
The top 10 most pull-heavy hitters last season went 54 for 271 (.199 average) on pulled ground balls against standard alignments compared to .205 for the MLB at large. This indicates that the baseline adjustments being used for the average MLB hitter are actually fairly applicable to outlier players like Gallo. Moreover, Gallo’s projected batting average on ground balls against standard alignments of .250 is slightly above the MLB average, which is probably fair for a player with average to below average speed.
Despite hitting nearly 70% of all his ground balls to the pull side, pulled ground balls only accounted for 12% of Gallo’s at-bat results, tempering the overall impact of the shift. Ironically, Gallo’s strikeout problem is one of the reasons that the shift affects him less, however, I’m sure Gallo would trade some strikeouts for some more pulled ground balls in the future.
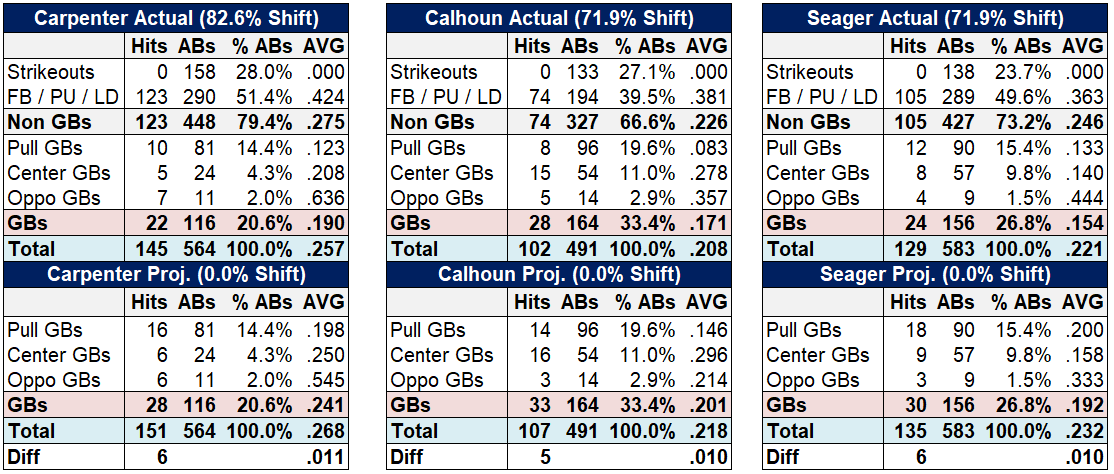
Carpenter, Calhoun, and Kyle Seager are slightly more impacted by the shift because the predominance of pulled ground balls in relation to at-bats is higher, ranging from 14.4% to 19.6%. Each player should expect a batting average 10 points higher in a non-shift environment, and another three runs and RBIs respectively. However, note that Calhoun and Seager were only shifted on 72% of pitches in 2018, highlighting that there is room for teams to shift these players more going forward. If both players experience shifting closer to a high-80% range, their batting average would decline by closer to 13 points, which is nearing the maximum that the shift can reasonably affect a player’s batting average.
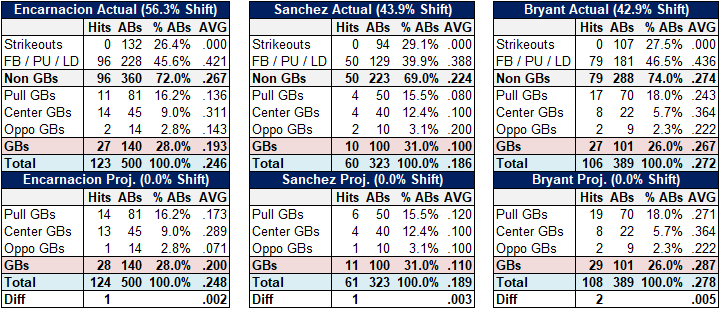
Predictably, the top-right handed shifted hitters are affected significantly less by the shift. Not only are the shift adjusted batting averages more advantageous for the hitter, but the shift frequency is lower, amounting to dramatically reduced batting average distortion. Encarnacion, Sanchez, and Bryant would have been expected to have only one to two more hits in a shiftless MLB.
Who’s at Risk?
While players like Calhoun and Seager are still subject to increased marginal shifting, the negative impact from the strategy is largely baked into their performance at this point. Yet there are a handful of players that seem to be heavily under-shifted given their propensity to hit pulled ground balls. A hand-picked selection of lefties fitting these criteria is outlined in the table below:
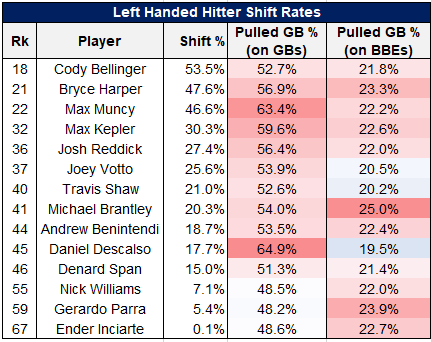
Hitters like Dodgers 1B/OF Cody Bellinger, free agent OF Bryce Harper, and Dodgers 1B/2B Max Muncy are great candidates for shifting given their ground-ball pull rates. Consequently, teams are already shifting them in the 45% to 55% range, however, it’s likely that these players will be shifted more in the future.
The more interesting group comes with names like Twins OF Max Kepler, Astros OF Josh Reddick, Brewers 2B/3B Travis Shaw and Astros OF Michael Brantley. These players exhibit a profile that should heavily favor shifting, however in 2018 they were only shifted in the 20 to 30% range.

Brantley exhibits the most potential batting average downside from shifting, with a potential decline of over 10 points if teams begin to shift him at a 75% rate. Houston teammate Josh Reddick is in a similar boat, with a potential nine-point batting average decline under similar circumstances.
It could be argued that teams hold off from shifting Brantley, or a player like Reds 1B Joey Votto, because they are known as strong contact hitters potentially capable of adapting their hitting approach to take advantage of the weak points in a shifted infield. To their credit, both Brantley and Votto posted better ground ball batting averages against the shift compared to standard alignments in 2018. However, while Brantley’s pull rate went down slightly while facing a shift in 2018, Votto actually hit more pulled grounders into the shift compared to a standard alignment. In the end, most players tend to exhibit a fairly similar spray chart facing both standard and shifted infield positions, demonstrating that it’s difficult to suddenly re-imagine one’s approach at the plate just because the second baseman is in a different position.
Hitters like Kepler and Shaw, along with most of the others in the table, are in danger of ceding another seven to eight points on their average if they’re shifted more. An interesting name is Atlanta OF Ender Inciarte, who was never shifted in 2018 despite posting slightly above average ground-ball pull rates and a high propensity to hit grounders in general. Perhaps teams are hesitant to shift a speedy and crafty player like Inciarte because he could reach first by sneaking a bunt down a vacant third base line. While that’s a possibility, Inciarte’s ground-ball spray chart is heavily indicative of a player that would cede base hits to shifting. Fast and bunt-heavy payers like Inciarte, or Free Agent OF Denard Span, will likely never be shifted a majority of the time, however, teams will probably become wise to the low-hanging fruit offered by shifting them more incrementally.
Concluding Thoughts
This two-part series has spilled nearly 6,000 words regarding the infield shift. Hopefully, you stuck it out to the end!
I believe the key takeaways are the following: 1) the shift is a natural reaction to the predictable pull-heavy nature of ground balls among all hitters, not just ones on extreme ends of the spectrum, 2) the shift is very effective at reducing batting average on ground balls when deployed correctly, 3) however, key differences between handedness exist, causing right-handed shifting to be less prominent and effective, 4) shifting will continue to increase, especially against left-handed hitters, 5) the shift has a noted impact on player batting lines, reducing batting averages by 15 to 20 points on the high end of the spectrum, but more realistically five to 10.
From a fantasy perspective, enterprising managers should prioritize their analysis to left-handed hitters, making a mental note that the Gallo’s, Carpenter’s and Muncy’s of the world will tend to underperform their expected statistics because of the shift. In addition, managers should maintain a watchful eye on hitters like Brantley and Reddick, who seem poised to face increased shifting in the future. Moreover, when players are called up from the minors it should become the normal course of duty to dig into ground-ball pull rates to potentially understand the likelihood of shifting in the future.
One additional point that is consistently brought up about the shift is that names like Gallo and Carpenter should try to bunt for a base hit or alter their approach to slap the baseball to the opposite field. Based on all of the available evidence, I believe this suggestion is extremely misguided. Power hitters who hit a lot of fly balls, which represents a disproportionate amount of who’s shifted, will likely do more harm than good to their overall batting line if they start changing their swing to counteract a 10-point decline on their batting average. There are potential arguments to be made for more ground-ball-centric players like Calhoun or Granderson to adapt, however, for hitting more fly balls is likely a better remedy than trying to influence more grounders to the opposite field.
(Photo by Frank Jansky/Icon Sportswire)
(All data extracted from Baseball Savant)
There are many varieties of over-shifts which is what you are analyzing. I really don’t think it should be called a shift as those have been around since forever and they have always been deployed to the pull side of any hitter. Some over-shifts are absurd and some not. Sometimes guys switch positions on the infield, sometimes not. There are really a million different varieties of over-shifts, and calling them shifts really makes for problematic analysis and discussion. I think to really get anywhere you need to pull apart the various iterations of over-shifts and analyze their efficacy. When I watch baseball and I see a ball hit into an over-shift I wonder if a normal alignment would have resulted in the same out – I think 90% of the time it would have. Hitting ground balls to your pull side has always been a bad idea and I don’t know how much the shift adds to that. You don’t have to move a 3rd player across the infield to get out a pull hitter who rolls over on a GB. I pitched a bit and I figured I “won” every time a player pulled a ground ball. They don’t always find gloves but it is the best thing I could induce.
The shift that works the best is right in between an over-shift and a traditional shift, where the 3rd guy is right up the middle. You end up with four players on the dirt and nobody is way out of position and it is pretty effective. I saw more of that in 2018 than I have ever seen before and I think teams are slowly reaching the conclusion that the traditional over-shift doesn’t work too well for most hitters. I would wager that the man up the middle becomes the shift that teams most often deploy. It is problematic to think that based on an imaginary line through second base and the players’ position relative to that line it is a shift of not – they are both shifted alignments that vary by a foot either way depending on the SS. Admittedly I didn’t have the time to read either article thoroughly, and you may have covered all of this, but it didn’t look like it to me.
Over-shifts lead to more errors and XBH – that is a problem with using AVG or BABIP. I don’t have time for any more, but I could offer up suggestions for hours – people generally don’t want to hear it lol.Thanks for the article.
Thanks for your comment! You present some very insightful arguments.
One of the limitations of this analysis is that it grouped all types of shifts, or “over shifts” as you described, together. It also grouped all types of hitters together. Getting more granular on both accounts would certainly improve our confidence in the results, however, you would probably run into sample size issues. In the end, I think the findings presented are fairly accurate and applicable to most hitters.
I would disagree that teams are shying away from the over shift. The incidence of this shifting has nearly doubled since 2015 and went up by a relative 45% in 2018 alone. This shifting is also very effective against lefties, reducing the batting average on pulled balls by almost 100 points and also reducing the batting average on balls hit to center. This type of shifting can be problematic against righties though because of the hole it leaves to right center.