


That’s enough of this All-Star break business; it’s back to baseball for the second half. For those of you following the daily CSW posts on Twitter, we are finally going to be adding CSW+ going forward! If you aren’t familiar with CSW or CSW+, here’s a quick recap:
- On April 16, Alex Fast released an excellent article on a new metric called CSW.
- Then, on May 29, I released an article to introduce CSW+, a complementary statistic to CSW that was designed to be team- and league-adjusted.
If this is your first exposure to CSW or CSW+, it might be worthwhile to go back to those other articles and give them a quick read (Alex’s article is a must read).
CSW & CSW+ Recap
The formula for CSW is very simple:
Called Strikes + Whiffs
Total Pitches
It takes into account called strikes, swinging strikes (including blocked ones), swinging pitchouts, and foul tips into the glove, while excluding foul balls, then dividing by the total pitches thrown in an outing. One of the most interesting aspects of CSW is that it correlates with SIERA better than other commonly used metrics such as called strikes, whiffs, and swinging strikes.
Here is the formula for CSW+ from my original article in May. A description of the formula inputs is available in my previous article (link above):
CSW+: Why The Update?
The good news is that the formula doesn’t need to change, but we are going to give it a tweak. In the original version, the team factor was simply calculated as a team’s collective (batting) CSW href=”https://pitcherlist.com/Glossary” rel=”nofollow”>CSW divided by the league CSW href=”https://pitcherlist.com/Glossary” rel=”nofollow”>CSW, which was intended to represent the quality of the offense a pitcher was facing in any particular game. However, a comment left by Greg Burda highlighted that the team factor probably didn’t actually represent the true opponent quality that a pitcher would face, and this got the wheels in motion to improve CSW+. I’ve added his comment below:
“… It’s entirely possible to enhance the stat with the CSW rate for each player in a given lineup, not the Team avg CSW. For example, in Giolito’s performance vs. the Astros I believe Springer and Correa did not play (or something like that). If a pitcher’s individual performance is to be praised the actual lineup construction he faced should be accounted for.”
And he was absolutely right, CSW+ should consider lineup construction, not merely a team’s average CSW. So almost immediately, I set off trying to figure out a way to include lineup construction in the CSW+ framework.
Updating the Team Factor
Step 1 in updating the team factor was calculating each hitter’s CSW. So a few keystrokes *beep* *boop* *beep*, let the computer do the work and presto!
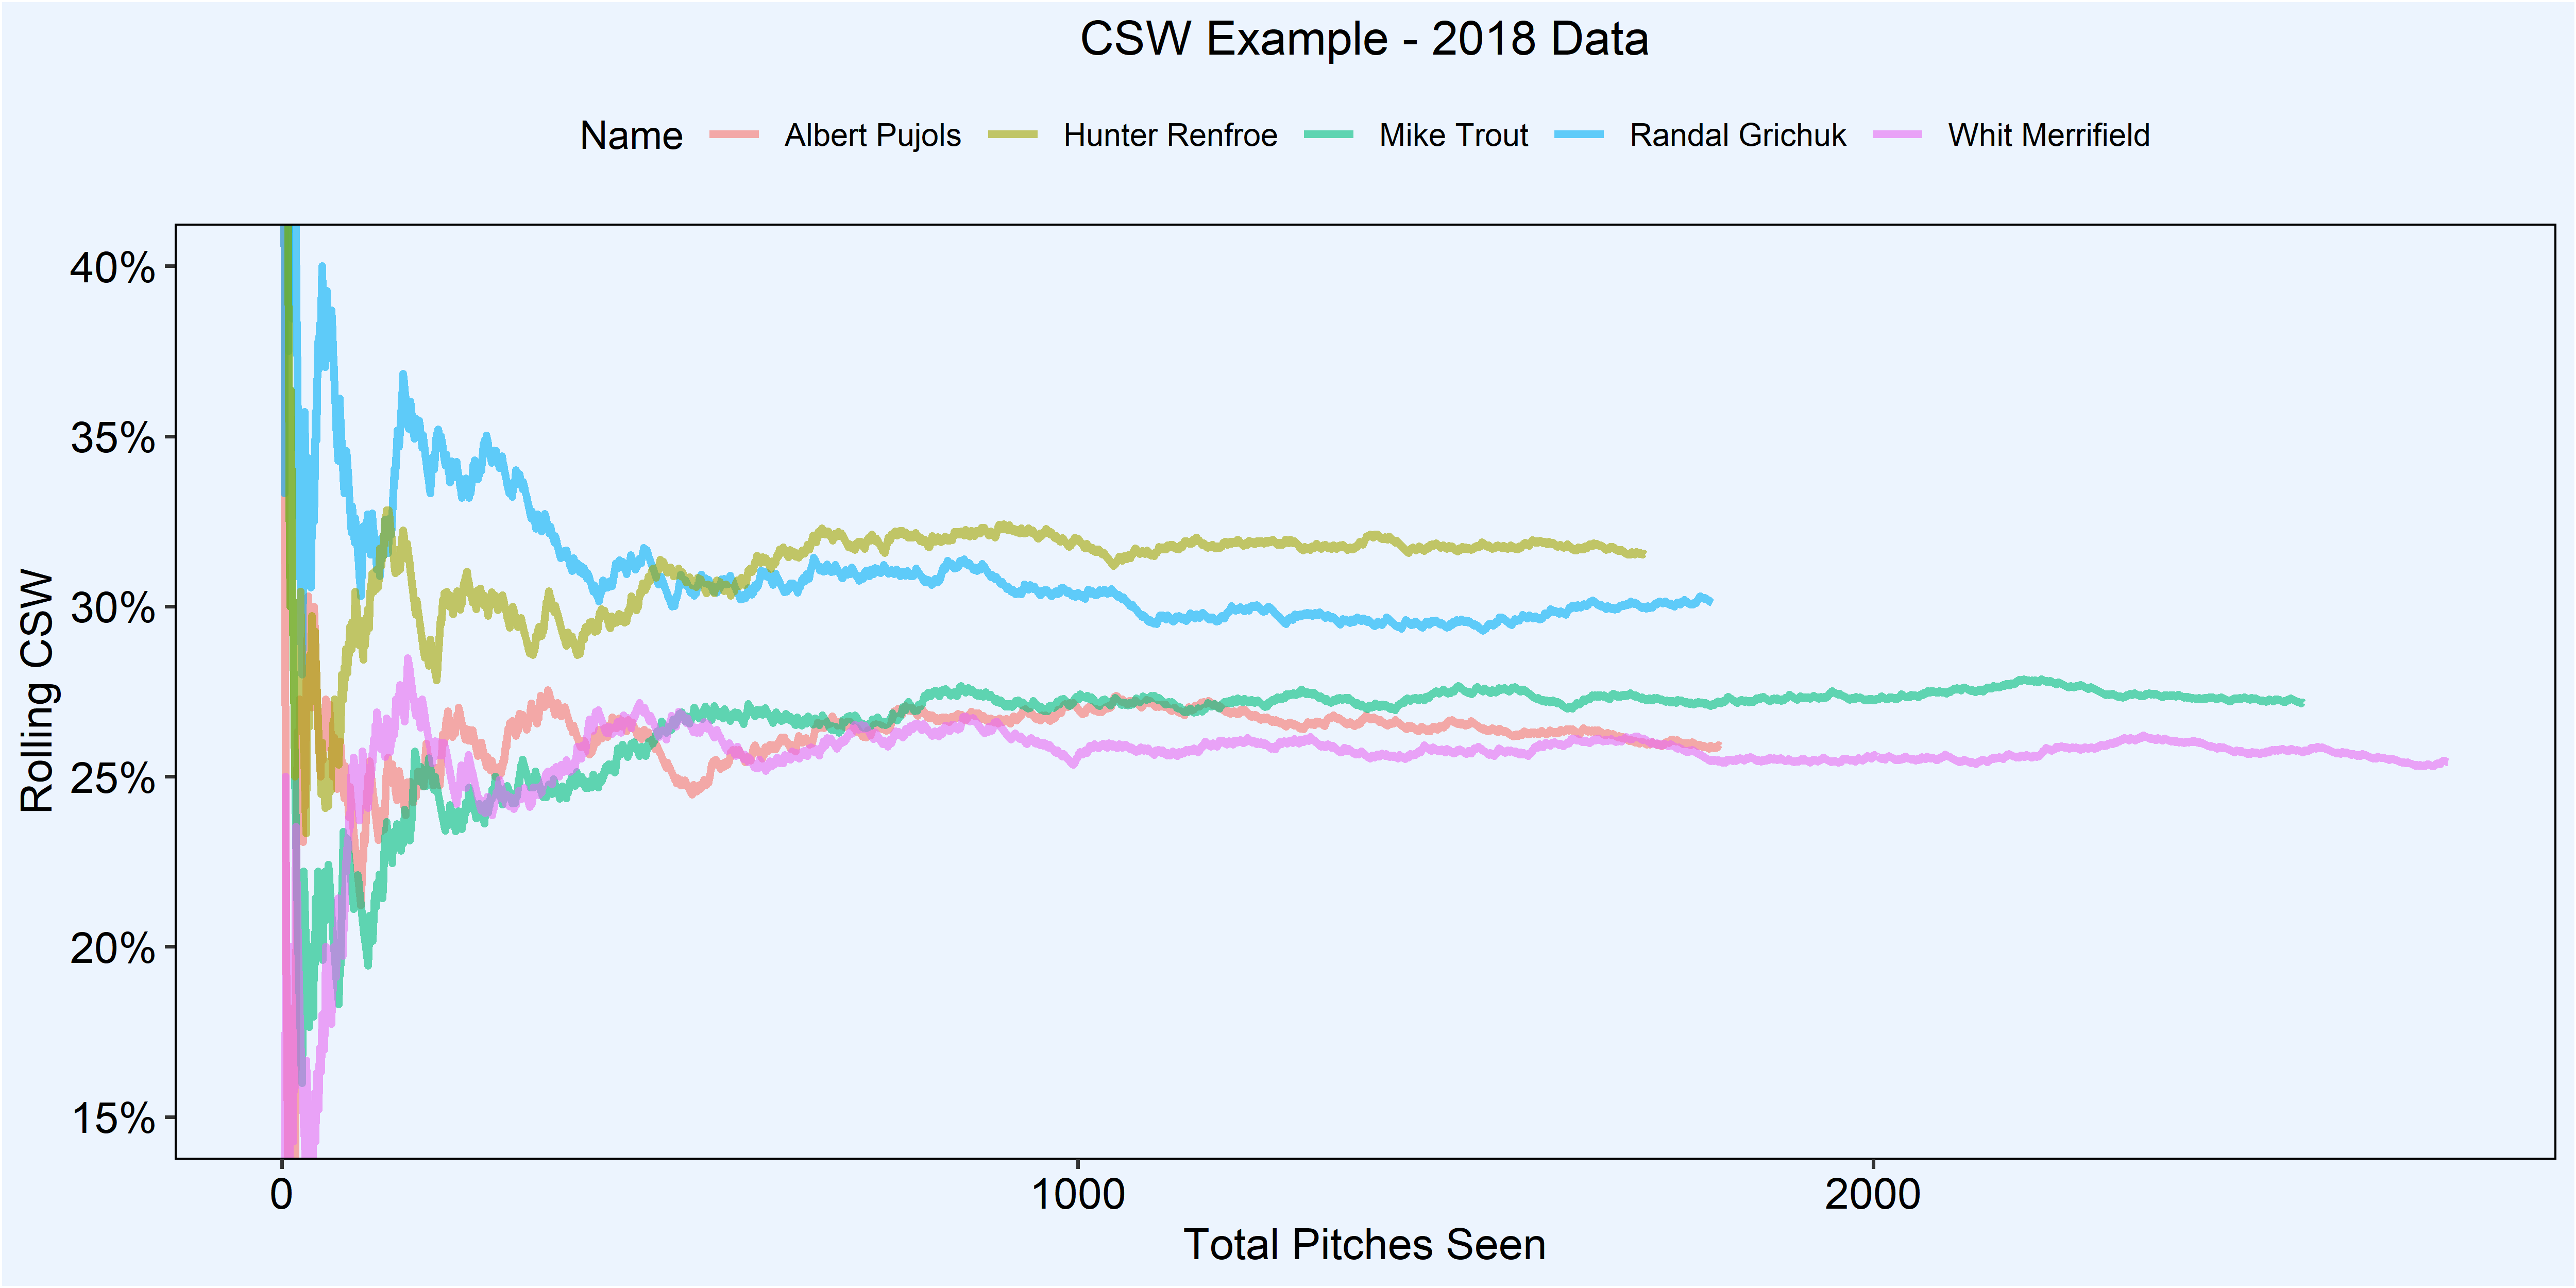
Calculating the CSW was the easy part. In my opinion, the most important part of this whole process was deciding on when it becomes trustworthy (or stabe). To examine this, I went back to the 2018 data and calculated the cumulative CSWs for each batter who had seen more than 200 pitches (~50 plate appearances), but I really just chose that number to remove players who barely played. Instead of showing you a plot for every batter from last season, I randomly chose five players and plotted their cumulative CSW to help you all visualize what I did.
So first up are the cumulative CSW by pitches seen for my small subset of players. You can see that there is a lot of noise in the early part of the season, and the lines begin to stabilize as the number of pitches increases. Again just to reiterate, this is just for visual purposes only, just to give you an idea of what the data looks like. Even with this small subset of players, the true talent level does become apparent with enough pitches.
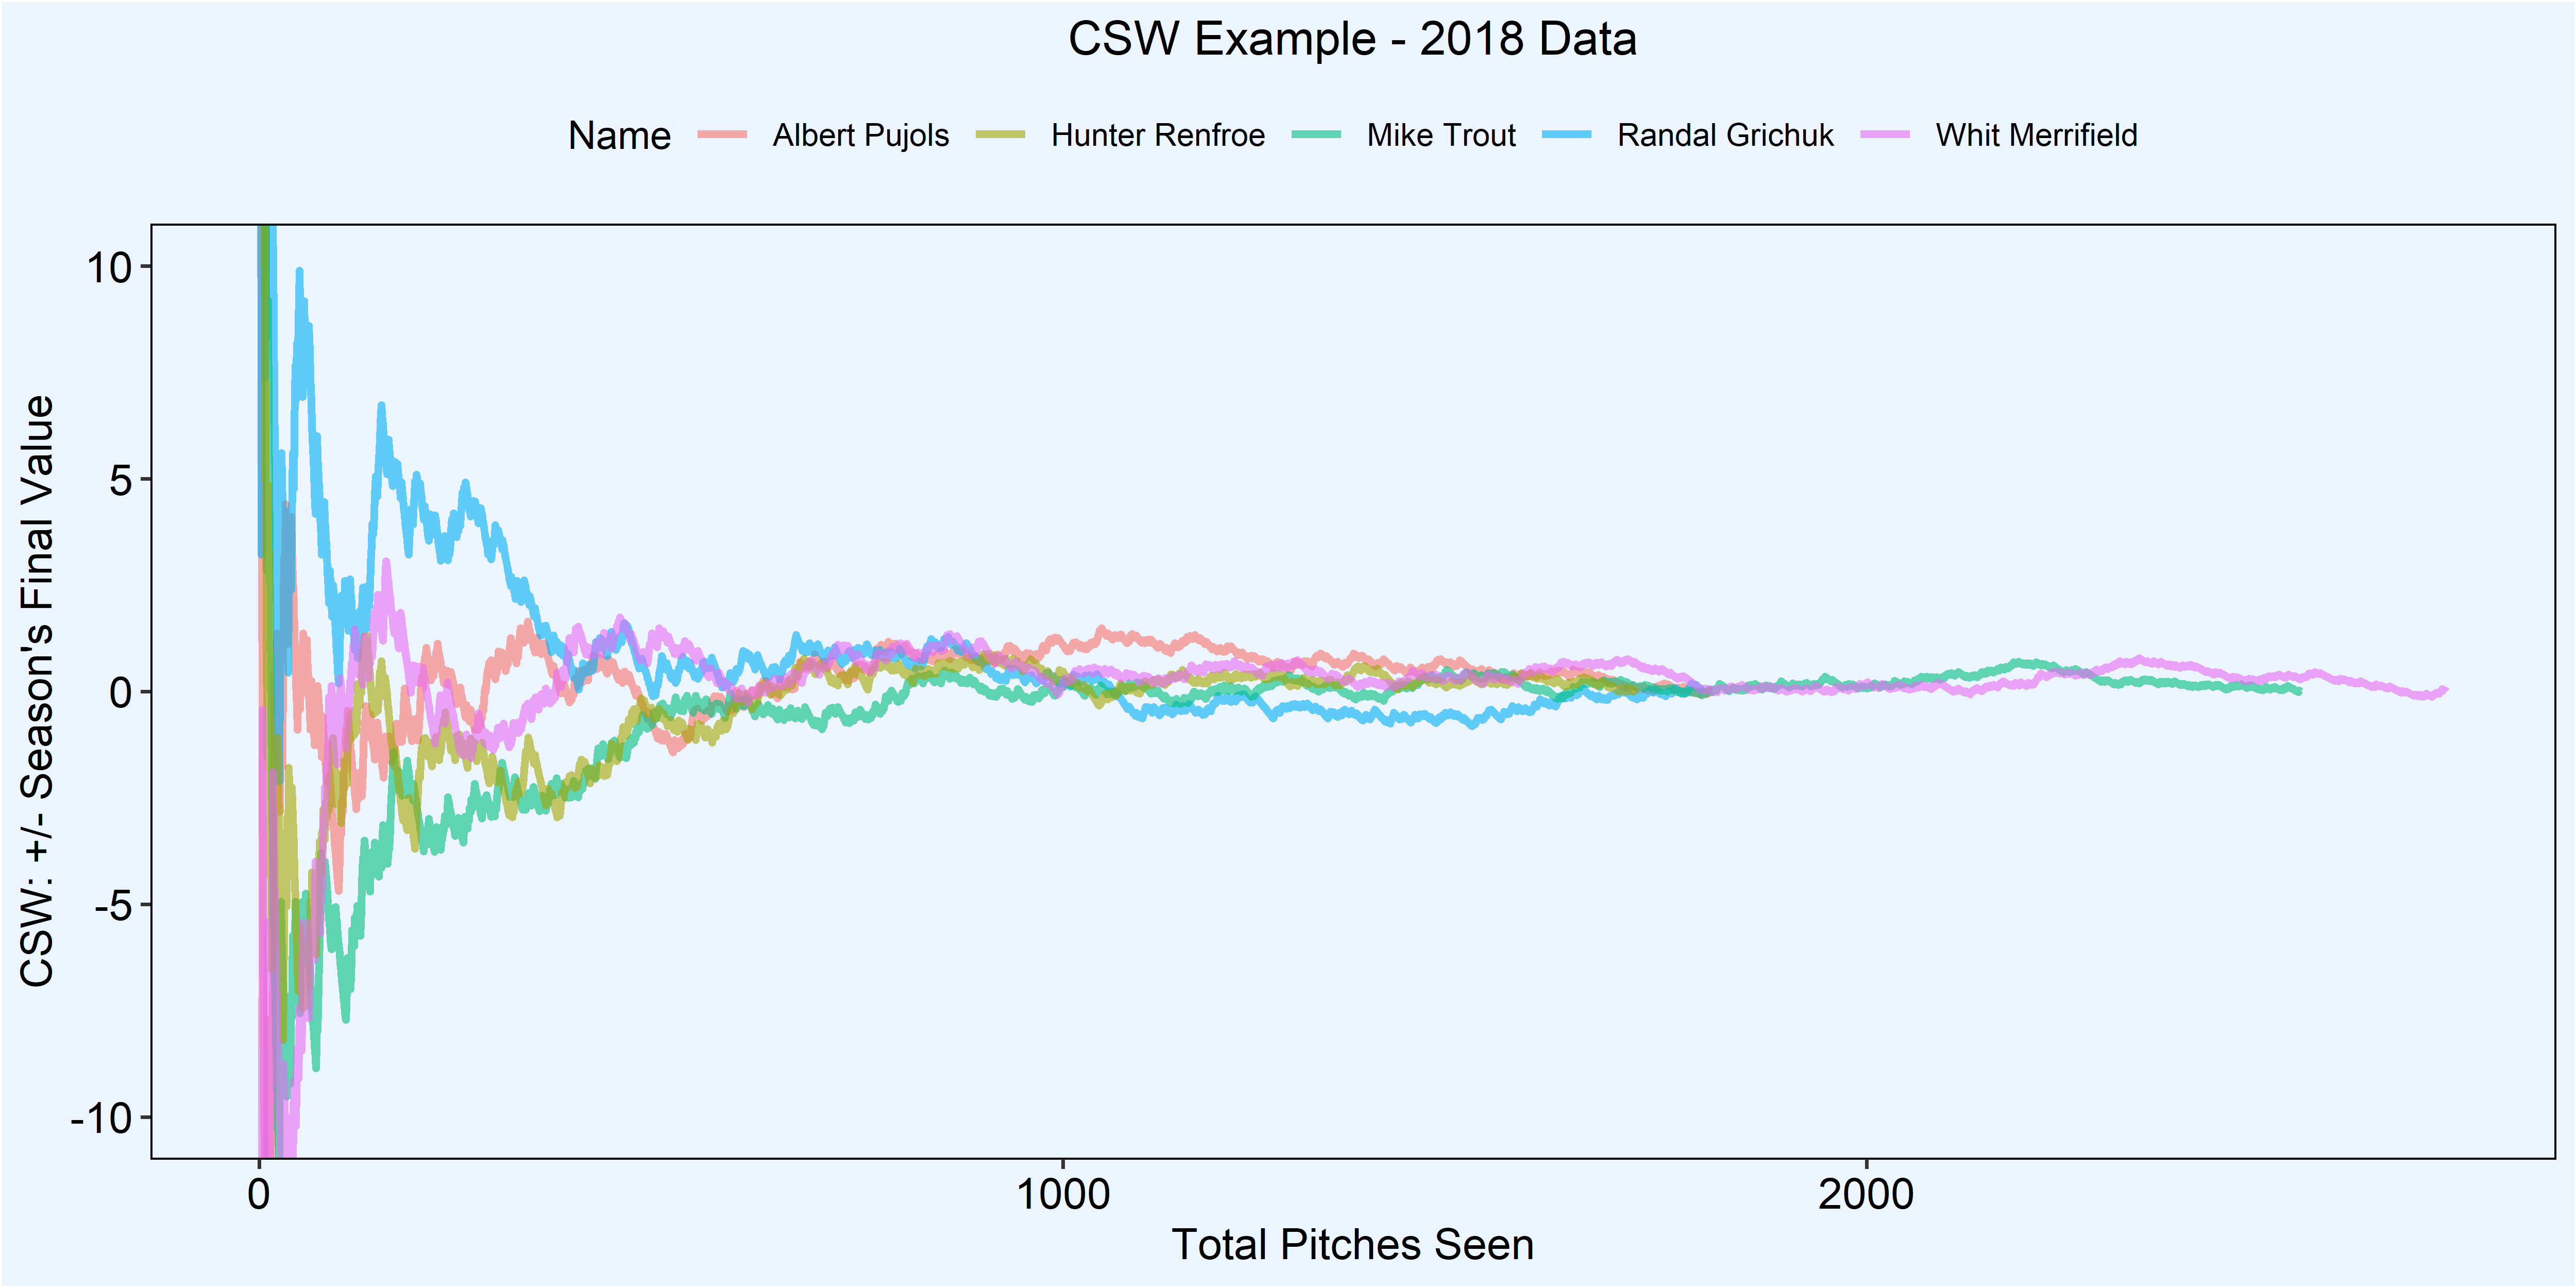
Because players should eventually stabilize to their true talent level, we really need to standardize the data to get it in the same scale. To standardize the data, I took each player’s final CSW value and calculated the difference for each pitch they saw during the season. This put all the players on the same scale, as the final point for each player will be exactly zero.
OK, now we can ignore the subset of players from the previous plots. This next section contains data from all the batters who saw more than 200 pitches from the 2018 season, which comes to a sample of 535 batters.
Now that the players are all on the same scale, I was able to explore the stabilization point for batter CSW. To do this, I calculated the mean difference from their final CSW per pitch seen (black line) and the 95% confidence intervals (red lines). I put a dashed line at zero to make it easier to track where zero is along the plot. The key here is that when the dashed line is within the 95% confidence intervals (red lines), it is not statistically different from zero.
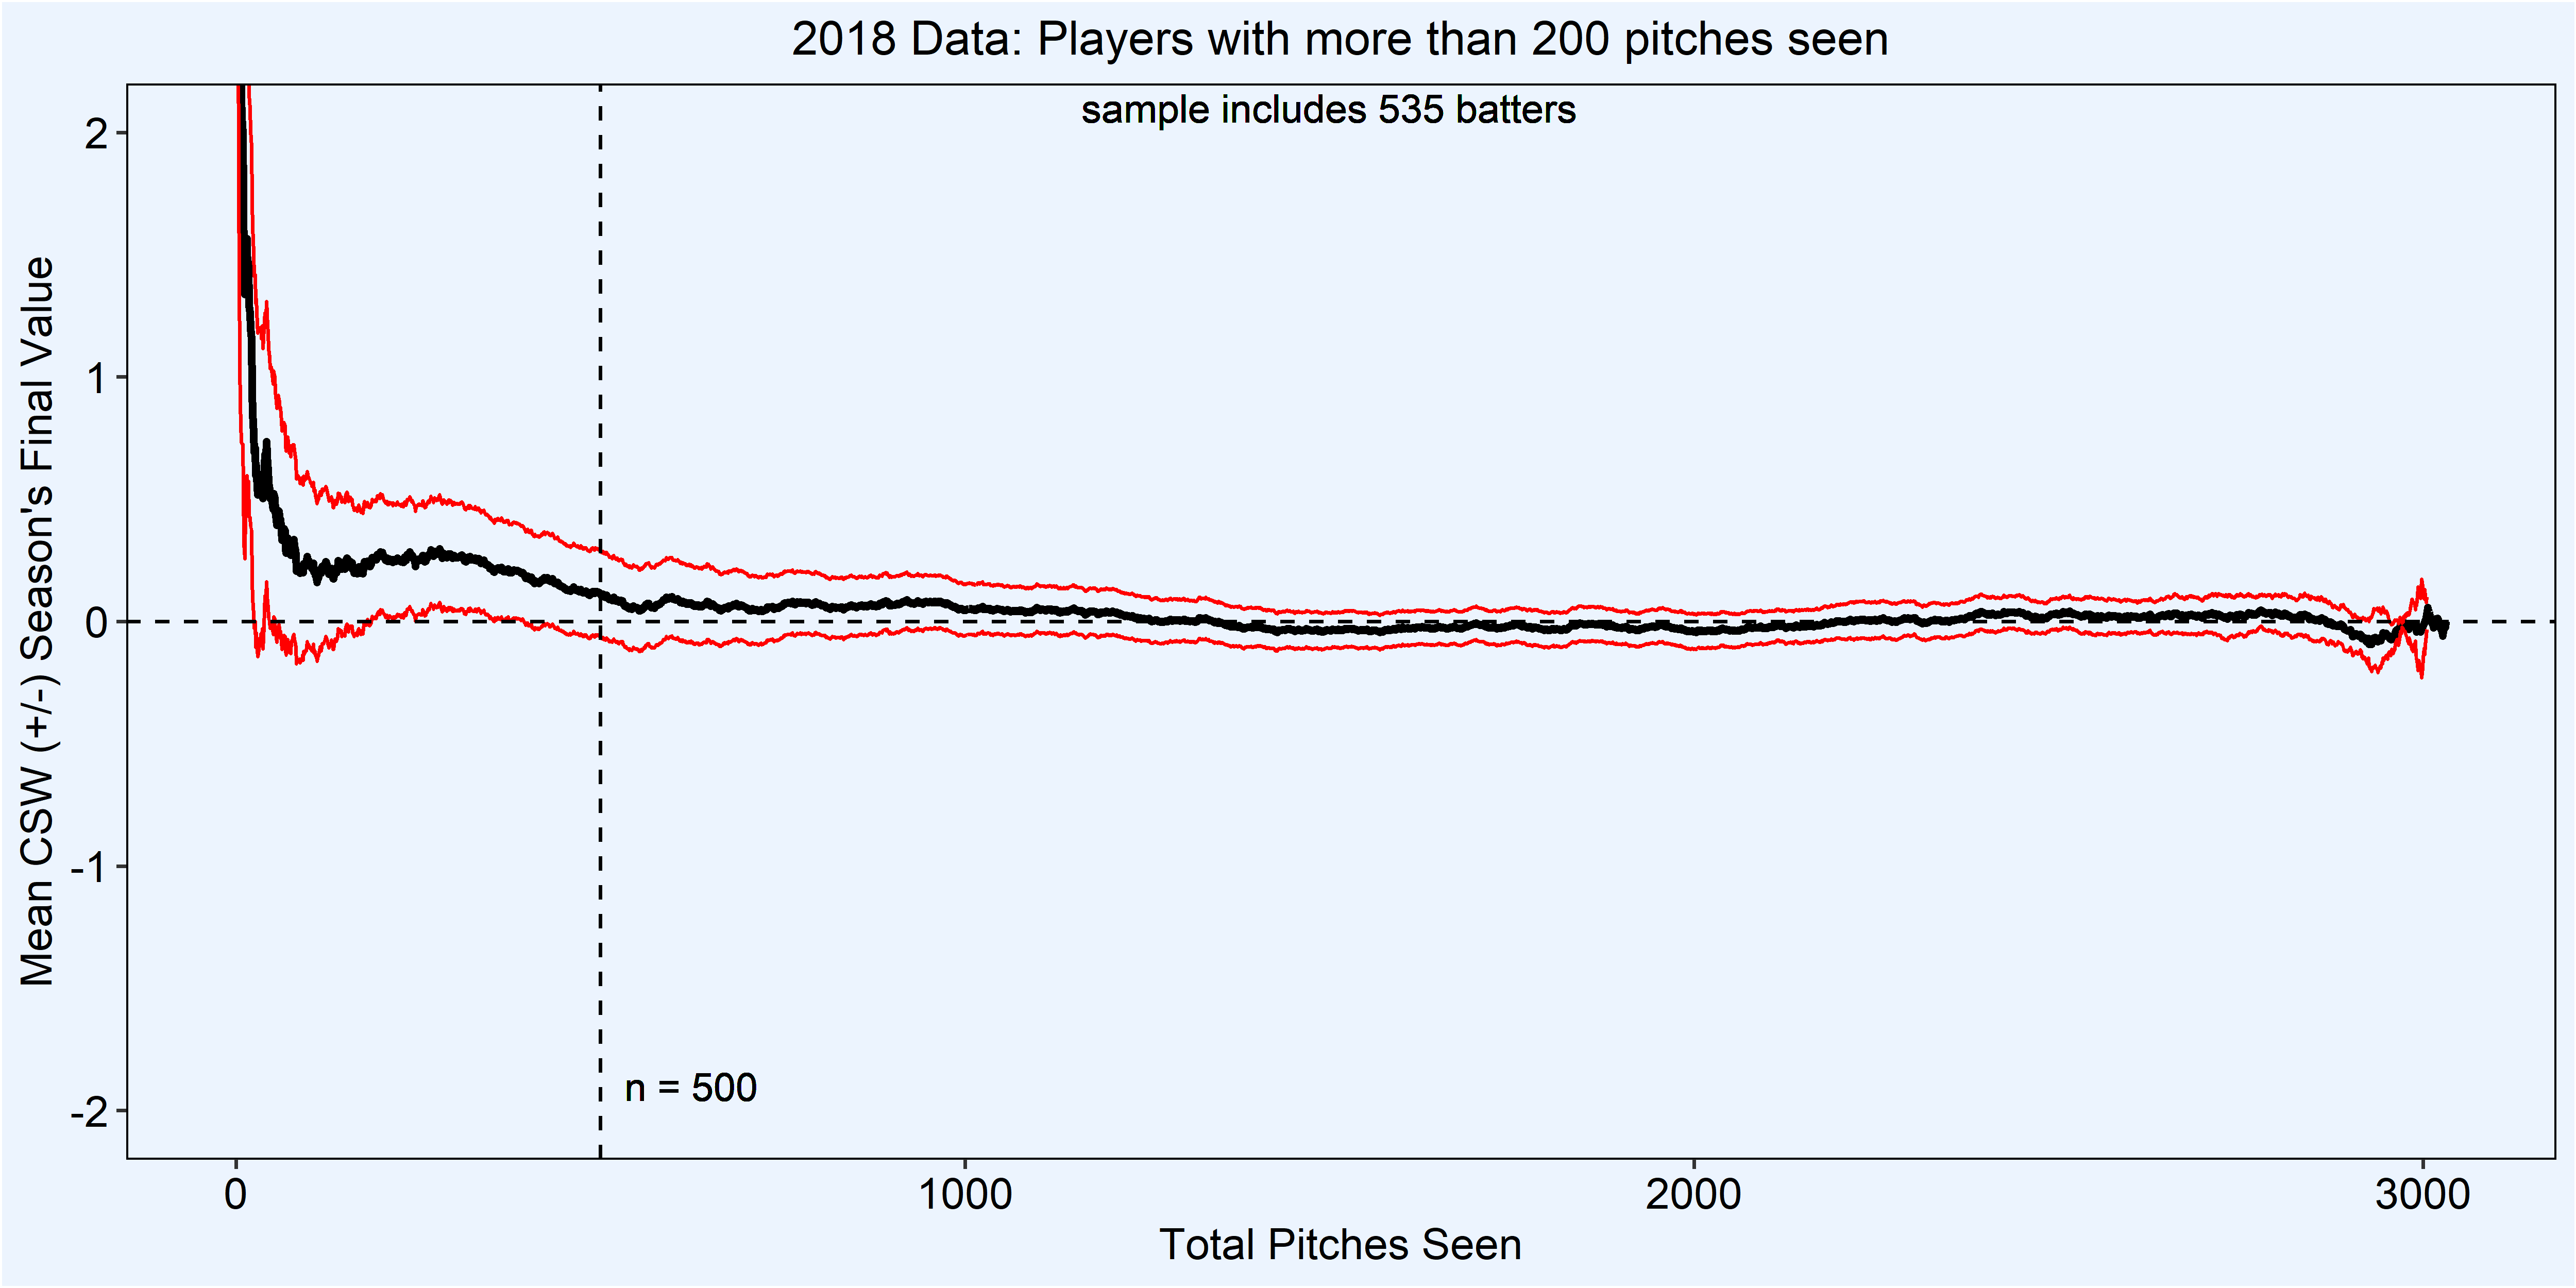
You’ll notice that the dashed zero line is within the 95% confidence intervals with few pitches (~100), but it doesn’t last long as there is still some noise in the data. After about 450 pitches, the confidence intervals encapsulate our zero line, suggesting we have reached stabilization. Just to give it a cushion, I decided to set the stabilization to the nice round number of 500, which is the vertical dashed line. Now that we’ve got our stabilization point, we have something to weigh our early season observations back to expectations going forward.
Implementing the Ballast
I am borrowing the term ballast directly from Tango Tiger’s blog, which he got from Bill James. It is synonymous with regression toward the mean, but ballast just sounds better.
As we saw from the previous section, the stabilization point for batter CSW is approximately 500 pitches.
This formula is used only if a player has seen fewer than 500 pitches:
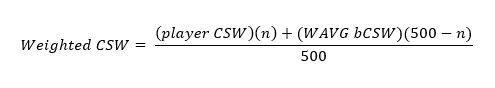
Where the player CSW is an individual player’s (batting) CSW, n is the number of pitches seen, the WAVG bCSW is the weighted average of all MLB players during the current season and, (500 – n) will change depending on how many pitches a player has seen. The 500 – n is key here because as a player progresses through a season and has the chance to see more pitches, the CSW that he has displayed will have more weight (or be less influenced by the mean), thus the use of the term ballast.
Now, let’s see an example using a player from the Dodgers/Diamondbacks game on June 24. For out example, we will use Tim Locastro, who at the time of that game was running a CSW of 30.4% and had seen 408 pitches:
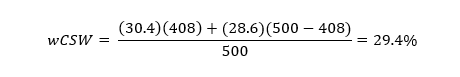
Here we can see the ballast in action. His 30.4% CSW is given more weight (81.6% of the total weight) than the weighted league average, so it only pulls his number down slightly. Again, as a player gets closer to 500 pitches seen, the wCSW will be more representative of the player’s true talent level and not the population mean.
A Game Example
Now let’s check out an example using the Dodgers/Diamondbacks again. Below is a table showing results from the Dodgers/Diamondbacks game from June 24. The first two columns are self-explanatory, the bCSW column represents each batters CSW, n is the number of pitches that each batter had seen so far this season, not including the present game, and the wCSW is the weighted CSW if a played had not yet seen 500 pitches. So the only time the wCSW is different from the bCSW is when the n value is less than 500.
| Pitcher | Name | bCSW | n | wCSW |
|---|---|---|---|---|
| Diamondbacks | ||||
| Clayton Kershaw | Adam Jones | 27.5% | 1058 | 27.5% |
| Clayton Kershaw | Ketel Marte | 23.1% | 1259 | 23.1% |
| Clayton Kershaw | Eduardo Escobar | 28.2% | 1323 | 28.2% |
| Clayton Kershaw | David Peralta | 28.9% | 1048 | 28.9% |
| Clayton Kershaw | Christian Walker | 27.1% | 1211 | 27.1% |
| Clayton Kershaw | Nick Ahmed | 28.6% | 1142 | 28.6% |
| Clayton Kershaw | Carson Kelly | 27.1% | 712 | 27.1% |
| Clayton Kershaw | Tim Locastro | 30.4% | 408 | 29.4% |
| Clayton Kershaw | Zack Greinke | 33.1% | 121 | 29.5% |
| Dodgers | ||||
| Zack Greinke | Joc Pederson | 25.6% | 968 | 25.6% |
| Zack Greinke | Alex Verdugo | 25.4% | 984 | 25.4% |
| Zack Greinke | Justin Turner | 25.2% | 1149 | 25.2% |
| Zack Greinke | Cody Bellinger | 26% | 1334 | 26% |
| Zack Greinke | Max Muncy | 29% | 1322 | 29% |
| Zack Greinke | Chris Taylor | 29.1% | 959 | 29.1% |
| Zack Greinke | Enrique Hernandez | 29% | 1094 | 29% |
| Zack Greinke | Austin Barnes | 31.3% | 665 | 31.3% |
| Zack Greinke | Clayton Kershaw | 33.6% | 107 | 29.5% |
| Zack Greinke | Matt Beaty | 29.1% | 258 | 28.8% |
| Zack Greinke | Kyle Garlick | 32.1% | 84 | 29.1% |
And from the previous table, we can derive the mean opponent CSW and the team factor, where the team factor is the opponent CSW divided by the weighted mean of all batter CSWs (28.6%). So in this case, the batters in the lineups were above average in CSW, hence the team factor being less than 1.
| Pitcher | Opponent | bCSW | Team Factor | CSW | CSW+ |
|---|---|---|---|---|---|
| Zack Greinke | LAD | 28% | 0.979 | 29.5% | 104 |
| Clayton Kershaw | ARI | 27.7% | 0.969 | 22.5% | 80 |
CSW+ in Action
Going back to the games on June 30, let’s check out the CSW and CSW+ values. Blake Snell was an absolute monster. He posted the second-best CSW rate of the season at 47.5% (Shane Bieber had a 47.7% game on May 19), and his CSW+ puts him 55% above average. His performance on that day overshadowed excellent games from the likes of Gerrit Cole and Max Scherzer. Going forward, this table will be available through the daily tweets by Alex (follow him on Twitter @alexfast8) and will be found on the open source CSW sheet that he has shared.
| Game Date | Pitcher Name | CSW | Opponent | Team Factor (bCSW) | CSW+ |
|---|---|---|---|---|---|
| 30-Jun-2019 | Blake Snell | 47.5% | TEX | 1.06 (30.2%) | 155 |
| 30-Jun-2019 | Gerrit Cole | 37.6% | SEA | 1.01 (29%) | 129 |
| 30-Jun-2019 | Lewis Thorpe | 37.1% | CWS | 1.05 (30.1%) | 122 |
| 30-Jun-2019 | Max Scherzer | 35.7% | DET | 1.02 (29%) | 122 |
| 30-Jun-2019 | Jake Arrieta | 35.5% | MIA | 1.04 (29.6%) | 118 |
| 30-Jun-2019 | Miles Mikolas | 34.5% | SD | 1.06 (30.2%) | 112 |
| 30-Jun-2019 | Anthony DeSclafani | 34.2% | CHC | 1.01 (28.8%) | 117 |
| 30-Jun-2019 | Robbie Ray | 33.7% | SF | 0.98 (28.1%) | 118 |
| 30-Jun-2019 | Shane Bieber | 33% | BAL | 1.02 (29.2%) | 112 |
| 30-Jun-2019 | Jesse Chavez | 32.2% | TB | 1.01 (28.9%) | 110 |
| 30-Jun-2019 | Noah Syndergaard | 31.1% | ATL | 0.97 (27.8%) | 110 |
| 30-Jun-2019 | Kenta Maeda | 30.7% | COL | 0.97 (27.7%) | 109 |
| 30-Jun-2019 | Andrew Heaney | 29.8% | OAK | 0.99 (28.2%) | 105 |
| 30-Jun-2019 | Chris Bassitt | 29.8% | LAA | 0.95 (27.2%) | 108 |
| 30-Jun-2019 | Max Fried | 29.6% | NYM | 0.97 (27.6%) | 106 |
| 30-Jun-2019 | Joey Lucchesi | 28.7% | STL | 1.04 (29.7%) | 95 |
| 30-Jun-2019 | Jon Lester | 28.2% | CIN | 0.96 (27.5%) | 101 |
| 30-Jun-2019 | Lucas Giolito | 27.9% | MIN | 0.98 (28%) | 99 |
| 30-Jun-2019 | Steven Brault | 27.8% | MIL | 1.01 (28.9%) | 95 |
| 30-Jun-2019 | Madison Bumgarner | 27.1% | ARI | 0.98 (28%) | 95 |
| 30-Jun-2019 | Trevor Richards | 26.2% | PHI | 0.97 (27.8%) | 93 |
| 30-Jun-2019 | Marco Gonzales | 26% | HOU | 0.95 (27.1%) | 95 |
| 30-Jun-2019 | Jordan Zimmermann | 25.8% | WSH | 0.95 (27.1%) | 94 |
| 30-Jun-2019 | Brad Keller | 24.8% | TOR | 1.04 (29.6%) | 83 |
| 30-Jun-2019 | Aaron Sanchez | 24.7% | KC | 1.01 (28.8%) | 85 |
| 30-Jun-2019 | Eduardo Rodriguez | 23.5% | NYY | 0.99 (28.2%) | 82 |
| 30-Jun-2019 | Gabriel Ynoa | 22.9% | CLE | 0.94 (26.8%) | 84 |
| 30-Jun-2019 | Zach Davies | 20.6% | PIT | 0.9 (25.7%) | 78 |
| 30-Jun-2019 | Chi Chi Gonzalez | 17.4% | LAD | 0.99 (28.2%) | 61 |
Closing Thoughts
The updated CSW+ metric will now take opponent quality into account, which should be an improvement over the previous version that only looked at a team’s cumulative performance. Probably the most critical part of this update was the introduction of the ballast, which will help reduce the effect of small sample size while still accounting for a player’s true talent level. And for those of you wondering how different the new CSW+ is from the original version, the answer is: not much. I think over the past few weeks the biggest discrepancy I’ve seen is about five points, but the new version will reflect lineup quality more accurately than the previous version.
Finally, a big thank you to Greg Burda for his comment on the previous article to help make CSW+ better.
Featured image by Justin Paradis (@freshmeatcomm on Twitter)