


The statistical detail offered by sites such as Baseball Savant and Brooks Baseball has helped usher the sabermetrics circuit into a new era of analysis, particularly regarding pitcher performance. These days, stats such as xwOBA, whiff rate, spin rate, and exit velocity provide a higher degree of analytical refinement, especially in regard to individual pitch type performance. This granular focus on pitch type analysis fostered a big step forward in our understanding of pitcher effectiveness.
Fastball v. Breaking Ball Contrast
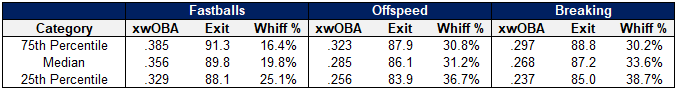
Access to individual pitch-type data has led to interesting findings. For instance, hitters across MLB perform significantly better on fastballs compared with offspeed and breaking pitches. The below chart, which was featured in my article on hitters that possessed the ability to hit multiple pitch types, exemplifies this differential. In 2018, the league median xwOBA against fastballs was .356 with a 19.8% whiff rate compared with a .268 xwOBA and 33.6% whiff rate on breaking pitches.
While the statistical deviations are stark, armchair GMs and fantasy managers should exercise caution in how they use this data. These days, it’s very common for people to “fastball shame” and suggest that pitchers quick-fix their stat lines by simply opting to throw more breaking and offspeed pitches.
However, it’s important to remember that evaluating statistics on a pitcher’s overall stat line is very different than doing so on their individual pitches.
Usage Within Counts
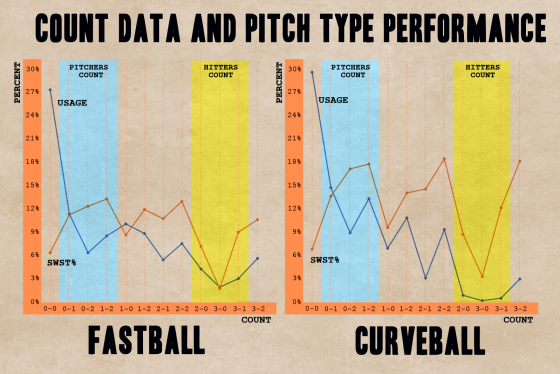
The below chart breaks down the leaguewide prevalence of different counts, along with usage rates for four-seamers and curveballs in those counts. These usage rates are relative to the total occurrence of those pitch types. For instance, 29.4% curveballs on 0-0 means that 29.4% of all curveballs are thrown in that count, not that 29.4% of 0-0 pitches are curveballs. Using this approach standardizes the usage rates of both pitches, which is important because four-seamers are more prevalent in every count. What we want to measure is the relative changes in usage rates as the count changes.
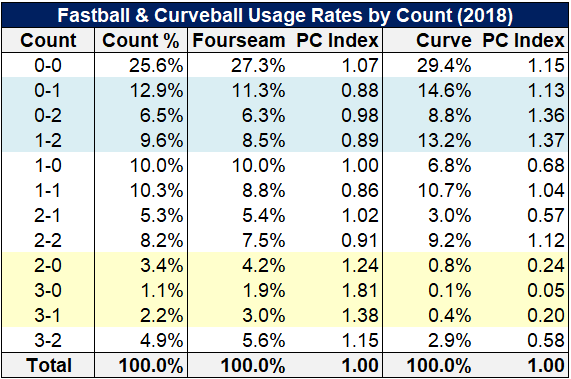
PC Index is a stat I created that divides pitch usage percentage by the count percentage, indicating the prevalence of a specific pitch type within a given count relative to the overall usage of that pitch. Pitcher-friendly counts, highlighted in blue, comprise nearly 30% of all pitches thrown. Curveball usage dominates in these counts, with a PC Index ranging from 1.13 to 1.37, compared with the four-seam fastball range of 0.88 to 0.98.
The divergence becomes even more striking on hitter-friendly counts, highlighted in yellow. Curveball usage in these counts is basically nonexistent, with a 0.05 to 0.24 PC Index range. Of the nearly 8,000 pitches thrown in 3-0 counts in 2018, a mere 31 were curveballs. On the contrary, four-seam usage ramps significantly in these counts, ranging from a 1.24 to 1.81 PC Index.
Perhaps the spirit of these results isn’t totally surprising. Most would likely suspect that pitchers gain more confidence in their breaking pitches in 0-2 compared to 3-1 counts. However, the order of magnitude here is striking, with pitchers being six to seven times more likely to throw their curveballs in a favorable count compared with an unfavorable one. Fastball usage doesn’t oscillate as much, however, it’s pervasiveness can swing as much as two times depending on the count.
Swing and Zone Variability
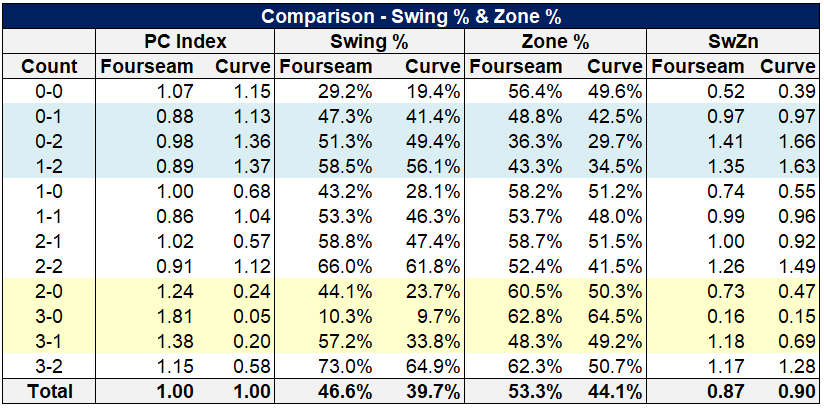
In addition to affecting pitcher behavior, different counts also cause significant variation in hitter conduct. Swing rates on 0-0 pitches clock in at 29.2% when a four-seam fastball is thrown and 19.4% for a curveball, significantly below the 46.6% and 39.7% respective overall averages for each pitch. Meanwhile, hitters swing at 2-2 pitches more than 60% of the time for both pitch types.
Part of the difference in swing rates is decided by how often pitches find the strike zone, and once again, there are significant differences by count. On a 0-0 count, pitchers throw their four-seamers in the zone at a 56.4% rate, compared with 49.6% for curveballs. These zone rates plummet to 36.3% and 29.7% respectively in a 0-2 count, and peak at 62.8% and 64.5% at 3-0.
To neutralize the effect of zone rate on a hitter’s decision to swing, I developed a stat called “SwZn.” This statistic simply divides swing rate by zone rate and serves as a good proxy for how likely or unlikely hitters are to swing at a pitch in the zone given the count.
Hitter behavior in a 0-0 count is quite fascinating, as their SwZn figure is only 0.52 for fastballs and 0.39 for curveballs. This indicates that hitters let a larger share of strikes sail over the plate than they should. SwZn ramps up by a factor of nearly three times among fastballs in 0-2, 1-2 and 2-2 counts, while spiking by nearly four time for curveballs, as hitters feel increased pressure to swing with the prospect of a strikeout looming.
Don’t Count on SwStk%
Swinging-strike rate (SwStk%), calculated as swings and misses divided by total pitches, has become the gold standard in evaluating pitcher performance, explaining more than one-third of a pitcher’s ERA on its own. The reason that SwStk% is such a good descriptor and predictor of success is that it accounts for two facets of a pitcher’s skill set: 1) ability to induce swinging strikes and 2) ability to show good command and control. The first component of that calculus is self-evident, as pitchers who induce more whiffs will have higher swinging-strike rates.
But the second is less intuitive, however equally important. Because the denominator of SwStk% is total pitches, a pitcher who throws more noncompetitive pitches out of the zone will have a higher total pitch denominator. The net effect of this is a lower SwStk%, meaning that even if a pitcher’s whiffs stay the same, he can improve his SwStk% by throwing fewer balls and vice versa.
The fact that SwStk% accounts for both whiffing and command ability makes it a great stat for a pitcher’s overall performance. However, that combination of inputs also makes it pretty poor at explaining success on individual pitch types.
Remember: Swing and zone rates vary massively depending on count. Fastballs feature more heavily in low-swing counts like 2-0, 3-0 and 3-1, while curveballs are virtually nonexistent in those counts. Meanwhile, curveballs are predominantly used early in counts and with the pitcher ahead.
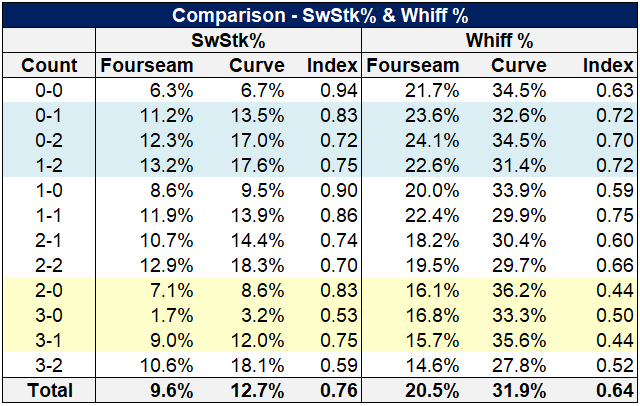
The overall SwStk% for four-seamers is 9.6%, compared with 12.7% for curves. But the expression of this statistic within counts varies wildly. At 0-0, the SwStk% for both pitches is virtually identical (0.94 fastball to curveball index)! However, the curveball is significantly more likely to induce a swinging strike on 0-2 (17.0% compared to 12.3%). Quite simply, SwStk% makes the fastball look worse than it is because of its usage within different pitch counts. As a result, it should not be used to describe an individual pitch’s performance.
Whiff %, described as swings and misses divided by swings, adjusts for some of these discrepancies. The overall four-seamer whiff rate of 20.5% compared with the curve 31.9% rate shows that the curveball is legitimately better at inducing whiffs. But again, there is a big difference depending on the count. In pitcher-friendly counts, the curveball earns roughly 30% more whiffs than the four-seamer. However, that difference expands to over 50% in hitter-friendly counts. Notice that the four-seam fastball whiff rate sits comfortably in the 23% 24% range in 0-1, 0-2, and 1-2, then nosedives to the 16% 17% range in 2-0, 3-0, and 3-1. If pitchers were to allocate their fastballs and curveballs more uniformly across counts, the whiff rates on both pitches would converge.
Conclusions
Advances in data granularity have enabled more in-depth analysis of pitcher performance, particularly in regard to individual pitch types. The superior production in terms of wOBA, swinging-strike rate, and whiff rate of breaking and offspeed pitches has caused many to question the fastball’s traditional role in the pitch repertoire.
While some of these concerns are valid, they need a caveat of understanding how pitchers use the different pitch types. Breaking balls tend to be used disproportionately in pitcher’s counts, which is a big factor in explaining why they test better by a variety of metrics. Subsequently, in addition to a strong baseline usage in each count, pitchers tend to use fastballs as loss-leaders in more in hitter-friendly counts.
There is an opportunity for significantly more research in this area. A subsequent article will explore how micro-location within the zone shifts for these pitch types based on count, along with how count affects batted-ball quality.
Graphic by Justin Paradis (@freshmeatcomm on Twitter)
This is really great stuff. The count and zone usage explains why we use SwStr% in relative terms to evaluate specific pitch types. For example, it’s understood that a 9% SwStr% on a fourseamer is good but 12% on a curveball is just OK, because fourseamers are used in hitter counts and thrown in the zone more
Thanks, Dan!
Each pitch type definitely has a different context for what constitutes a good SwStk% or Whiff%.
When evaluating specific pitch types, I think we should ditch SwStk% in favor of a combination of Whiff % and Zone %. SwStk% is biased by if a hitter swings, and as I tried to point out, that can be very situationally dependent.
SwStk% is still a terrific overall indicator of a pitcher’s ability, though.