


Aside from maybe Patrick Corbin, there haven’t been many players as anticipated as Christian Yelich to experience some form of regression. The problem, people figure, is that he puts the ball on the ground an awful lot to be able to sustain this kind of production. He hits the ball hard. Nothing new about that. Last year, Yelich finished the year in the top 1% of xBA, xSLG, wOBA, xwOBA and xwoBACON. His wOBA matched his xwOBA, too, so it’s always seemed a little strange that he’s been so commonly tagged as a regression candidate.
Until recently, Eric Hosmer and Yelich have been sort of inseparable. Both hit the ball hard, and both hit the ball on the ground — a lot. There’s a reason Hosmer got a $144 million contract, and though those reasons were more valid before 2018 than they are now, the point remains that both hitters have hit the ball hard over the course of their careers, and both have career launch angles in the 3s. In 2017, Yelich was practically identical to Hosmer.
Their 2017 numbers:
| Exit Velo | Launch Angle | wOBA | xwOBA | xwoBACON | |
| Hosmer | 89.7 | 3.8 | .376 | .364 | .398 |
| Yelich | 90.4 | 4.7 | .348 | .364 | .413 |
Then, in 2018, Yelich became more selective and more aggressive in his approach. His batted-ball profile didn’t change much: His exit velocity jumped by two points, but that only raised him 1 percent relative to the league. His launch angle also remained exactly as it was the season prior, at 4.7 degrees. Whereas Hosmer has continued his ways — actually, his average launch angle dropped to -1.2 degrees last season — Yelich has finally begun to change course.
Here, I’ve plotted 2018 exit velocity on the X-axis and launch angle on the Y-axis. The red dot you see towards the bottom right corner is, as labeled, Yelich:
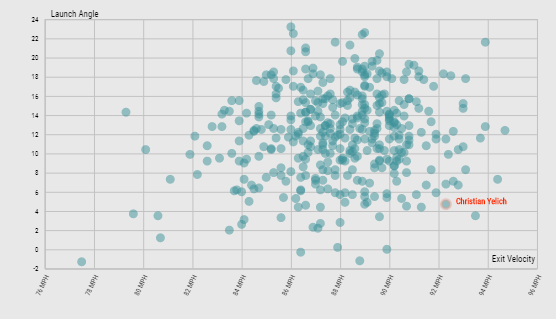
Exit velocity is the more meaningful factor here, and you can see that Yelich is among the most elite hitters in that category. When it comes to launch angle, the opposite is true: Yelich had one of the lowest average launch angles in the league in 2018.
Here’s the same scatter plot, but with 2019 numbers:
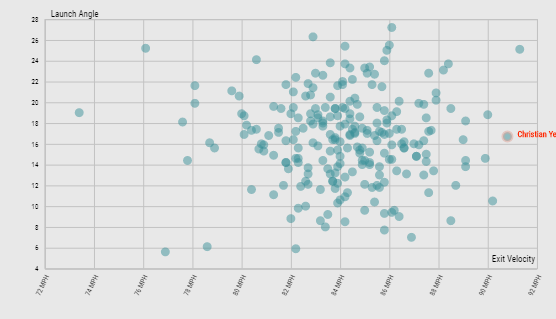
Yelich has moved significantly! So significantly that his name isn’t fully in my screengrab. You can see that only one player has averaged a higher exit velocity, and that player is none other than Joey Gallo. So yes, it’s true that Yelich has shifted to the right (and that matters!), but what interests me is that he’s moved into the middle of the pack in terms of launch angle.
Thus far, I would think many would argue that Yelich is better suited with his shiny new average launch angle. Let us compare Yelich to this point in 2018 and 2019:
| Year | BB% | K% | BABIP | wOBA | wRC+ | HR |
| 2018 (thru 98 PA) | 10.2 | 20.4 | .344 | .356 | 122 | 3 |
| 2019 (thru 99 PA) | 14.1 | 15.2 | .304 | .523 | 229 | 13 |
It’s hard to argue with these results. Things look great on all fronts thus far for Yelich. Walks are up, strikeouts are down, his wOBA and wRC+ are up, and he already has totaled as many home runs as Jose Altuve and Jackie Bradley Jr. did all of last season. His 2019 BABIP looks deflated, but it wouldn’t if home runs were calculated in the formula for BABIP. It’s only about 100 plate appearances, but Yelich has vastly outpaced even his 2018 self, who was incredible.
So there are the outcomes. How has Yelich’s process changed?
| Year | Swing% | Contact% | Zone% |
| 2018 (thru 98 PA) | 40.0 | 78.3 | 48.4 |
| 2018 | 44.0 | 79.0 | 44.2 |
| 2019 (99 PA) | 45.1 | 75.7 | 38.1 |
For simplicity’s sake, I included just Swing%, Contact% and Zone%. Despite being pitched in the zone far less, Yelich has actually swung a touch more this year, and almost all of those have been swings inside the zone. It’s encouraging to see Yelich’s contact numbers remain mostly intact, despite pitchers’ hesitance to pitch to him. His O-Contact% has fallen pretty considerably (which is a function of more breaking pitches and fewer pitches in the zone), but his Z-Contact% has risen slightly.
That’s a lot to take in, but there’s a rather simple way to slice it: Pitchers are becoming increasingly reluctant to pitch to him, while Yelich has gotten more aggressive, and he’s traded some swings and misses for more power output. For now, that’s a healthy tradeoff, especially because pitchers have shown apprehension throwing him hittable pitches.
I’ve plotted his Zone% with fastball percentage here to see how the changes have unfolded over time:
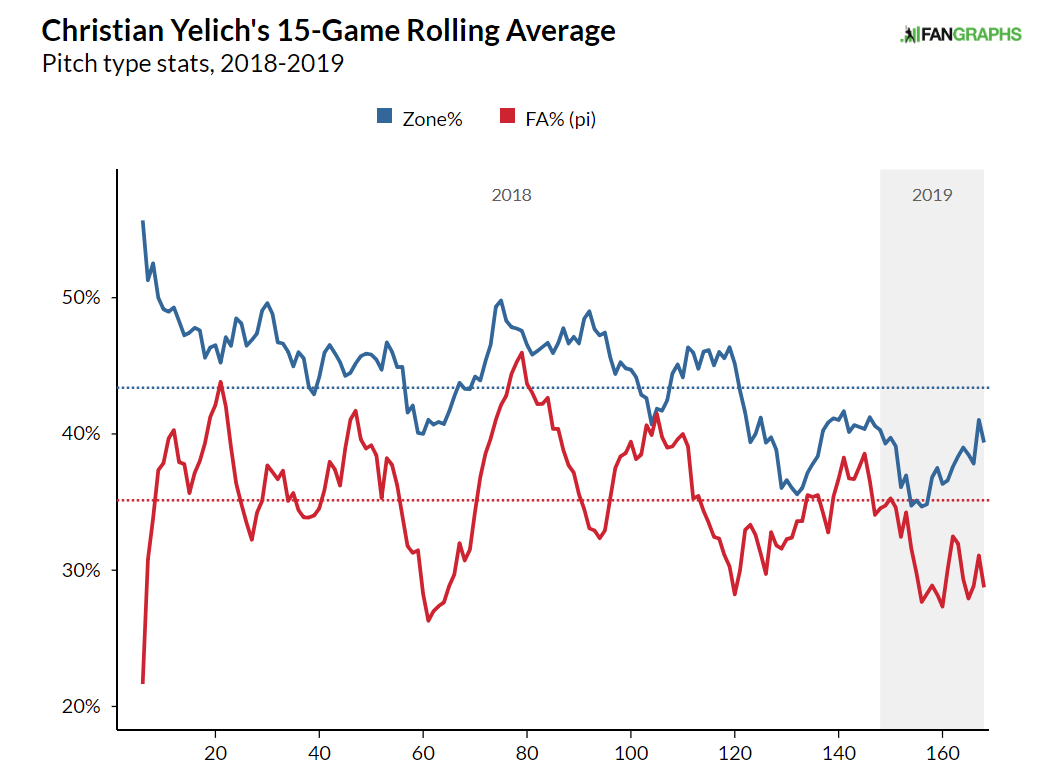
In terms of the number of fastballs he’s seeing, this isn’t unprecedented, but it is lower than he’s used to. For Zone%, there’s been a pretty clear, consistent downward trend. The point, of course, is that pitchers don’t want to give in to Yelich, and that means feeding him fewer fastballs and pitches in the zone.
In the same vein, one adjustment Yelich made last season was increasing his aggressiveness against the first pitch. On one hand, you want to be able to work counts and see pitches you want, but also, the first pitch is often the best pitch you’ll see in an at-bat. That’s becoming truer with every dinger, as pitchers throw to him in the zone less and less.
On top is how pitchers have thrown to Yelich on the first pitch in 2019, while the pitches he’s swung at is on the bottom:
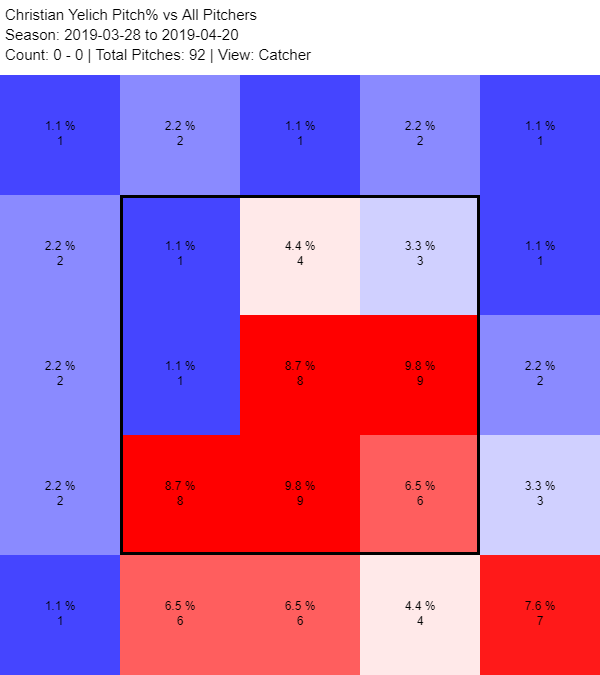
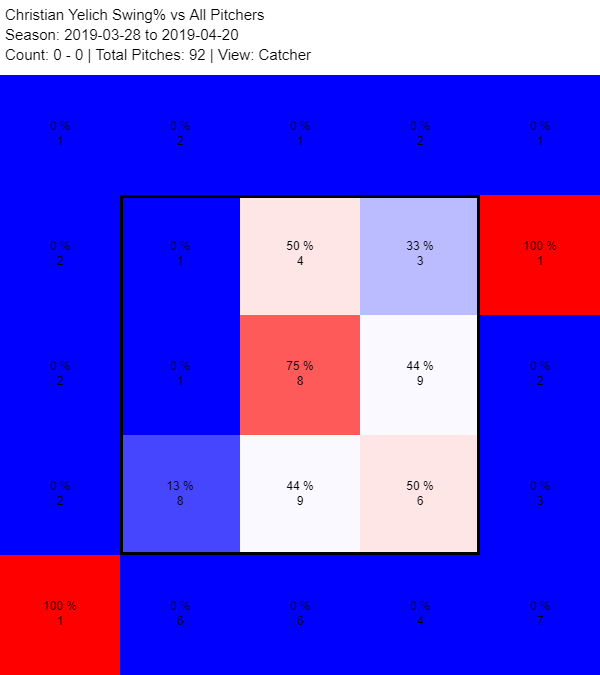
More than half the time, the first pitch has been somewhere in the zone. Often, it’s in the middle of the zone. Clearly, Yelich knows what he’s looking for on the first pitch. It’s fascinating. On the eight pitches in the middle of the zone, Yelich has swung at six of them, and he’s slugging 1.000 per pitch on them — 1.000!
Here is a table showing hitters from 2018 to 2019, on the first pitch, sorted by home runs:
| Rk | Player | PA | HR | HRtot | HR/HRtot | OBP | OPS | BABIP |
| 1 | Christian Yelich | 87 | 15 | 47 | 0.32 | .517 | 1.705 | .400 |
| 2 | Khris Davis | 107 | 12 | 58 | 0.21 | .402 | 1.212 | .281 |
| 3 | Joey Gallo | 69 | 12 | 47 | 0.26 | .441 | 1.507 | .333 |
| 4 | Manny Machado | 116 | 11 | 41 | 0.26 | .440 | 1.283 | .381 |
| 5 | J.D. Martinez | 90 | 11 | 47 | 0.23 | .539 | 1.567 | .462 |
| 6 | Bryce Harper | 81 | 10 | 38 | 0.26 | .395 | 1.290 | .290 |
| 7 | Javier Baez | 125 | 10 | 40 | 0.25 | .392 | 1.172 | .327 |
Unless you count Max Muncy’s 1.776 OPS in 35 plate appearances (I don’t), Yelich has been the most dominant hitter in the MLB on the first pitch since 2018. Granted, he’s always been solid on the first pitch, but now, he’s absolutely absurd. He didn’t use to be this aggressive, and he’s still not quite the most aggressive — he ranks 35th in the MLB in first pitch events — but he’s been making the most of the first pitch, more than anyone in the league. By maximizing an area in which he’s elite, he’s been able to up his overall offensive output and take advantage of favorable pitches before he gets into pitcher-friendly counts. Unsurprisingly, first-pitch home runs have made up a greater proportion of Yelich’s home runs than any other hitters with a meaningful amount of home runs and plate appearances.
Here’s a good example — an 0-0 pitch to Yelich from Julio Urias:
I’m sure this caught you by surprise. It’s about the process, not the outcome. Yelich was aggressive on the first pitch and crushed the pitch, good for an exit velocity of 112 mph and xBA of 0.760. Alas, Corey Seager snares it for an out.
In the same game, Yelich made up for his earlier misfortune:
The previous pitch, Yelich took a first-pitch hack and fouled it off. On the next offering, Kenley Jansen misses his spot, and Yelich ricochets it off of the scoreboard in center field. You can stop a ball smoked at a 7-degree launch angle, but nobody’s stopping that.
These demonstrate both Yelich’s aggressiveness an his ability to punish mistakes. The following videos will highlight two more of the skills at his disposal.
Here’s Yelich on Saturday against poor, poor Hyun-jin Ryu:
This may not look impressive (or maybe it does), but it is. To have the ability to not only lift this ball into the air, but to also get it over the fence in left center is truly special. It’s especially notable because years ago, this would have been a ball that Yelich put on the ground, but he doesn’t do that here.
Again, against Ryu, on a (nice) curveball:
This is exactly the kind of pitch Yelich dreams of on the first pitch — mistakes right in the center of the plate. Ryu is by no means a world beater, but it’s impressive to see Yelich homer twice in one game, off of a left-handed pitcher, no less.
In terms of optimization, Yelich has to know that a ball hit 95 mph at a 20-degree angle is better than a ball hit at, say, a 7-degree angle like the lineout to Seager. Theoretically, exit velocity peaks between -10 and 10 degrees in vertical launch angle, but Yelich isn’t hurting for exit velocity. Plus, that’s not where the home runs will come from. 94% of home runs are hit in the 20- to 40-degree range. But as Perpetua has noted, 19 to 26 degrees is the pinnacle of batted-ball value. Yelich would be best suited by getting into this range more.
First, let’s take a look at this chart. This stupid, stupid chart.
Yelich’s average exit velocity and their launch angles:
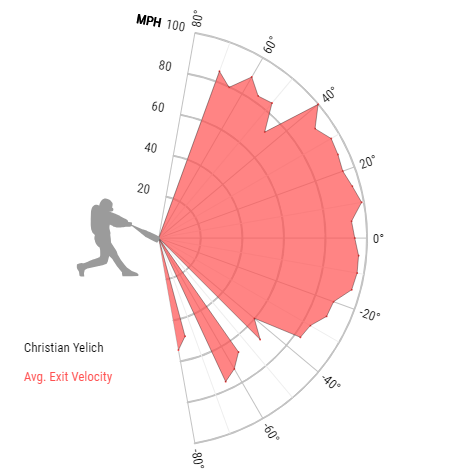
No matter where he hits it, Yelich hits it hard. There are exceptions, but so long as it’s not a 45-degree fly ball or a ball beat -30 degrees into the ground, Yelich is going to hit it hard most of the time. That’s why, to this point, his launch angle has yet to be an issue.
After last season, I don’t think that Yelich needs to change anything. Changing his swing or approach risks losing his elite production, and we don’t want to do that. Yelich, though, appears to be doing it on his own, and it doesn’t sound like he’s pressing to do so. That’s a promising development.
Here’s a graph showing Yelich’s rolling average launch angle from 2015 to 2019:
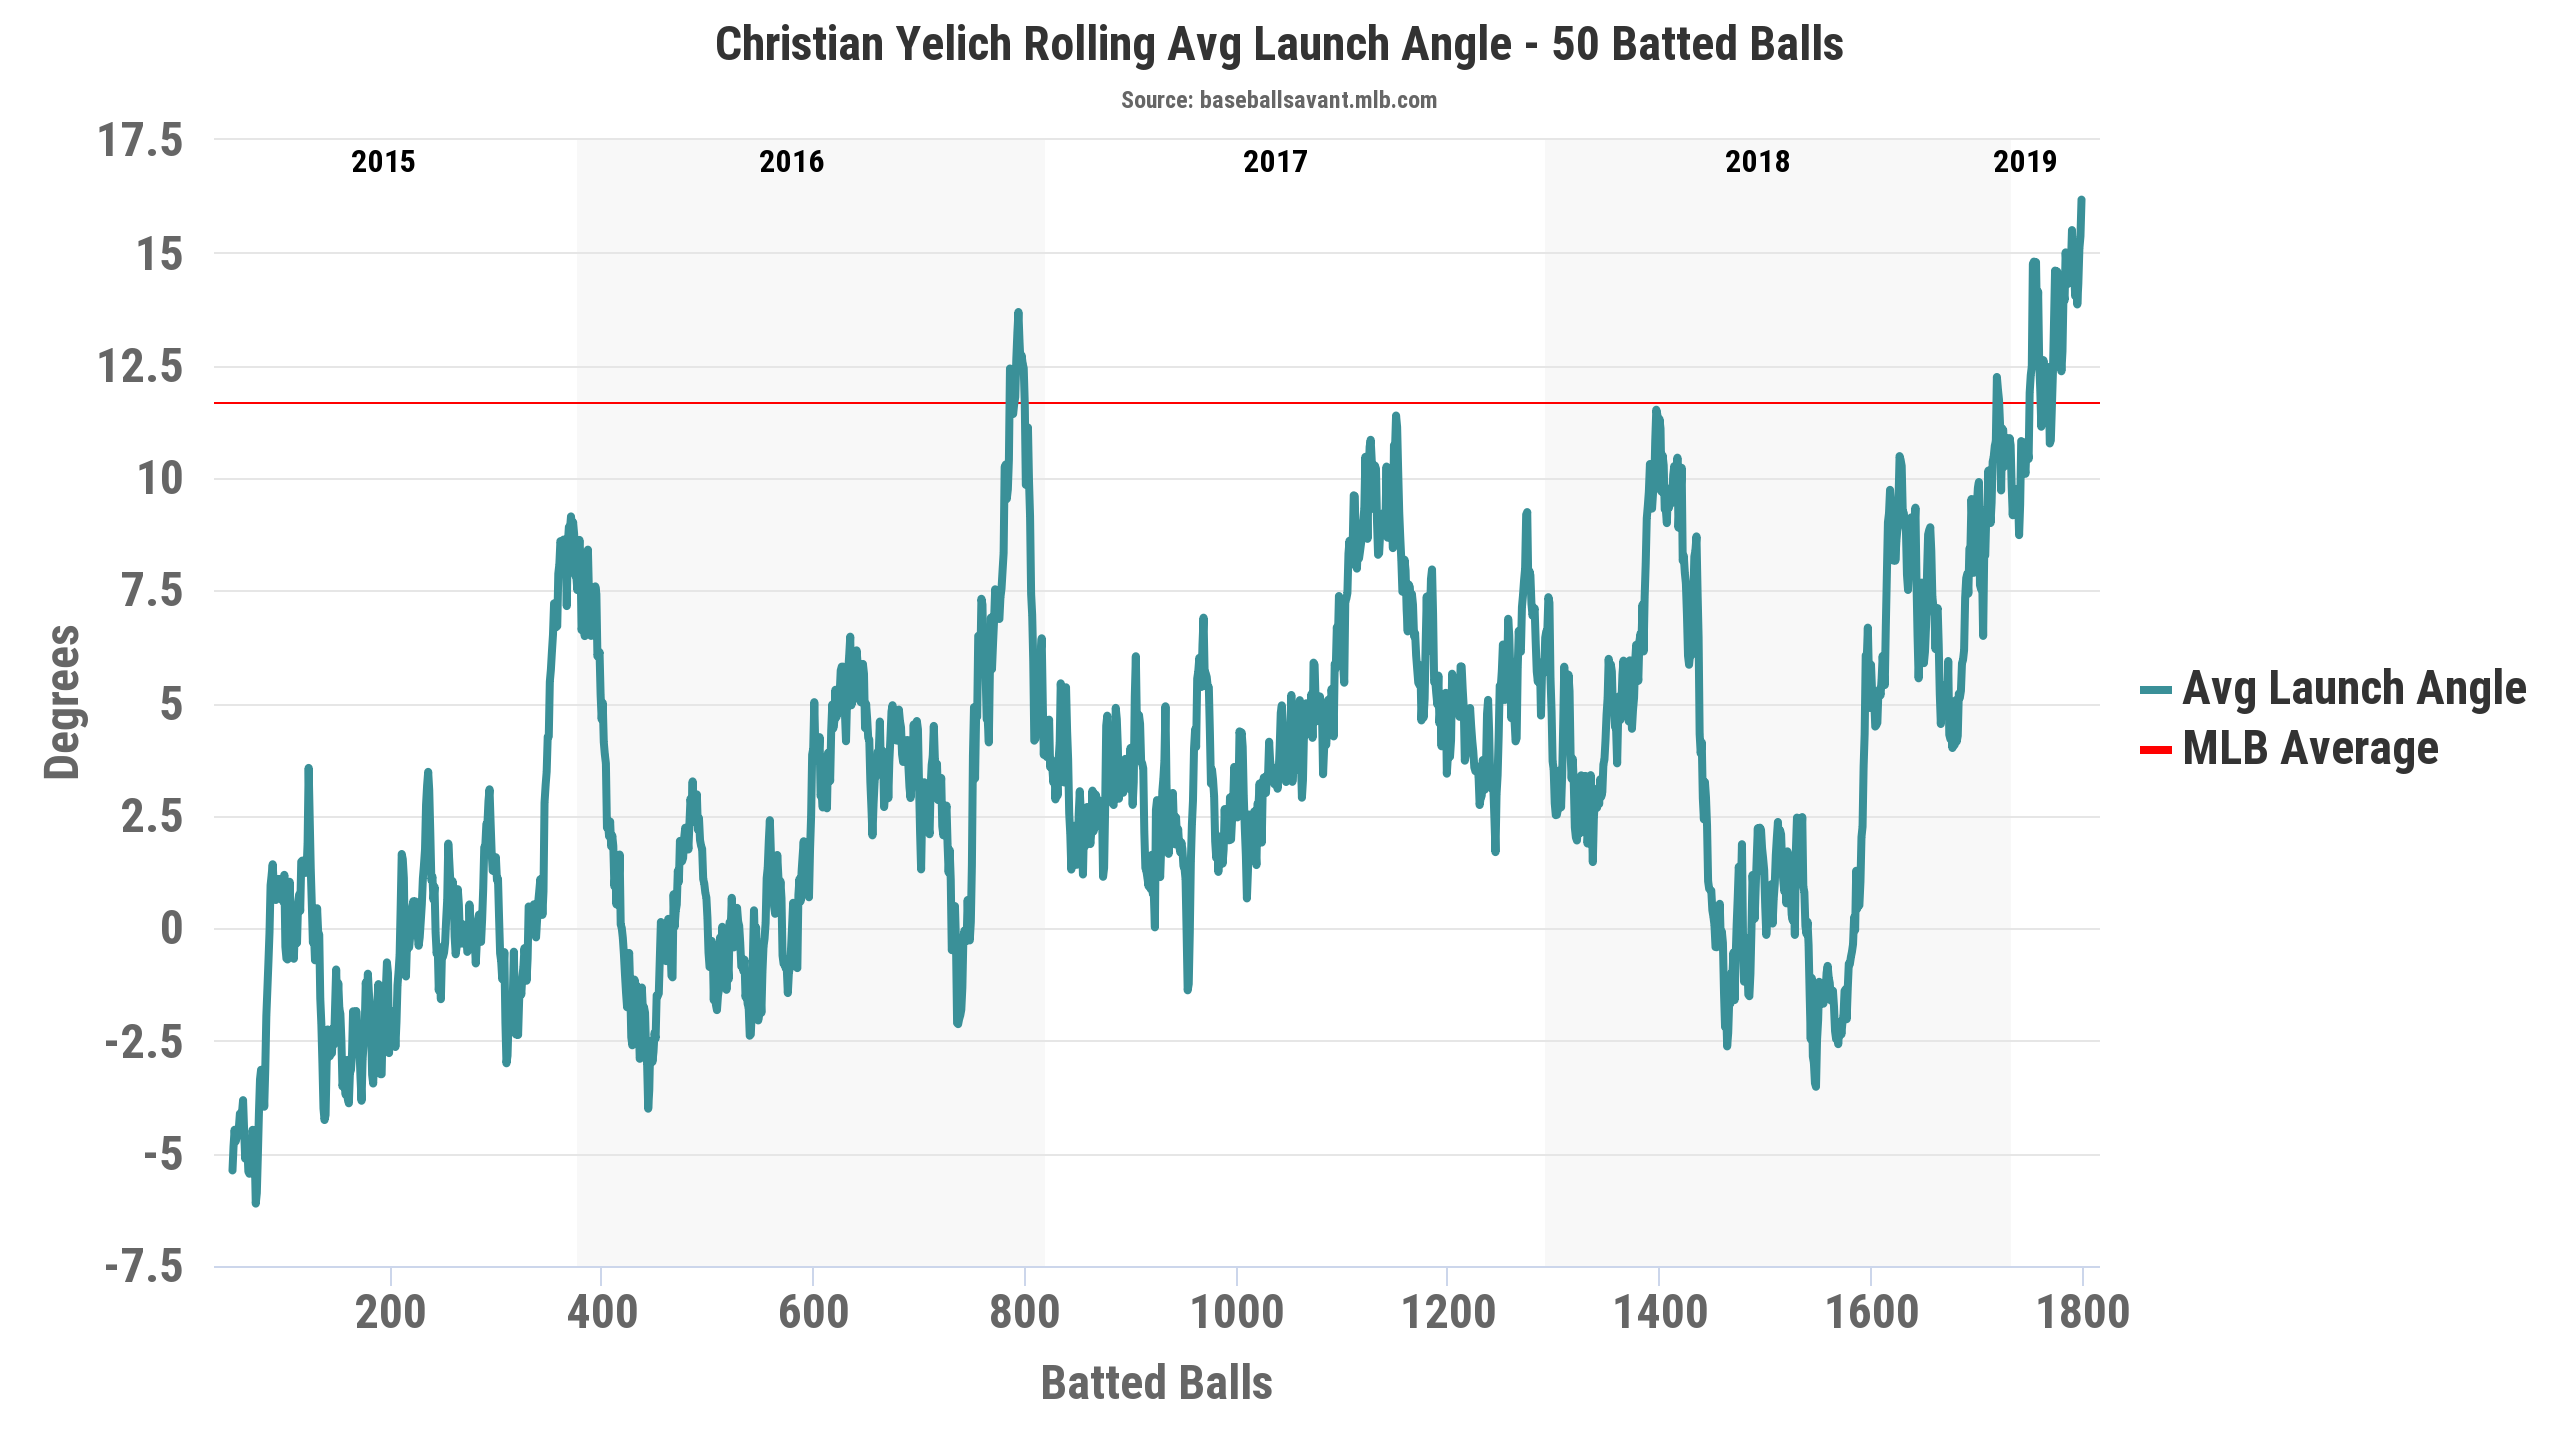
Since the end of 2018, Yelich’s launch angle has been trending up. It’s risen so drastically at this point that his average launch angle is several degrees above the league average. This could be a fluke, I suppose. Stringing together more than a dozen dingers in less than a month can skew your average launch angle, but it sure doesn’t seem like a fluke.
Yelich’s average launch angle, by pitch group:
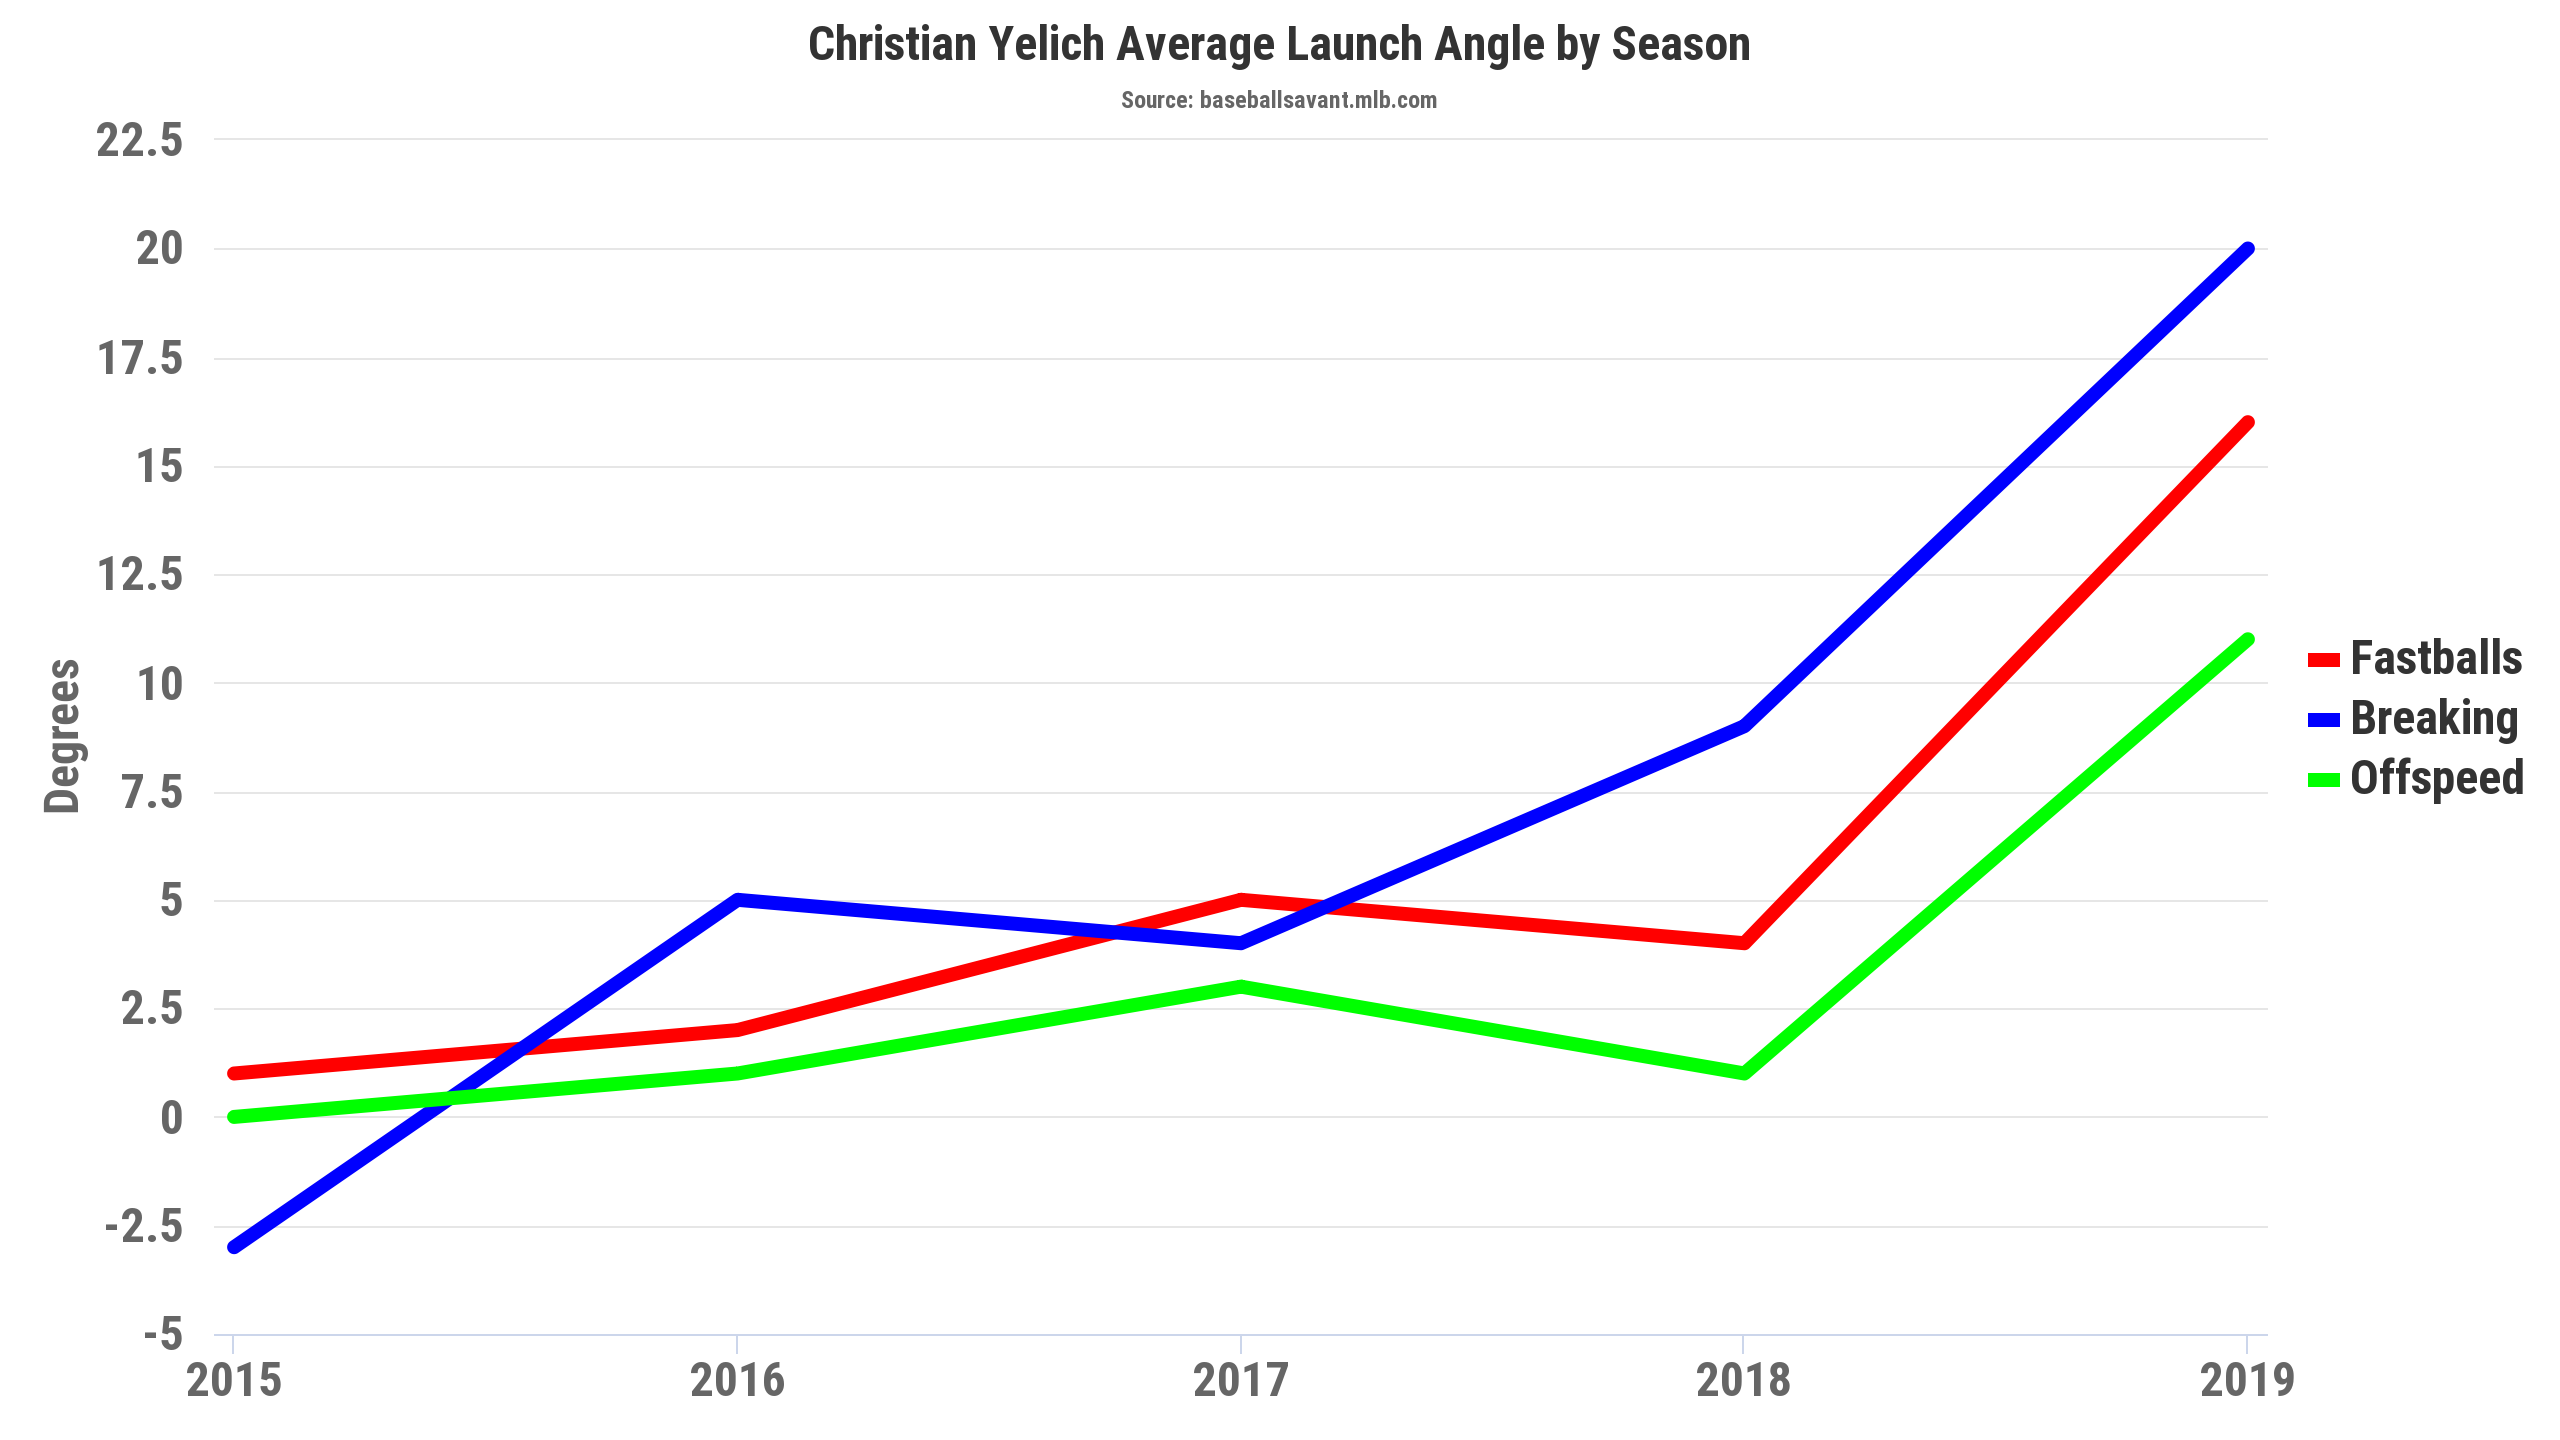
Regardless of pitch group, Yelich has lifted his launch angle on each by 11, 12, and 10 degrees, respectively, while significantly raising his fly-ball percentage on breaking and offspeed pitches as well as doubling his fly-ball percentage against fastballs.
To be fair, most of this is coming against righties, but that’s where it matters most. Against lefties, Yelich has lifted his average launch angle from 3 degrees in 2017 and 2018 to 6 degrees in 2019, but his xwOBA versus lefties has remained almost identical. Against righties, though, Yelich has improved his average launch angle from 5 degrees in 2017 and 2018 to 20 degrees this year, while improving his xwOBA from 0.425 to 0.493.
But not all launch angles are created equal. It’s not always good for hitters to alter their launch angles, and launch angle distributions rarely look the same. Case in point: Teoscar Hernandez, Corey Seager and Yelich share similar average launch angles. Here’s how their distributions stack up:
There are vague similarities, and though it’s early, each player has created outs and had successes in different areas. Whereas Seager is creating most of his outs at 30 degrees, that’s where Yelich’s greatest success has come — mostly in the form of home runs. Hernandez has the most heterogeneous distribution, but he’s not having success regardless of the angle at which he hits the ball. Yikes!
And so in this manner, it’s important to then look at how Yelich’s launch angle distribution has changed. This, obviously, is theoretical, but if he remained mostly the same as 2018 but sprinkled in a half dozen 60-degree pop-ups in the infield, his average launch angle would change, but, if anything, he would be worse off.
Here, we can see that part of what I just mentioned is true. Yelich has four batted balls that were popped up upwards of 60 degrees, where he had about six of the same types of batted balls all of last year. This is why his infield fly-ball percentage has jumped from 4.9% in 2018 to 10.7% in 2019. It’s not an issue at this point, but it does help us to contextualize his average launch angle. Secondly, most of Yelich’s batted-ball outs occurred below -20 degrees in 2018, while this year, that has yet to be the case. We’re seeing a true shift upward this year. That’s both from lifting balls and also spiking balls less.
Yelich can’t keep this up forever. Last year, he put up a ridiculous 35.0% HR/FB and has doubled down this season with a 39.3% HR/FB rate. It’s obvious that he can’t sustain this pace — this is nearly peak Barry Bonds territory. His HR/FB rate gives us a distinct rationale for Yelich’s blisteringly hot start. That’s not to say that he can’t be better than 2018, though.
Yelich, on all plate appearances:
- 2018: 0.418 xwOBA
- 2019: 0.475 xwOBA
Yelich, on all non-home run plate appearances:
- 2018: 0.345 xwOBA
- 2019: 0.339 xwOBA
With a season total of 13 home runs, a more feasible 20% HR/FB rate would yield Yelich a total of six home runs, good for a 0.542 slugging percentage (as opposed to his current 0.880 slugging percentage). If you believe in the 35.3% HR/FB rate that he’s posted since the beginning of 2018, then maybe we can be a little more liberal and assign Yelich a 25% HR/FB rate. That would boost his theoretical slugging percentage to 0.639. Either way, we’re talking about the difference in slugging between 2018 Manny Machado and 2018 Mookie Betts. Of course, one is better than the other, but this just goes to show how insane Yelich has been.
With that said, it’s not fair to take away home runs Yelich has rightfully earned, and boy has he earned them as just two of his home runs thus far have an xBA of 0.500 or lower. As fly balls start to turn into outs, a 0.542 slugging percentage could be what we’re looking at as a baseline for his slugging percentage. Luckily for Yelich, no one can take away his 13 home runs on the year, so none of this actually matters, but it helps to see what life would be like if every fly ball Yelich hit didn’t turn into a home run.
Conveniently, FanGraphs has just released some more Plus Stats that make it easier for us to compare Yelich with his peers. Just as wRC+ and the like work, the following Plus Stats work by taking their batted-ball percentages and adjusting them so that 100 is league average, whereas 113 is 13% above league average, and so on.
Yelich’s Plus Stats in 2018 and 2019:
| Year | LD%+ | GB%+ | FB%+ |
| 2018 | 113 | 120 | 67 |
| 2019 | 87 | 95 | 114 |
In 2018, Yelich was 14th in GB%+. In 2019, Yelich has dropped to 96th. In this regard, Yelich has become closer to league average, which, for him, is good. 2018 Yelich was mostly a line-drive and ground-ball hitter, while 2019 Yelich is pretty even across the board. His career 2.78 GB/FB has dropped to 0.93 in 2019. (Bananas, I say! That is bananas!) It’s encouraging to see the fly-ball rate elevated. When he does hit ground balls, they’ll be hit hard, per usual, but with a sprint speed of 28.7 ft/s, he won’t be as hurt by them as someone such as teammate Jesus Aguilar. On his batted balls, he doesn’t discriminate — all of them are hit hard. Yes, he’ll roll over on a pitch and hit it weakly to the second baseman, but Yelich has made success at an average 4.7-degree launch angle look like duck soup. Now it’s time to see what he looks like with 12 degrees added to his average launch angle.
Now, I would be remiss if I did not mention the potential juiced ball effects. First, per Alex Chamberlain’s pitch database, from 2018 to 2019, home runs per outfield fly ball (HR/oFB) have leaped from 19.1% to 21.8%. That 21.8% mark is reminiscent of the 21.4% HR/oFB league average in 2017, when it was deemed that the balls were having an effect on the inflated home run total. Research from two weeks ago suggests that the ball is indeed juiced again. Yelich surely has benefited, but players are all hitting against the same balls.
Much is going to be made about Yelich’s launch angle, and even here, I’ve made a big stink about it. This could all be very intentional. After all, Yelich had a 402 wRC+ on fly balls in 2018, a year after posting a 195 wRC+ on fly balls. He could have finally decided that it was time to start lifting the ball, but I have my doubts that Yelich has made any effort to join the so-called fly-ball revolution. Rather, I think he’s merely started to come into his own both mentally and physically — he just turned 27 years old, after all, and it doesn’t hurt that the ball is (probably) juiced. Yelich himself has said as recently as last October that he’s just focused on hitting the ball hard, not what angle he’s hitting it.
I’ve presented you with a lot of information — too much information, maybe. You may do with it what you will, but at this point, one thing is clear: It isn’t if Christian Yelich is elite, it’s how elite can he be. He might even be the player to topple Mike Trout from his perch at the top of the leaderboards.
(Photo by Larry Radloff/Icon Sportswire).
(All GIFs courtesy of Dan McNamara and Michael Ajeto)
sigh…now I have to punch myself again for taking Trevor Story over Yelich. (my rationale was that I already had Betts.) Story is good and all…but jeez.
Yeesh! Betts and Yelich would have been nice. Hope Story turns it around for ya!
Story is doing fine esp after that rough start. But Yelich is on that top half of 1st round level. Oh well, I am deep at SS, that isn’t a bad thing.
Great piece!
As a Yelich owner this article was essentially fantasy erotica
This is (by far!) the best comment I’ve ever received. Congrats on being a Yelich owner!