


I wrote an article a few weeks ago about release points and how they can be the key component of deception and a great starting point for tunneling. The ability to tunnel, which manifests itself when a pitcher has the right pitches to work with and understanding how to best sequence them, can be a big advantage for a pitcher. It requires other just as important facets- developing consistent release points, knowing where to place your pitches, and understanding how to work with your spin axis to facilitate similar trajectories and ‘proper’ break at the commit point.
Mike The Roto Cop’s latest article inspired me to compile a list of tunneling data predicated on release points. Out of all pitchers that threw at least 1000 pitches in 2018, Chart 1 lists the nine best release point differences on all pitch types thrown (169 pitchers qualified).
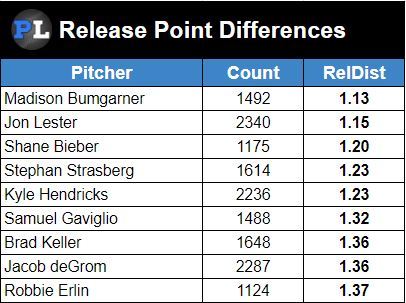
CHART 1, Release Point Differences
After looking over all current quantifiable aspects of tunneling, I found Kansas City Royals‘ starter Brad Keller to be above average in all but one category. No other pitcher in his immediate vicinity (Jose Berrios matched Keller, but was 24th in RelDist) covered that many metrics. With lack of context, its possible his numbers are only average when considering all pitchers who outperform the median, but the fact that he was able to achieve in more categories than others in his direct company is commendable.
Here is a visual prospectus of Keller containing all pitches overlayed into one GIF.
To begin, I reviewed all of Keller’s two-pitch combo possibilities to both left and right-handed hitters. To left-handed hitters, Keller’s four-seam fastball working off his changeup is very effective according to tunneling metrics. It should be noted that this combo was thrown just 30 times in 2018 but since research isn’t really available (or conducted?) on what point pitch combo data normalizes, we’ll simply go with the sample size we have.
Here we have Keller’s best sequential tunnel combo to either type of hitter, a fastball followed by a slider.
I’ll elaborate on why this mixture works so well for Keller (and perhaps other pitchers). The FB/SL tends to stay tunneled until about .156 seconds before they hit the zone. The average speed differential between the two is about 39 milliseconds. I consider flight time differentials to be the most valuable measurement (at least when considering all of his pitches) because timing disruption is of the utmost importance when facing a batter.
While his slider to sinker demonstrates the largest overall perceived break ratio (17.4) from the tunnel point to the actual zone location once it reaches the plate, Keller’s FB/SL is the best of all groupings to lefties at a ratio of 16.1. This means that the average location difference appears to be 16 times larger than they were at the commit point, which is well above the league average of 11.9. The actual (measured) spread for this combination is an average of nearly two feet.
I want to point out that when I make a reference to league average in tunnel data, this is the league average of all pitches overall and not specific to a particular combination. It’s hard to say how this data compares to other pitchers who throw a fastball followed by a slider (and there are A LOT) but considering his overall numbers are so good, we can assume that Keller’s results stand out from his peers to a certain extent. Additionally, taking into consideration that a sinker is one of Keller’s main pitches, and sinkers usually don’t work well with other pitches (tunnel-y speaking), this only looks better for him because involving the pitch could skew his numbers a bit.
Switching to right-handed hitters, we get the same two-pitch sequence. This is interesting because you would think a FB/SL tunnel wouldn’t look the same to a lefty as it does to a righty when considering the peripheral vision. This leads me to the assumption that Keller, 23, has a firm grasp on how to make his stuff work for him under different circumstances. Again, without knowing how he fairs against other pitchers in the same situations, a general understanding of visual perception would lead you to believe this could be an aspect of Keller’s skill set that is elite.
I mentioned a few moments ago that sinkers don’t get along with other pitches, but Keller is able to make the sinker to slider pattern work.
So we understand how tunneling, under the right set of circumstances, has a correlation to success. Keller is one of the better tunneling pitchers in baseball given the available data, but was it a major factor in his 2018 accomplishments? There are some other things to consider first.
Keller appeared in 41 games last season and was a starter for 20 of them. The thing that jumps out the most when giving his ‘traditional’ stats a once-over is his incredibly low K-rate (16.5%). Of pitchers that appeared in at least 80 innings last season, Keller ranked 149th in that metric. His other intriguing proclivity was a well-above-average groundball rate as you see in Chart 2. So the next question becomes is a high GB% and low K% typical of groundball pitchers? And if so, does that make Keller’s K% reasonable with this additional consideration?
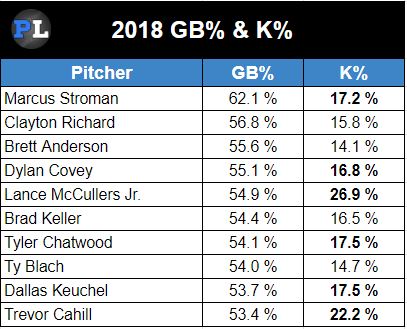
CHART 2, Groundball and strikeout rate
Chart 2 shows the top-10 groundball-inducing pitchers (min 80 innings) along with strikeout rate. The bold represents pitchers with a strikeout rate greater than Keller’s (2018 league average was 22.3%). Going down the original list (not shown) much further shows a similar pattern. With that general observation, one could surmise that his strikeout rate based on the frequency of groundball contact is average.
Speaking of contact, his plate discipline metrics yield no data worth prodding. Just about everything is in line with league-average. Exceptions taken on zone contact (83% v 88%) and less so on whiff rate (21% v 24%). Even with his slightly disconcerting zone contact rate, his batting average in the zone against league average is just .003 points higher.
Keller’s pitch locations are something of interest as well. 23% of his pitches end up out of the zone, 24% land in the zone, 44% hit the edges (the latter being 2% higher than league average). One pitcher with the propensity to hit the edges effectively is Zack Greinke, who commanded a 45% edge rate from 2016-18. However, what matters most is hitting those spots advantageously.
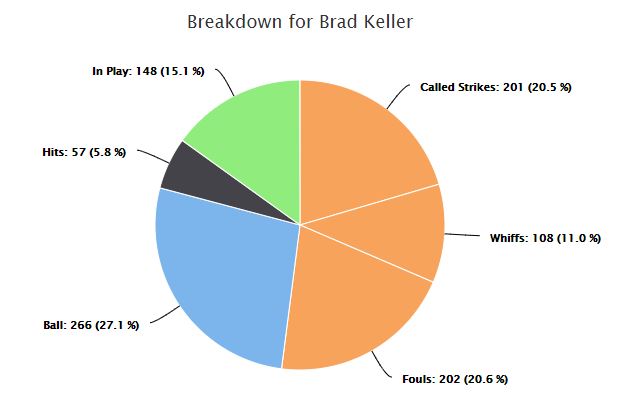
Chart 7, Zone edge results
Keller is able to generate strikes about 52% of the time while allowing hits at a rate of just under 6%. Does this mean that Keller has exceptional control as well?
To begin, Keller’s walk rate is right in line with the MLB average of 8%. You can’t make much of an appraisal just on walk rate alone, so I’ll consult Baseball Prospectus’ (still unrefined) command and control ratings. We can figure that Keller has great command when looking at his zone edge data but here’s the rub on that- does he always intend to hit the edge? Of course, we don’t have a stat that measures intent and the only thing that can even reasonably do so is observing catcher glove movement. Yet, even that isn’t completely reliable because there still is the element of human error. Crossing pitches or perhaps a catcher wants to throw off a hitter by placing his mitt in a location not consistent with the spot mutually agreed upon with the pitcher.
Regardless, the two stats we’ll look at are Called Strike Probability and Called Strikes Above Average. To debrief, CS Prob (control) is the likelihood a strike is called in a particular location in the zone based on historical pitch data. CSAA (command) is related to what I spoke of in the previous paragraph. It also measures strikes created as a measure of a pitcher hitting his spots consistently.
As before, cutting off pitchers with less than 80 IP in 2018, Keller ranked 129th (out of 174) with a .465 CS Prob. The average for eligible pitchers was .481. For CSAA, a more loosely-framed measurement, Keller ranked 125th with a -0.3 (.21 average). So this data somewhat contradicts what we might see with traditional information. A couple of important things to keep in mind is that CSAA only accounts for pitches taken, so if you have a guy who gets a lot of whiffs but doesn’t get many called strikes he will be ‘penalized’. Also, it helps immensely to have a catcher that is good at framing, although this can skew reality as well. In 2018, Royals catcher Salvador Perez ranked 98th in catcher CSAA (framing) and 112th in framing runs out of 117 qualified catchers. Keller had his work cut out for him.
Like tunneling, there is so much more to dig into with this data but we’ll take what we have at face value. Essentially Keller has the potential to be a really good pitcher because he makes hitters create mistakes more than overpowering them. And that’s not a bad thing at all. We tend to think of pitchers who are great having total control over hitters. Pitching to contact, while much riskier, can be thought of as a method of control as well. The key here is that Keller has the promise to be much more dynamic than he was last year. Perez is very high on Keller as well, stating he believes he can be the Royals ace and places value on the movement and velocity he generates.
Tunneling prowess, impressive movement, and top-tier velocity? It’s clear Keller has the right tools. It’s up to him to bring them all together in the right way. Increasing his strikeout rate would be instrumental in lifting Keller to the next level but his ability to keep hitters off-balance helps him generate the kind of contact that limits, even prevent damage, may be enough anyway. I predict that if Keller can figure out his ideal sequences and remain liquid along with creating the proper pitch ecosystem, and even start elevating his fastball more, he can be a force this season. Of course, its easier said than done, but given his intangibles, it could be easier than we think.
(Photo by Frank Jansky/Icon Sportswire)
Lots of pitchers have success without similar release points. Its not necessarily a precursor to success as much as it is easy for a machine to track. Every new stat creates opportunities for people on the outside to capitalize on player success. I’m not sure that most pitches don’t look pretty similar out of the hand from a hitter’s perspective. Hitters pick up spin more often than not. I have a hard time buying in too hard that an inch or so in release point equates to significant hitter confusion. You know it doesn’t because lots of pitchers don’t fare well in tunneling metrics. Not to say there isn’t value to having a similar release point – but I certainly don’t think they should be focus on it. Pitchers would be better off worrying about movement and location than release point IMO. If they are lucky enough to have it, then it probably doesn’t hurt.
Like the article, gotta say I feel like his k% could jump up in a bigger sample his fastball was elite in 18
I find it interesting you have an article like this about a pitcher that isn’t even ranked in your top 100 SPs. To me it says there is little to no faith in Brad Keller
hi its pst very interesting
google https://google.com/