


Conceived in 2015 and made possible by the introduction of Statcast cameras into every MLB ballpark, Baseball Savant provides the fans with access to an unparalleled amount of data, ranging from batted ball exit velocities and launch angles to pitch spin rates and player sprint speeds.
The site also provides a range of xStats, statistics that attempt to predict a player’s batting average (xBA), slugging percentage (xSLG), and weighted on-base average (xwOBA) based on the exit velocity and launch angle of their batted balls along with their strikeouts and walks.
While Savant’s xStats do a great job of highlighting a player’s true ability, especially over smaller sample sizes, they have some fundamental limitations. For instance, Savant’s xStats treat batted balls equally regardless of the direction they were hit. For example, a ball that registers 100 mph off the bat to center produces the same xBA and xSLG as one to left with an equivalent exit velocity and launch angle.
Tom Tango recently showed that a hitter’s xStats are not biased by the overall directional tendency, also dubbed spray angle, of all of their batted balls. This makes sense, as fielders can adjust their positioning to mirror a hitter’s average spray angle, and thus there wouldn’t be any advantage gained by hitting in a specific direction.
But defensive positioning can only protect against balls that stay within the confines of the ballpark—that is, ground balls, line drives, and pop-ups. A significant amount of fly balls leave the yard for home runs, and thus their directional tendency can’t be properly neutralized by defensive placement. The spray angle of a fly ball is quite significant, as walls down the line are typically 80 feet closer to home plate than center field.
Rather than focusing on the relationship between overall spray angle and xStats, one that is clouded by the inclusion of largely irrelevant data, we should focus specifically on how fly-ball spray angle relates to xStats.
Fly-Ball Spray
Let’s go back to our hypothetical 100 mph batted ball and assume that the ball is also hit at a 25-degree launch angle, a combination that would be labeled a “Fly Ball” in Savant’s categorization system. All of the flies hit within these parameters from 2015 to 2017 are outlined in the image below:
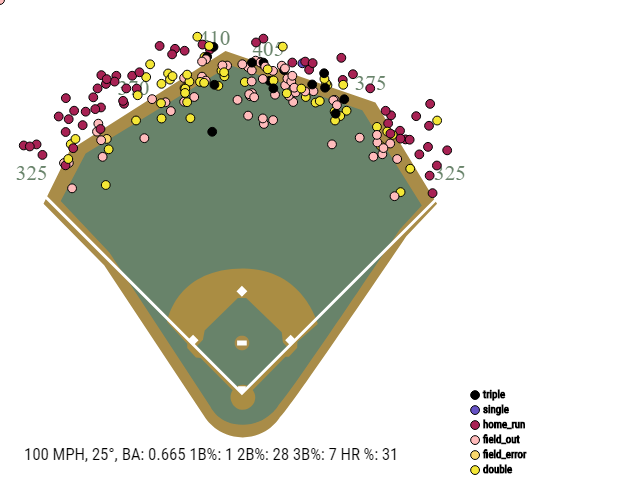
We can see that 31% of balls struck at 100 mph and 25 degrees resulted in home runs, while another 28% ended up as doubles, for an overall batting average of .665. But take a look at the dots between the 325- and 370-foot markers in left field. They’re nearly all home runs. Meanwhile, the balls hit to center are mostly field outs or doubles.
Baseball Savant calculates a .665 xBA for every ball hit at 100 mph and 25 degrees. However, it’s fairly clear that a ball to hit to center under these conditions has a substantially lower chance of clearing the wall and becoming a hit than a ball hit to center.
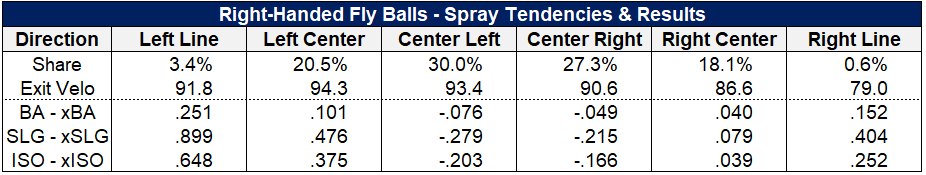
Since xStats exclude spray angle from consideration, the net result is that balls hit down the lines significantly outperform expectations. For instance, from 2016 to 2018, a fly ball down the left field line off the bat of a righty, on average, outperformed its xSLG by .899 points (1.786 SLG minus .887 xSLG). In contrast, fly balls hit to the center-left portion of the field trailed their xSLG by .279 points (.757 SLG minus 1.036 xSLG).
These results are extreme but also fairly intuitive. The walls down the left line typically range from 320 to 350 feet from home plate, while in center-left they stretch as far as 370 to 400 feet. A ball simply needs to be hit with a higher exit velocity to leave the yard to the center portion of the field, so xStats that treat a 100 mph, 25-degree ball equally across all corners of the field will overrate the quality of a ball hit to center and underrate one to the corner.
There are some other interesting findings buried in the above table. For starters, it’s clear that fly balls trend toward the center of the field, with 57.3% of balls heading to center-left or center-right. Righty batters hit the ball hardest into the “power alley” to left-center, with a 94.3 mph average exit velocity on fly balls. Meanwhile, a fly ball hit to right-center averages a mere 86.6 mph, and the few hit down the right line average a moribund 79.9 mph. Clearly, it’s inferior for hitters to hit fly balls to center, due to a greater wall distance, or to the opposite field, due to lower exit velocities.
Is It Relevant?
If most right-handed hitters converged to a similar spray angle on their fly balls, these directional issues wouldn’t matter since each hitter would be subject to the same xStats biases. However, there is a vast difference in how hitters spray their fly balls around.
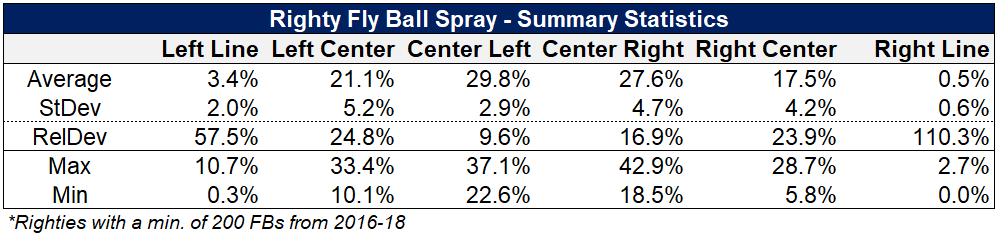
Using a sample of righty batters who hit at least 200 fly balls from 2016 to 2018, we can calculate the relative deviation, RelDev, that exists among hitters in their spray tendencies.
Balls hit down the left line have RelDev of 57.5%, while balls to left-center are at 24.8%, indicating significant differences in the direction batters hit fly balls. The one area of the field where most righty hitters are consistent in dotting the ball is to center-left, as the RelDev to this area is only 9.6%. This indicates that balls hit to center are a fairly consistent aspect of every batter’s fly-ball profile and that most of the trade-off comes between pull side and opposite field.
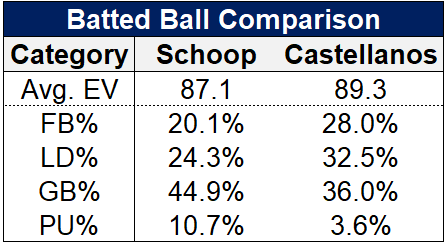
To put this in perspective, consider that current Twin and former Brewer and Oriole Jonathan Schoop led all righties with 10.7% of his fly balls going down the left field line, while Nicholas Castellanos of the Tigers trailed with a mere 0.3% (literally, one out of 324). In fact, Castellanos’ sum of fly balls to either the left line or left-center portion of the field only accounted for 10.5% of his total fly balls, the lowest total in the set, while Schoop sent 38.7% of his balls to those areas. Both players had almost identical ratios of fly balls to center-left, consistent with the lower RelDev of balls hit to this area. However, the players differed considerably on the ratios hit to center-right and right-center.

Unsurprisingly, Castellanos’ actual SLG on fly balls trailed his xSLG by a massive 192 points, while Schoop’s actual SLG was 205 points higher than his xSLG.
Based on the high RelDevs of spray angles for righty batters overall, as well as the anecdotal example of Schoop and Castellanos, it is clear that there is substantial variation in the direction that batters hit fly balls. This means that there will be a significant amount of hitters whose xStats are biased by their fly-ball spray angle—those who hit more pulled balls will be underrated by xStats, while those who send more to center and right-center will be overrated.
As a caveat, this is not to suggest that players should sell out for pulled fly balls. In fact, Schoop’s 38.7% pulled fly-ball rate is quite unnatural and likely a result of an approach that sacrifices quality contact overall. Schoop’s average exit velocity is a full two mph below Castellanos’, while his pop-up rate is nearly three times as high, and his line-drive rate is a relative 25% lower.
Castellanos is clearly the more balanced and better overall hitter. Nevertheless, he has significantly underperformed all of his xStats for four straight seasons (career .340 wOBA compared to .363 xwOBA) due to his inclination to hit fly balls to center. Meanwhile, Schoop’s career wOBA is 15 points higher than his xwOBA.
Other Outliers
For as much as Schoop loves to pull the ball, he is second to Angels third baseman Zack Cozart in fly-ball pull rate, measured as the percentage of fly balls hit to either the left line or left-center. Cozart is the poster child for selling out for pulled fly balls, with a 39.1% rate from 2016 to 2018. This approach allowed Cozart to exceed his xSLG on fly balls by 253 points over that span and his total xSLG by 83 points.
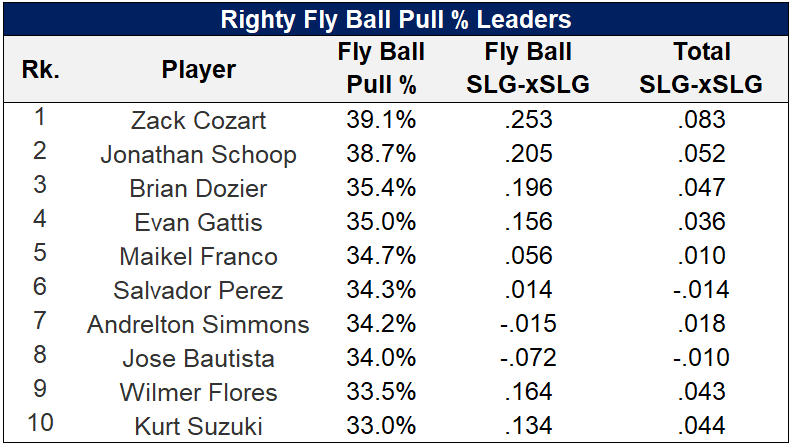
To put that in perspective, Cozart earned a .460 slugging percentage over those years, while his xSLG sat at .377. That’s the difference between above-average power at the MLB level and Dee Gordon.
Brian Dozier is another example of a player mistreated by xStats in recent years, with his 35.4% pulled fly-ball rate resulting in a 196-point overperformance on xSLG on flies and 47 points on total xSLG.
A potentially interesting trait of some of the players on the above list is that many have struggled at the plate over the last year. Could it be that, while these players identified a pulled fly-ball arbitrage opportunity for several years, pitchers have caught up to their antics and found a better way to pitch to them?
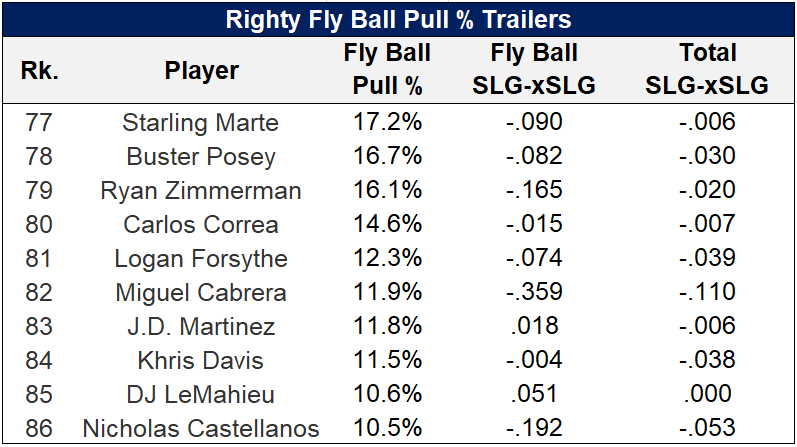
Contrary to the list of fly-ball pull leaders, which is amassed by mostly uninspiring hitters, the list of fly-ball pull laggards is comprised of some of baseball’s best, including Ryan Zimmerman, Carlos Correa, Miguel Cabrera, J.D. Martinez, Khris Davis, and the aforementioned Castellanos.
Predictably, most of these players significantly underperformed their xStats. But the case of Cabrera jumps off the page more than most. His SLG-xSLG on fly balls was an astounding -.359, while his total SLG-xSLG was -.110. Statcast viewed Cabrera as deserving of a .596 slugging percentage from 2016 to 2018, a rate that would have put him right next to Mike Trout for third in baseball over that span. However, Cabrera was only able to achieve an actual slugging percentage of .486.
Conclusions and Further Research
The correlation between fly-ball pull rate and SLG-xSLG on fly balls is 0.45, with an r2 of 0.20, indicating a strong relationship but ultimately not as high as expected given the results from the outliers on either end of the spectrum. Moreover, the fact that two of the biggest SLG-xSLG underperformers, Castellanos and Cabrera, play their home games in Comerica Park indicate that ballpark variations might be skewing the results somewhat.
However, given the significant league variations that occur in ActualStats-xStats based on spray angle, along with the strong correlation between SLG-xSLG and pull rate, as well as the myriad anecdotal examples presented above, there is enough evidence to prove that Baseball Savant’s xStats are biased by a hitter’s spray angle on fly balls.
This knowledge is useful for baseball analysts so they can tease out which players are more likely to regress to their xStats than others. Analysts should make sure to check a player’s fly-ball spray. If the player clusters flies to the pull side, it is safe to assume they will outperform their xStats, whereas if the hitter sends flies to center and the opposite field they will likely underperform.
Whether Baseball Savant should attempt to adjust for these biases is another question entirely. If they go down that route, they would likely also need to consider how specific ballparks would affect a player’s xStats as well.
I think a more nuanced version of xStats, inclusive of spray angle and ballpark, would be a welcome addition to the statistical tool kit. However, the agnostic version of xStats will always serve a purpose and should be preserved, with the caveat that it isn’t a perfect mirror of reality.
Featured Image by Justin Paradis (@freshmeatcomm on Twitter)
I can’t state this enough: this is fantastic work.
Great stuff Nick! Love this. Will start incorporating fly ball+pull rate to my analysis of Statcast xstats