


Things have been new for me lately. I started a new job. Moved to a new apartment. And more importantly, we have a new world champion. Yes, the Washington Nationals brought the Commissioner’s Trophy to Washington for the first time in 95 years. As a Yankee fan, I was mostly delighted to see the Houston Astros lose. Hopefully, however, I don’t lose Astros fans after this first paragraph.
The end of the World Series also leads to a new season, which means taking a step back, gaining a fresh perspective, and a new way to look at data. As anyone who reads my column knows, I love to peruse the Statcast leaderboards. Earlier this year, I researched the predictive value of various power metrics developed by Baseball Savant. That led to the inexorable conclusion that barrels were far more predictive of both HR/FB% and ISO than any other power metric, including exit velocity, exit velocity on flies and liners, hard-hit rate, average launch angle, and FanGraphs’s Hard%.
But no measure is perfect. A brief preview of the Statcast exit velocity & barrels leaderboard reveals that certain players overperform or underperform their barrel rates in terms of home runs. For example, with 41 homers, Alex Bregman vastly outperformed his 5.4 barrels per batted ball event rate, which was good for only 276th best in MLB among hitters with 100+ batted ball events.
But Bregman’s not alone. For instance, Cincinnati’s Aristedes Aquino hit 19 home runs on just 20 barrels. And many of these guys play for the same teams. Noticing patterns in the leaderboard, I set out to determine who benefited the most from their ballparks. I wanted to figure out park factors based on barrels. My goal was to discover which ballparks inflated or depressed home run totals vis-à-vis the barrels hit in those venues.
Barrels as a Yardstick
Using barrels as a jumping-off point to determine park factors was obvious enough based on my previous work, but one should never assume anything. Out of an abundance of caution, then, I did some additional work.
For context, a barrel is a ball hit between 26 and 30 degrees at least 98 mph. For each additional mph above 98, the launch angle band expands. A batted ball event (BBE) is just a ball put into the field of play with a result, such as a hit, out, or error.
I chose a sample of all players with a minimum of 100 batted ball events in 2019. I then used their batted ball event, barrel, and home run totals to discern the league-wide relationship between HR/BBE and Brls/BBE in order to see the impact of barrels on home runs.
I selected home runs and not slugging percentage, ISO, or other broader power metrics because I’m personally interested in the power of using a hitter’s barrels to predict home runs—a standard category in traditional 5×5 leagues. Another reason is the increasing importance of home run hitting in today’s game, which accounted for more runs scored this season than any before. I further used batted ball events rather than plate appearances as the denominator because barrels and home runs are both batted ball events, allowing me to decrease the denominator because I’m uninterested in the effect of strikeouts, walks, or other plate appearance results that have no bearing on the ball once it’s in play.
Suffice it to say, here’s what I found:
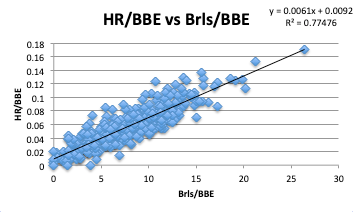
As you can see, there’s a strong relationship between barrels and home runs. Out of all batted ball events, barrels explained 77.48% of the variance in hitters’ home runs in 2019. With the comfort of knowing that barrels are a powerful measure for determining home runs, it’s time to apply them to ballparks.
Park Factors by Barrels
Better writers than I have attempted to answer the question of the impact of the various ballparks on the game. For example, The Athletic’s Eno Sarris derived park factors from Andrew Perpetua’s High Drive metric. He upended traditional notions of park factors by asserting that Dodger Stadium and Oriole Park were the best places for home runs. However, in my view, that calculation was limited by the fact that high drives are now defunct, and they only resulted in home runs 37% of the time when they were in use. In that way, the vast majority of home runs were not high drives in the first instance, limiting their predictive value for home runs. I do not mean to critique of one of my favorite baseball writers; rather, I simply offer a different perspective on park factors for fantasy baseball players.
This season, there were 9,290 barrels. Of those, 5,536 resulted in home runs. That figure represents 81.71% of all home runs this season, as there were also 1,240 home runs produced on non-barreled balls. Notwithstanding this, 5,536 home runs on 9,290 barrels is good for a .5959 home run per barrel rate.
These figures speak volumes. Most (59.59%) barrels generate home runs. And most (81.71%) home runs were the product of barrels as well. It is no surprise, then, that as explained above, barrels are highly predictive of home run hitting.
With that said, how did different ballparks fare in terms of home runs per barrel this season?
| Ballpark | HR | Brl | HR/Brl% | Park Factor | Rating |
| Fenway Park | 151 | 339 | 44.54% | -1.83 | Solid P |
| Oracle Park | 133 | 295 | 45.08% | -1.76 | Solid P |
| Comerica Park | 160 | 350 | 45.71% | -1.69 | Solid P |
| Kaufmann Stadium | 140 | 303 | 46.20% | -1.63 | Solid P |
| Tropicana Field | 150 | 298 | 50.34% | -1.13 | Likely P |
| Target Field | 198 | 386 | 51.30% | -1.01 | Likely P |
| Marlins Park | 145 | 274 | 52.92% | -0.81 | Lean P |
| Chase Field | 173 | 319 | 54.23% | -0.65 | Lean P |
| PNC Park | 157 | 278 | 56.47% | -0.38 | Toss-Up |
| Nationals Park | 199 | 348 | 57.18% | -0.29 | Toss-Up |
| Busch Stadium | 162 | 282 | 57.45% | -0.26 | Toss-Up |
| Wrigley Field | 174 | 299 | 58.19% | -0.17 | Toss-Up |
| Oakland Coliseum | 180 | 309 | 58.25% | -0.16 | Toss-Up |
| MLB Average | 5,536 | 9,290 | 59.59% | 0.00 | N/A |
| Progressive Field | 172 | 287 | 59.93% | 0.04 | Toss-Up |
| Rogers Centre | 208 | 345 | 60.29% | 0.09 | Toss-Up |
| SunTrust Park | 204 | 335 | 60.90% | 0.16 | Toss-Up |
| Yankee Stadium | 198 | 320 | 61.88% | 0.28 | Toss-Up |
| T-Mobile Park | 203 | 324 | 62.65% | 0.37 | Toss-Up |
| Petco Park | 175 | 278 | 62.95% | 0.41 | Lean H |
| Coors Field | 213 | 338 | 63.02% | 0.42 | Lean H |
| Citizens Bank Park | 203 | 321 | 63.24% | 0.45 | Lean H |
| Globe Life Park | 204 | 319 | 63.95% | 0.53 | Lean H |
| Guaranteed Rate Field | 198 | 307 | 64.50% | 0.60 | Lean H |
| Minute Maid Park | 183 | 268 | 68.28% | 1.06 | Likely H |
| Angel Stadium | 211 | 308 | 68.51% | 1.09 | Likely H |
| Citi Field | 186 | 270 | 68.89% | 1.13 | Likely H |
| Miller Park | 206 | 297 | 69.36% | 1.19 | Likely H |
| Oriole Park | 237 | 338 | 70.12% | 1.28 | Solid H |
| Dodger Stadium | 202 | 284 | 71.13% | 1.41 | Solid H |
| Great American Ball Park | 168 | 226 | 74.34% | 1.80 | Solid H |
I have three disclaimers before diving into observations. First, I could have gone back a few years to generate a larger sample of barrels. But the ball has been jumping off the bat at an accelerated rate in recent years←particularly in 2019—and I didn’t want my park factors to be skewed by a different ball. Additionally, the parks have changed over time. The Atlanta Braves moved to Suntrust Park in 2017. The Los Angeles Angels lowered their right-field wall in 2018. The Arizona Diamondbacks installed a humidor in 2018. I acknowledge that using just one year of data will be accompanied by more noise. But I also believe the best approximation of the effect different venues will have on home runs next year would come from using the most recent sample of barrels.
Second, I should explain the derivation of my park factors, which are z-scores. A z-score shows the relationship to the mean of a group of values, measured in terms of standard deviations—degrees of spread—from the mean. Where a z-score is 0, the value is equivalent to the mean in the sample. Where a z-score is 1.0, the value is one standard deviation from the mean. Here, the mean is the MLB HR/Brl rate: 59.59%. Additionally, I borrowed ratings from Cook Political Report’s ratings because the parks fit nicely into tiers and I figured it would be helpful, if not also fun, to conceptualize them in that way. A toss-up is a venue that is so close to the mean that, due to noise in the data, could shift from a park that slightly favors hitters to one that slightly favors pitchers or vice versa next season. The others are self-explanatory.
Third, certain hitters will outperform their home park factors due to their ability to hit non-barreled home runs, which is beyond the scope of this article. As an example, a righty like Bregman or teammate Yuli Gurriel is far more likely to hit a home run in Minute Maid Park than anywhere else in baseball by pulling a non-barreled ball down the left-field line and into the Crawford Boxes. A quick search revealed both to be in the top 15 in MLB in pulled fly balls. Bregman ranked second with 59 and Gurriel tied for 14th with 43. And, if you actually look at total home runs hit in each park relative to total barrels, Houston’s Minute Maid Park jumps up to the most hitter-friendly, with more home runs hit there than barrels because there were so many non-barreled home runs. Yankee Stadium jumps up as well, with Fenway and Kauffman swapping places on the list, among other changes. It’s worth keeping in mind, but is not relevant for determining those venues that are more or less likely to convert a hitter’s barreled balls into home runs. I’ll reiterate that we’re limiting these park factors to barreled balls because they’re highly predictive of home runs.
Discussion
As to the actual results, Eno appeared to be correct that Dodger Stadium and Oriole Park are quite hitter-friendly. However, his metric found Minute Maid Park to be a league-average park. Whereas my park factors suggest Minute Maid Park is a full standard deviation away from league average, with many more barreled balls resulting in home runs there than in most other venues.
You’re far more likely to get a home run in Great American Ballpark from a barrel than anywhere else in MLB. In other words, when hitters create the best combinations of exit velocity and launch angle, they ordinarily earn a home run on 59.59% of the time. But in GABP, the difference is stark. At a 74.34% clip, hitters are 24.69% more likely to hit a home run there for every barrel than on average.
So maybe Cincinnati Reds slugger Eugenio Suárez can keep it up. Suárez mashed 21 of his 49 homers in GABP. But he did so on just 26 barrels, good for an 80.77% HR/Brl rate. Those are far better results than league average and are likely explained, at least in part, by his home venue. Indeed, GABP was nearly two standard deviations above the mean in terms of producing home runs on barrels.
Another surprising result was discovering Citi Field and Angel Stadium were two of the better parks for hitting home runs—over a standard deviation greater than the MLB average. In fact, 68.89% and 68.59% of barrels resulted in home runs in those parks, respectively, nearly ten points higher than the league average. I classified them as likely hitters’ parks accordingly. The rubber truly met the road with rookie sensation Pete Alonso, who hit 23 of his 53 homers at home on just 26 barrels. That’s a well-above-average 88.46 HR/Brl rate. Even more extreme was Tommy La Stella, who barreled the ball nine times at Angel Stadium and hit a home run each and every time.
Likewise, my park factors challenge traditional notions of hitters’ and pitchers’ parks. Look no further than Coors Field or Yankee Stadium, long considered to be hitters’ parks. But in 2019 they were nearly league average, only leaning slightly toward favoring hitters. Put differently, hitters were able to convert barrels at those parks at only a slightly greater clip—63.02% and 61.88%, respectively—than league average. As noted above, Yankee Stadium looks more hitter-friendly when including all of those non-barreled home runs to the short porch in right field. But when actually barreling the ball, hitters fared only slightly better than average.
On the opposite end of the spectrum lie Fenway and Oracle Parks. The effect of Fenway was so extreme that its deviation from the mean mirrored GABP. Have you wondered why Red Sox star Andrew Benintendi was such a bust this season? Perhaps the reason is his 22 barrels at home produced only six home runs, a terrible 27.27% rate. One can only imagine the results he could have had calling another ballpark home. Some of his compatriots did not fare better, including J.D. Martinez, who managed only 15 home runs on his 30 barrels at Fenway. I found these results to be particularly surprising given that, in the back of my mind, I always considered Fenway to be a pitchers’ park.
By the same token, don’t expect significantly better results from Buster Posey, Brandon Belt, or even Mike Yastrzemski anytime soon. Posey haplessly converted only one of his seven barrels at Oracle into a home run, while Belt more impressively barreled the ball 20 times, with just three homers to boot. Yastrzemski performed slightly better, but still managed just 6 home runs on his 11 barrels. Of course, they all hit some non-barreled home runs at Oracle Park, but when they put the best combinations of exit velocity and launch angle together, they were not rewarded.
Another interesting result was learning Oakland Coliseum was a largely neutral venue. Long considered a pitchers’ haven given its vast confines, barrels flew out of the park at basically a league-average clip in 2019. Now, of course, it’s possible some of these results are skewed by the quality of the barrels hit in these parks. Indeed, if every hitter that entered the Coliseum were like Aaron Judge or Joey Gallo and smacked his barrels particularly hard—remember, not all barrels are created equal—then it’s possible the park isn’t inflating the rate at which barrels are converted into home runs, but rather, the players are influencing the results. I suspect this is possible with the Coliseum. A larger sample size than just 2019 barrels and home runs would mitigate some of this noise, but it will be fun to revisit this article next season to see whether the Coliseum remains a toss-up park.
Finally, I wanted to highlight Chase Field. It’s truly unfortunate that Zack Greinke moved from Arizona, a lean pitchers’ park, to Houston, a likely hitters’ park. Moreover, it appears the move for Zac Gallen from Marlins Park to Arizona may have little impact on his ratios. But more broadly, it’s interesting that Chase Field has gone from what was once considered to be a hitters’ park given the heat and thin air in Arizona, to a pitchers’ park. This is likely the result of the venue’s new humidor, designed to absorb moisture and make the baseballs weightier when they leave the bat.
Conclusion
These are just my initial observations, but I think it’s helpful to keep context in mind when evaluating a player. For example, while I do not expect La Stella to convert all of his barrels into home runs at Angel Stadium, he could continue to outperform expectations in 2020 so long as he wears an Angels uniform. Likewise, while Benintendi may hit more homers on his barrels next season, he may never hit as many as players with similar power peripherals simply because he plays at Fenway Park.
I encourage you to use this data to draw your own conclusions when evaluating players in drafts this season and not to worry too much about mine. To the extent you look at a player’s barrel rate and say, gee, he’ll definitely hit more or fewer home runs next season, I urge you to take a quick peek at these park factors first. Context is key after all.
Featured Image by Justin Paradis (@freshmeatcomm on Twitter)
Excellent work. Thank you.
Thank you! And thanks for reading :)
A favorable home run park is not necessarily a hitter’s park. A venue can boost homers but suppress runs, and vice versa.
ToddZ= Todd Zola?
I completely agree. Saying pitchers or hitters’ park is a bit of a misnomer. These “park factors” are meant to apply to fantasy baseball and the analysis of home run hitting only. Thanks for reading!
Yes, it’s me.
Fantasy or not, you explicitly rate parks as hitting or pitching. That’s not a misnomer, that’s a mistake.
That’s a bit harsh and laser-focused on the labels rather than the substance.
I also explicitly stated:
-My goal was to discover which ballparks inflated or depressed home run totals vis-à-vis the barrels hit in those venues
-I selected home runs and not slugging percentage, ISO, or other broader power metrics because I’m personally interested in the power of using a hitter’s barrels to predict home runs—a standard category in traditional 5×5 leagues
Besides, the entire article explains my methodology, which clearly ranked parks based on HR/Brl%. And then the discussion highlights hitters who have underperformed or overperformed their barrel rates relative to their *home run* totals. Actually reading the substance of the article leaves no doubt that these “park factors” are intended to apply to home runs only. They are not broader indictments of the run-scoring environments of each park nor intended to mislead…
You may not have intended to mislead, but I’m sorry, you did. The terms hitters and pitchers parks have specific meanings, ingrained in the lexicon. When these terms are used, they connote run-scoring tendencies. The point of the piece is certainly clear. However, referring to venues as hitting or pitching as related to homers is most certainly confusing, especially since there is a common misconception that home run parks and hitter’s parks are mutually exclusive. It can easily be inferred in the discussion Fenway Park is good for pitchers while Coors Field isn’t as bad for pitchers as perceived. Fenway suppresses homers, but it’s one of the best hitting venues in the league for runs. Since the introduction of the humidor, Coors home run tendencies are much lowers than many realize, but it’s by far tops for runs. I understand your intent was focusing on home run factors, but again, the terms hitting and pitching parks trigger specific interpretations, irrespective of what was meant.
Lol OK i yield. The use of the term hitters and pitchers parks, halfway down the article, misled lesser minds who chose not to read the majority of the article, including the derivation of the metric and the discussion of its application, which is exclusively based on home runs. If that wasn’t clear, i hope readers read these comments.
Very interesting, great work! Did you get the granular data you used for the park factor analysis from statcast or is that something you guys pay for?
Thanks! Yup, Statcast
Very interesting read – thanks for the work. However, using your method, you are essentially taking the “lucky” HRs out of the park factors – which seems to be a bit on the over analyzing side to me, since the lucky HRs count just the same in fantasy. To me, it is probably more useful just to keep the lucky HRs in there when evaluating a park for fantasy HR purposes as of course certain parks will better assist/suppress those as well. Very fun read though.