


Another year, another New Year’s resolution. What’s mine? Using metrics properly instead of simply dropping them into my articles. One thing that bothers me is statements such as “his average will come down, look at that high BABIP!”
Of course, I’m guilty of this too. But that’s why we have New Year’s resolutions, right? My first endeavor was to figure out what really goes into BABIP and when you can use it comfortably to predict batting average. If you’re not familiar with BABIP, it refers to batting average on balls in play, or the percentage of balls hit into play that actually result in hits. Therefore, it does not include plate appearances that result in home runs, strikeouts, walks, hit batsmen, catcher interference, or sacrifice bunts.
Why does BABIP go up or down? How much of a hitter’s BABIP is luck, and how much is skill? Can we always comfortably look at a player’s BABIP to determine whether his batting average will change?
To answer these questions, I looked at the data for all qualifying players going back to 2014 and regressed certain metrics against BABIP to determine correlation. For xStats specifically, I went back to 2015 because of the absence of data before that season. The closer an R-squared value was to 1, the higher the correlation between BABIP and that metric.
Hard Contact Rate
This one I debunked a month ago. The R-squared between hard contact and BABIP was 0.0007. It was low for soft contact too. However, one reader raised a reasonable question: What if I were to isolate players with similar batted-ball stats (e.g., GB% and FB%) and determine whether their hard contact rates correlated better to BABIP?
It’s plausible that players who hit the ball really hard often hit a lot of fly balls, for example, and consequently maintain low BABIPs despite high hard contact rates. So looking at how hard contact impacts BABIP among players who hit similar amounts of ground balls and fly balls might be more representative of its true effect.
| GB/FB | Hard Contact% R-squared with BABIP |
| GB/FB > 1.5 | 0.04698 |
| 1 < GB/FB < 1.5 | 0.02258 |
| GB/FB < 1 | 0.03777 |
It turns out that looking at players with similarly situated batted ball profiles helps a little but not much. Broadly speaking, for all three of these categories, as hard contact went up, so did BABIP. Still, the highest R-squared was 0.04698, and it was for players who hit significantly more ground balls than fly balls. In other words, 4.698% of the variance in that sample’s BABIPs is explained by the players’ hard contact rates. That’s a little better than nothing but still very low, and I stand by my conclusion from my previous article, which cautioned against using hard contact rate to predict increases or decreases in BABIP.
Verdict: Hard contact rate is not useful for understanding BABIP, even controlling for batted ball type.
Batted Ball Statistics
Next, I wanted to determine the effect of batted-ball type on BABIP. In my previous article, I presented every graph I made to show the trend line and correlation between hard or soft contact rates and another metric. This time, I’ll cut to the chase with a succinct table because I ran several more regressions than last time, and frankly, we’d be here all day if I gave you all of them.
| Batted Ball Metric | R-squared with BABIP |
| LD% | 0.18803 |
| GB% | 0.07961 |
| FB% | 0.20872 |
| IFFB% | 0.13658 |
| GB/FB | 0.13343 |
First, what’s lost in this table is the direction the metrics move with BABIP. Unsurprisingly, BABIP improves as LD%, GB%, and GB/FB increase, and BABIP decreases as FB% and IFFB% increase. Again, to understand how this works, think of LD% as explaining 18.8% of the variance in BABIP. By way of comparison, hard contact rate explained 44.1% of the variance in home runs from 2014-18, which was statistically more significant than the relationship between any of these batted ball metrics and BABIP.
Even still, there are interesting things to note here. It’s true that line drives and ground balls are good types of batted balls for BABIP, as BABIP generally increases when they become more prevalent in a hitter’s batted ball mix. Yet FB% and LD% have more than double the impact on BABIP than GB%. In other words, hitting more fly balls is likely to hurt a hitter’s BABIP more than twice as much as hitting more ground balls would help it. And hitting more line drives is more than twice as helpful to a hitter’s BABIP than hitting more ground balls.
That said, LD% takes much longer to stabilize than GB% and FB%. The stabilization point for LD% is about 600 balls in play, whereas the same point for GB% and FB% is 80 balls in play. In other words, after 80 balls in play, there is more signal than noise in a hitter’s GB% and FB% — or deviations from the mean are more likely to be meaningful than not — and you can be confident that those marks represent more of the hitter’s true skill than luck. However, this also means that a midseason LD% will be more likely the result of luck than skill.
That doesn’t make LD% useless, however. For instance, say you’re looking at a hitter’s .350 BABIP after 100 PAs and he has otherwise normal stats. If his LD% is extremely elevated at, say, 26%, you can expect that’s driving his BABIP and is more likely because of random luck than skill. Simply put, his BABIP is likely to eventually regress to the mean after his LD% does too.
Relatedly, though infield fly balls make up a tiny portion of a hitter’s overall batted ball profile (IFFB% is just the percentage of a hitter’s fly balls that are pop-ups), they have an outsized impact on BABIP with an R-squared of 0.13658. The reason? If a batter hit 100% infield fly balls, he’d probably have a BABIP close to 0, whereas other types of batted balls are less likely to definitively result in a hit or an out. Like GB% and FB%, IFFB% also stabilizes within a single season.
Take Kevin Pillar, for instance. In 2018, he had an otherwise healthy batted ball profile: 26.6 LD%, 35.6 GB%, and 37.8 FB%. His Pull% wasn’t abnormally elevated at 40.7%, and he’s a righty anyway, so his BABIP wasn’t that susceptible to the shift (more on that later). He’s quick too, as he stole 14 bases and likely had no problem inflating his BABIP by legging out a grounder or two. Despite all of this, his BABIP was a below-average .281 because his IFFB% was a whopping 17.7%.
Verdict: Batted-ball data helpfully shows whether a hitter has been making good types of contact to sustain an elevated BABIP or bad types of contact for a depressed BABIP.
Pull%
Intuitively, it makes sense that the frequency with which a hitter pulls the ball impacts how often he reaches base. If he’s predictably pulling the ball, defenses will shift, and he’s more likely to get out. Therefore, Pull% and BABIP share an R-squared value of 0.19293. Pulling the ball has a significant effect on a player’s BABIP and should be considered when looking to see if his BABIP is likely to stay constant or regress.
Beyond this, I was interested in understanding how Pull% impacts BABIP differently for lefties and righties. Pull% is a nice way to evaluate a player’s BABIP because it only takes about 30 balls in play to stabilize.
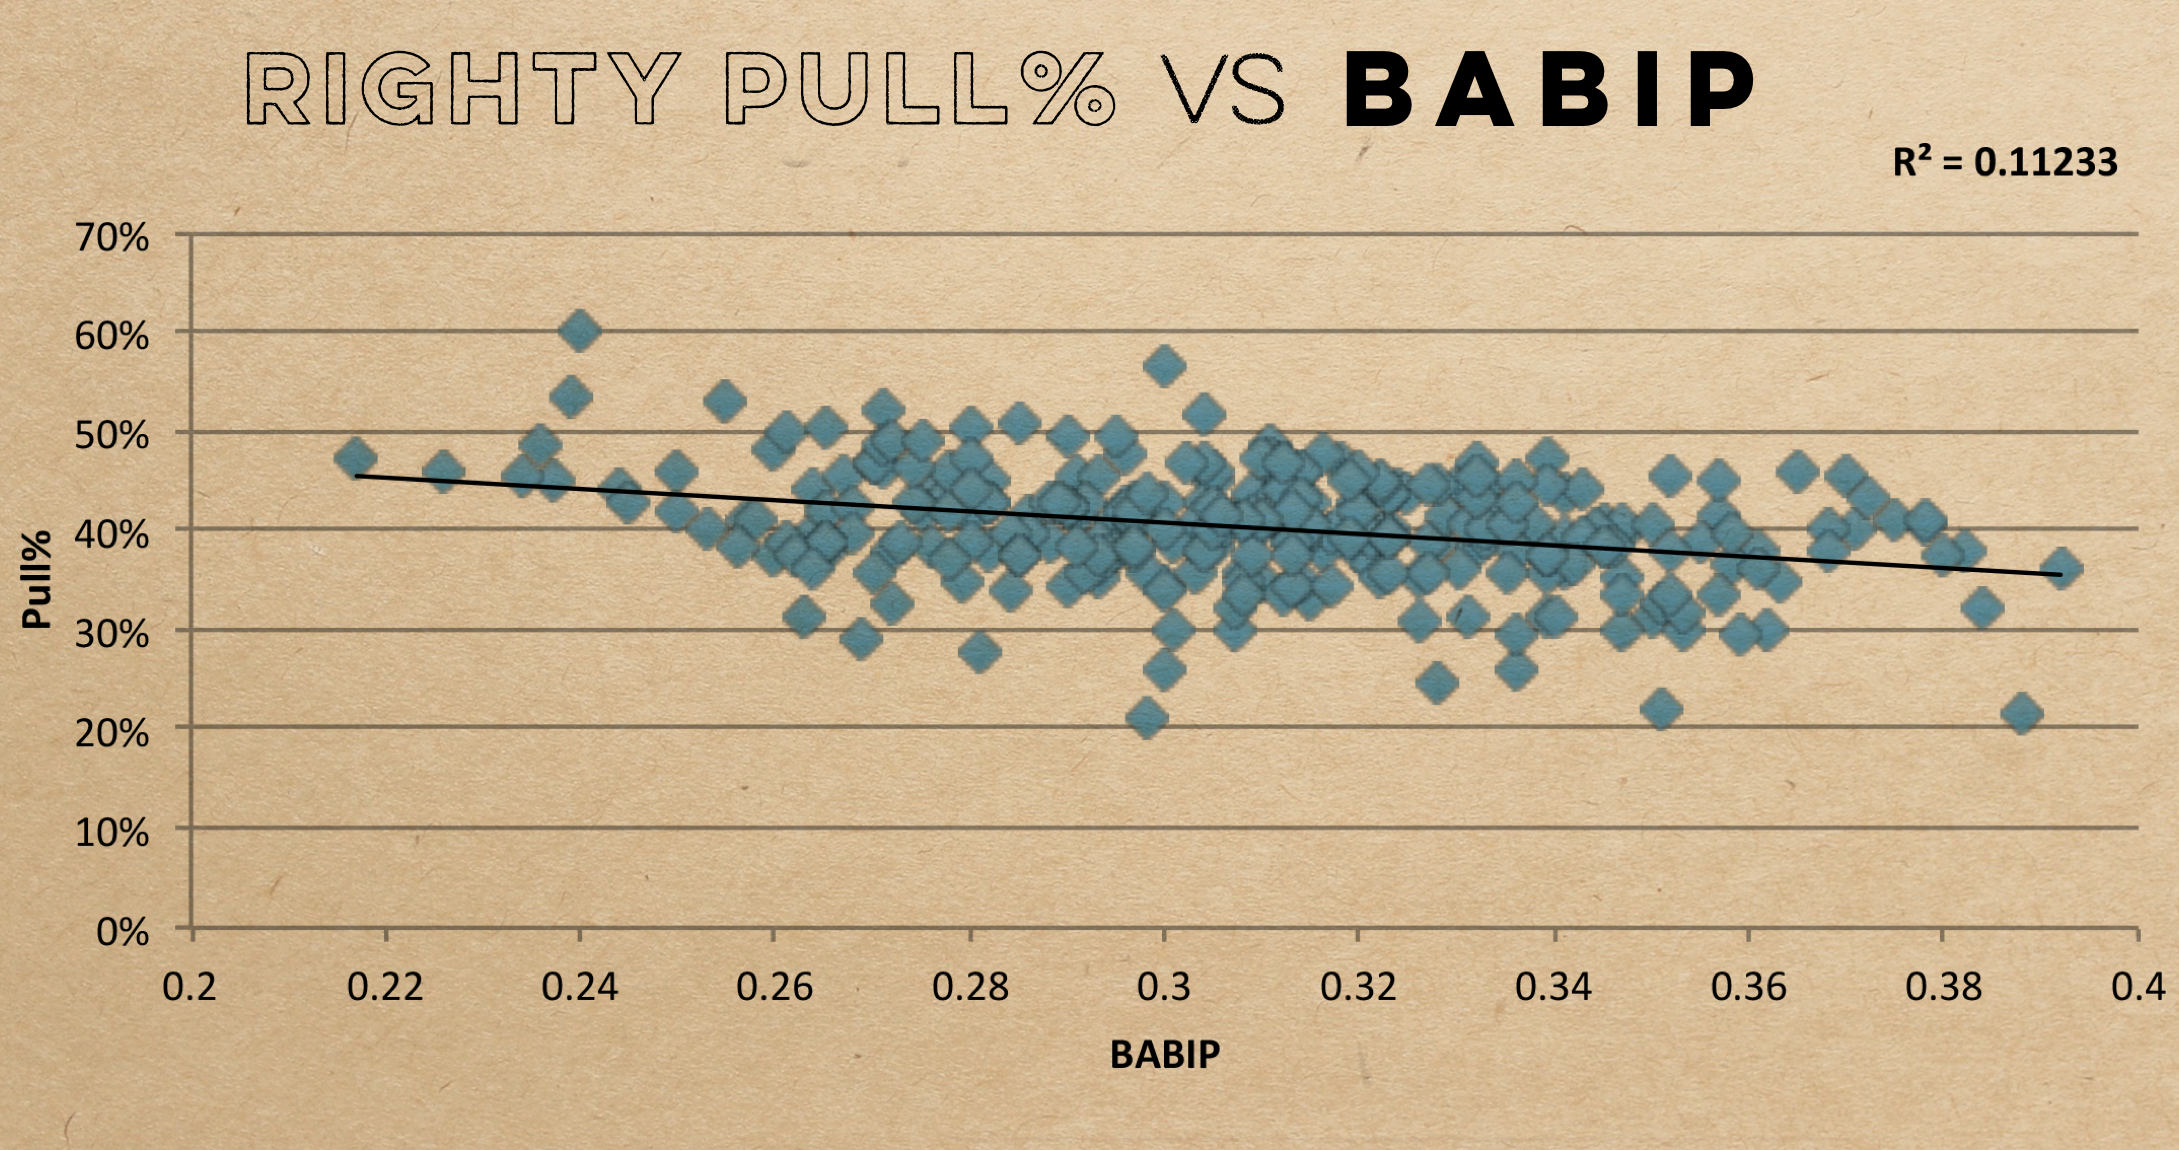
On the one hand, when righties pull the ball into the shift, they’re hitting to the traditional shortstop and third base positions. The throw is long from the left side of the infield, so the wind up is exaggerated, the ball travels a while, and there are imperfect throws. As a result, pulling the ball is not detrimental to a righty’s BABIP as he still has time to reach base, and the correlation between BABIP and Pull% is much lower for righties than the overall R-squared for BABIP and Pull% (which includes lefties and switch hitters).
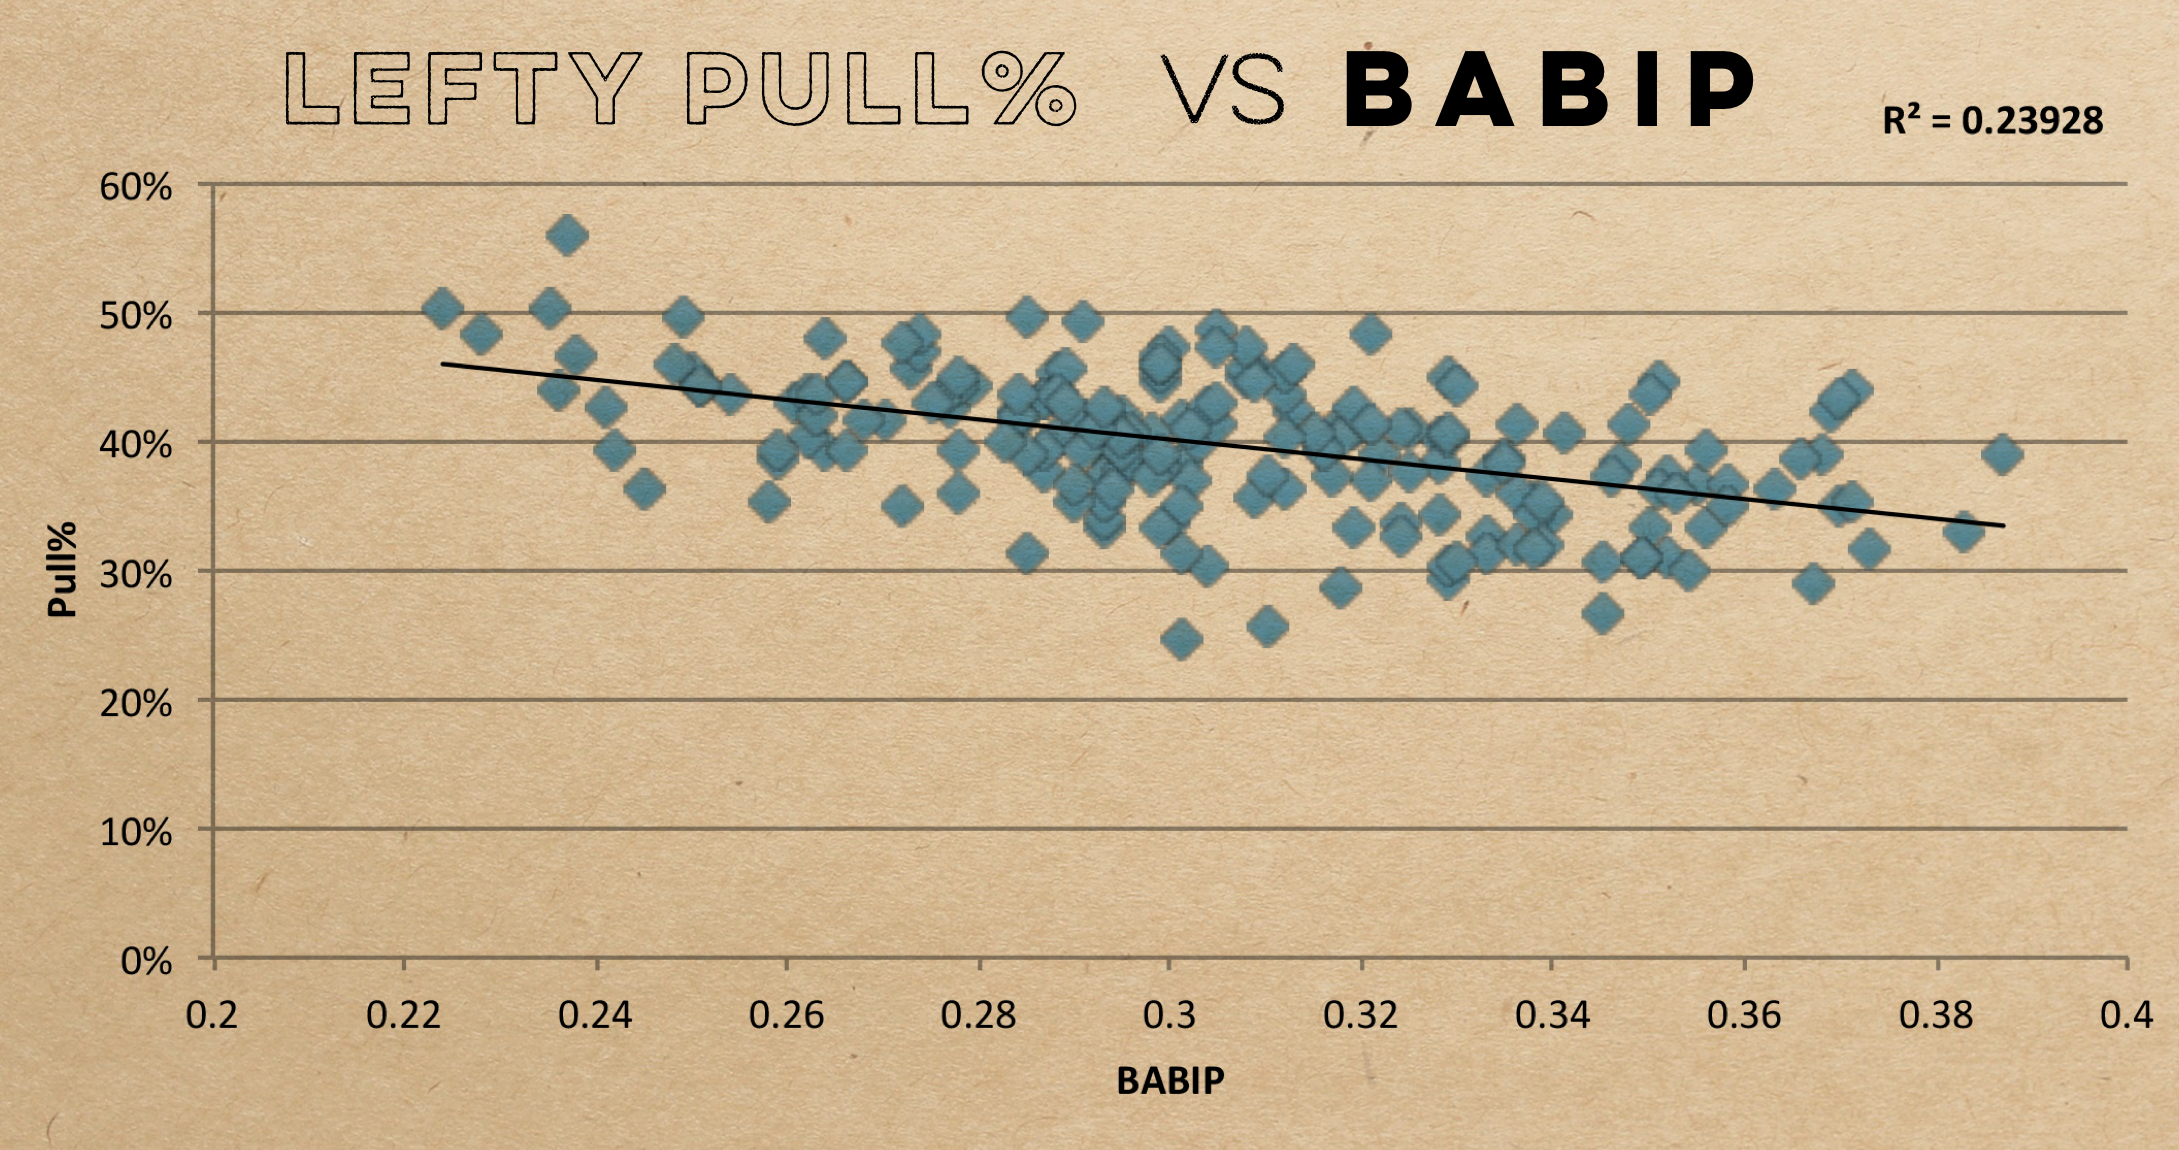
On the other hand, when lefties pull the ball into the shift, they’re hitting to the traditional first and second base positions. The throw is shorter, so the wind up takes less time, the ball travels a shorter distance, and the throws are more accurate. Sometimes, the first baseman can even just grab a grounder and touch the bag at first. Consequently for lefties, the effect size of pulling the ball on BABIP is much higher.
In general, then, Pull% is worth looking at more for lefties than for righties in determining whether a player has earned his BABIP. Sorry Scott Boras, but so long as the shift is around, pull-heavy lefties are going to have BABIP problems year in and year out.
Verdict: Pull% is useful for evaluating a player’s BABIP and about twice as telling for lefties as it is for righties.
xStats
If you’re not familiar with Andrew Perpetua’s xStats.org, I highly recommend you become acquainted with it. As you’ll see, some of his metrics are more highly correlated with BABIP than the batted-ball data on Fangraphs. Andrew uses Statcast data — vertical and horizontal launch angles, exit velocities, batted-ball distances, game-time temperature, and ballpark — to make “objective observations of the game.” With this in mind, let’s see how some of his metrics correlate to BABIP:
| xStat | R-squared with BABIP |
| Ground Ball% | 0.08113 |
| Dribble Ball% | 0.02929 |
| Fly Ball% | 0.0282 |
| Exit Velocity | 0.00305 |
| High Drive% | 0.00149 |
| Value Hit% | 0.00035 |
Let’s break it down bottom-up starting with these six metrics that were not particularly significant. Value hits and high drives are weakly correlated to BABIP because they more often than not result in home runs, which are not included in BABIP. Exit velocity also barely influences BABIP, probably for the same reasons that hard contact rate is not predictive of BABIP.
Next, Perpetua’s fly ball metric is significantly less influential over BABIP than Fangraphs’. The reason is likely twofold: First, unlike FB% on Fangraphs, these fly balls only make up about 10% of all xStats batted balls; and second, these can become hits when they’re struck down the line or outs when they’re not as opposed to fly balls on Fangraphs, which inversely correlate to BABIP because they are usually either easy outs or home runs.
Similarly, dribble balls probably don’t correlate strongly with BABIP because they can become hits for quicker players and outs for slower players, and some of them are easy plays while others are difficult. Additionally, the R-squared for xStats’ ground ball rate is almost identical to Fangraphs’ (0.07961), which doesn’t tell us much more than we already know.
| xStat | R-squared with BABIP | Average |
| Pop Up% | 0.30038 | 17.48% |
| Low Drive% | 0.28625 | 17.15% |
| Poor Hit% | 0.18593 | 26.40% |
| Launch Angle | 0.14332 | 11.87° |
With those out of the way, we can get to the fun stuff. This time, I included the 2015-18 average for qualified hitters for each metric. The reason is that these are the metrics that actually matter for BABIP, so you’re going to want to compare a hitter’s PU%, for example, with the average to determine whether it’s depressed or elevated and whether a BABIP may consequently change.
Generally speaking, as a hitter’s launch angle goes down, his BABIP goes up because between ground balls, line drives, and fly balls, the latter has the highest launch angle and is the least likely to result in a hit. I’d caution against generalizing, however, because there is a sweet spot (10-25 degrees) for launch angles that create line drives and therefore hits. If a batter lowers his launch angle too much, he’ll miss that range altogether and start hitting ground balls, so a lower launch angle isn’t necessarily ideal.
If you’re wondering why poor hits better correlate to BABIP than dribblers, it’s because the batting average on poor hits is about .013 each year, creating a strong inverse correlation with BABIP, while dribblers produce a 10-fold increase in average (approximately .130). Looking at a player’s PH% is also a much better way to contextualize BABIP than soft contact, which only retains an R-squared with BABIP of 0.02756. PH% also has a decent .516 year-to-year correlation.
Low drive rate is similar to line drive rate for our purposes. Of the metrics we’ve discussed thus far, it has the highest correlation to BABIP. This is not surprising given that the batting average on low drives is about .760. More low drives means more hits. However, according to Perpetua, low drive rate takes 2,129 PAs to stabilize. As explained above, until that point, a hitter’s low drive rate is more likely attributed to random chance than skill. Therefore, until 2,129 PAs, if a hitter’s BABIP is elevated and low drive rate is the culprit, his BABIP is likely to regress.
Finally, we have pop up rate. PU% has the highest correlation with BABIP for two reasons. First, like PH%, PU% results in an extremely low batting average of about .023 per year. Thus, as PH% goes up, BABIP drops precipitously. Second, you should not confuse PU% with IFFB% because PU% represents a significantly greater share of total batted balls (17%). And perhaps most importantly, Perpetua has indicated that PU% stabilizes after only 250 PAs.
Verdict: Several xStats correlate more strongly to BABIP than traditional metrics and should be considered alongside other data to evaluate BABIP.
Sprint Speed
Last but not least, we have sprint speed. Often, fantasy baseball enthusiasts assume speedy guys will maintain higher BABIPs. Intuitively, that makes sense because they can beat out grounders. But how accurate is that assumption?
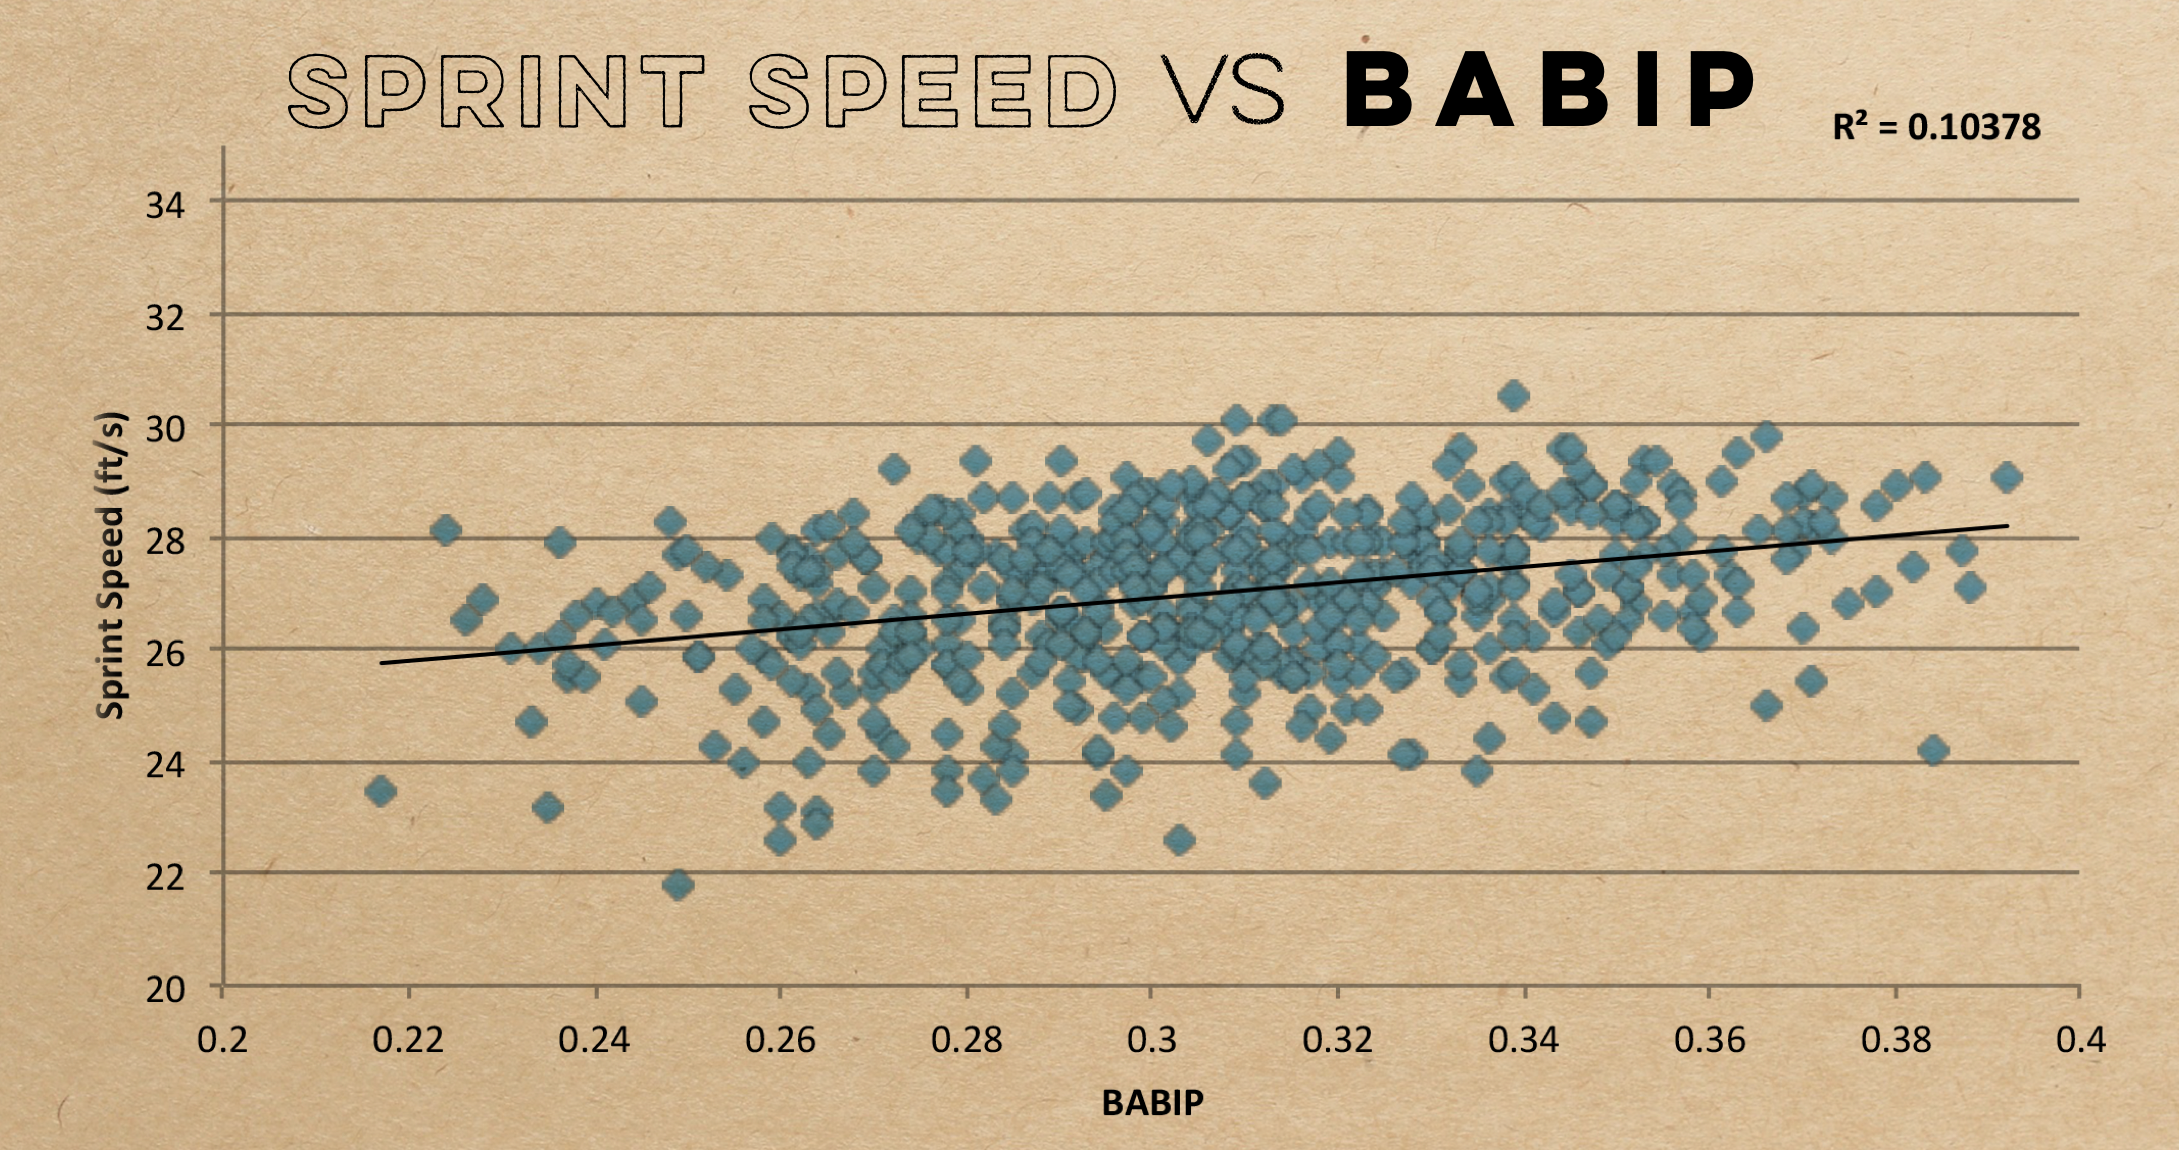
With a little help from Colin Charles, I was able to obtain the sprint speed data from Baseball Savant and run it against qualified hitters’ BABIP. For context, sprint speed is probably the best speed-related metric to evaluate a hitter’s BABIP because BABIP measures how often a hitter turns a ball in play into a hit by reaching first, and Baseball Savant measures sprint speed specifically as a player’s peak burst speed on his way to first base in high-leverage situations (i.e., his ability to turn a ball in play into a hit when it matters most). Unfortunately, sprint speed’s 0.10378 correlation with BABIP, while not insignificant, is likely not as strong as most would expect.
Verdict: While there’s some correlation, sprint speed is less influential over BABIP than most batted ball data, Pull% (for both righties and lefties), and four xStats.
Conclusion
In sum, we are left with the following relevant metrics:
| Metric | R-squared with BABIP |
| Pop Up% | 0.30038 |
| Low Drive% | 0.28625 |
| Pull% (Lefties) | 0.23928 |
| FB% | 0.20872 |
| LD% | 0.18803 |
| PH% | 0.18593 |
| Launch Angle | 0.14332 |
| IFFB% | 0.13658 |
| GB/FB | 0.13343 |
| Pull% (Righties) | 0.11233 |
| Sprint Speed | 0.10378 |
I recommend using these metrics in the context of one another to evaluate BABIP. A high PU%, Pull% (particularly for lefties), FB%, or PH% can help explain why a hitter’s BABIP is low and may continue to remain low. Moreover, given how long they take to stabilize and how well they correlate with BABIP, if either LD% or low drive rate deviate from the mean, a hitter’s BABIP is more likely than not to regress unless the sample is sufficiently large. Finally, please consider another useful measurement to help contextualize BABIP, which is Andrew’s xBABIP found on xStats.org.
With all of that said, it’s important to remember that none of these metrics were highly correlated with BABIP, because no matter what, much of it will always be attributed to luck.
Good stuff Dan.
I’ve noticed the lack of a relationship between BABIP and hard-hit rate as well. However, I believe if you isolate players by speed the relationship gets stronger. It turns out that if you’re fast, it’s better to hit softly hit ground balls rather than hard hit ones.
Did you get a chance to run sprint speed v. ground ball BABIP? That might be more telling.