


Baseball coaches everywhere strive to teach their players the habits and skills necessary to play fundamentally sound baseball. As a player growing up, I recall coaches at every level from Little League to college preaching the importance of limiting the number of free bases – things like walks, hit-by-pitches, and errors – our team gave our opponent.
At the higher levels of amateur baseball, where winning and losing become more of a driving focus, our coaches would have a target of free bases allowed per game in mind. If we kept the free bases we gave up – also called “freebies,” “90s,” “bags,” or other jargon terms you might remember – below that threshold, our chances of winning the game would increase significantly, or so we were told. One off-season, our coaches even had t-shirts made with “No Free 90s” printed on the back.
It’s the kind of conventional wisdom that gets handed down from generation to generation and it’s a logical thing to fixate on. Giving your opponent extra chances to get on base or advance to the next base without them truly earning it only hurts your chances of winning.
It’s also the kind of conventional wisdom we can analyze with objective data. The analytics era has called into question these kinds of rules of thumb and traditional pearls of wisdom in all facets of the game. Let’s add this one to the list. Does this long-held adage about limiting free bases hold merit at the Major League level? Does it impact winning and losing?
Methodology
To explore questions related to the impact of free bases allowed, I pulled seasonal team-level pitching and defense data from FanGraphs from 2012 through 2022. For some questions, the data includes the shortened 2020 season and for some questions it does not, for what I hope are straightforward reasons. I’ll denote which are which as we go through.
The statistics that were counted as “free bases” in this analysis are:
- Walks allowed
- Hit by pitches
- Balks
- Stolen bases allowed
- Wild pitches
- Passed Balls
- Errors
I did not attempt to suss out any of these categories that might have led to multiple bases being gained by an opponent, like a multi-base throwing error. I kept it simple and assumed each instance of one of the things listed above happening was just one base.
Throughout this analysis, I will rely on and discuss correlation – that is, the relationship and patterns the data shows between free bases allowed and other variables. Importantly, this is different than causation or claiming one variable causes the other. I want to note that I will not claim causation with any of this work.
Summary Stats
In the ten full seasons in the data set (2020 excluded), the average Major League team gave their opponents 814.7 free bases over the course of a season. The smallest number allowed in a season was 608 by the 2014 Washington Nationals. The largest was 1,112 by the 2018 Chicago White Sox.
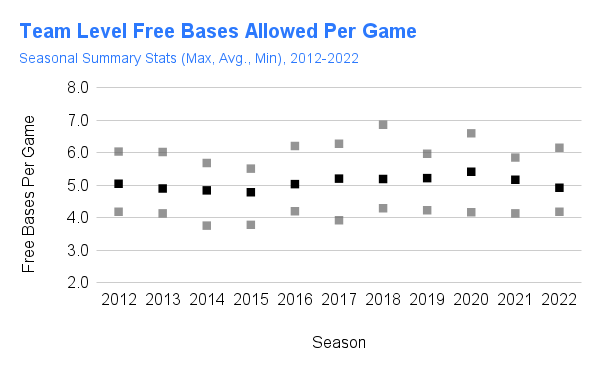
On a per-game basis (2020 included), teams have averaged about 5.06 free bases allowed per game. The plot below shows each season’s team-level average, maximum, and minimum:
Data from FanGraphs
You can see the average varies around 5.0 per game in each season, and the seasonal ranges span from just below 4.0 in 2014, 2014, and 2017 to as high as just below 7.0 in 2018.
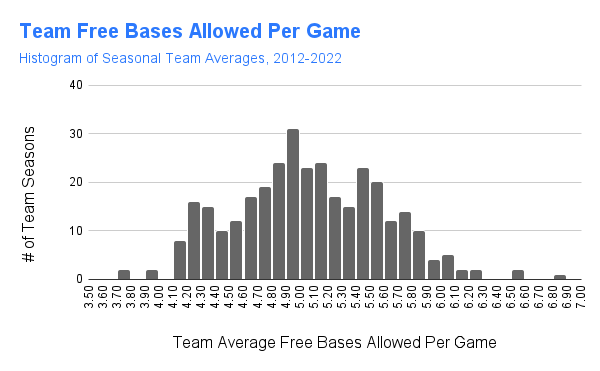
The histogram plot below shows the distribution of the seasonal team average marks:
Data from FanGraphs
Most single-season marks center around the 5.06 overall average and fall within a range of 4.0 to 6.0. The interquartile range — the spread of the middle of the distribution — falls between 4.7 and 5.4.
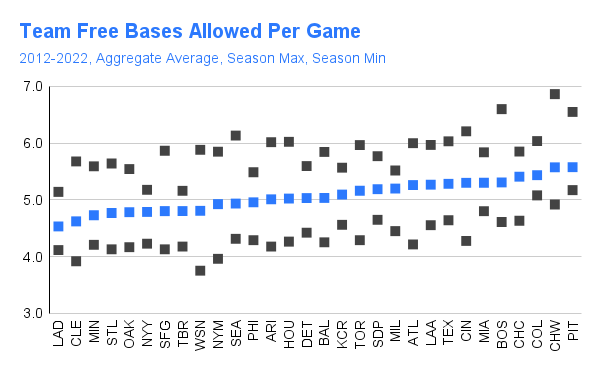
Let’s finish this section of descriptive stats with a team-by-team breakdown. The plot below shows each team’s average free bases allowed per game from 2012 through 2022, compared to their single-season maximum and minimum marks within the same timeframe:
Data from FanGraphs
The data from the past eleven seasons shows that the Dodgers have allowed the fewest free bases on average and the White Sox and Pirates have allowed the most. With that, we can also see that the Dodgers have the lowest maximum mark in the set, closely followed by marks from the Yankees and Rays. Those clubs, even in their worst seasons by this measure, have been right around the 5.06 league average. On the opposite side, Pittsburgh and Colorado’s best seasons in terms of free bases allowed, have been right near the overall league average.
Freebies and Runs Allowed
With the data characterized, let’s get into the fun stuff. This section will be focused on the relationship between free bases and runs allowed. As you might be able to infer from where different teams showed up in the last plot in the section above, the data shows a fairly strong positive relationship.
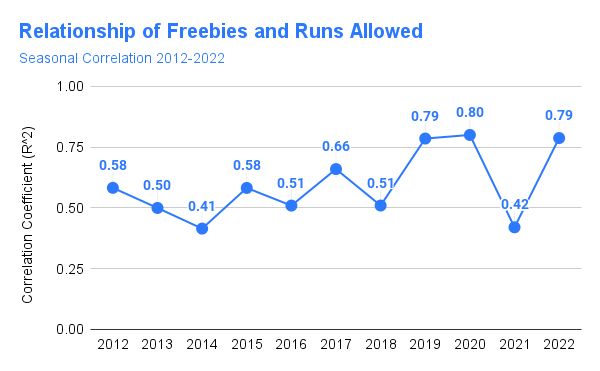
To explore this relationship, I correlated the thirty team-level free bases allowed marks with their runs allowed in each season in the data set. For example, in 2014, the relationship between the team’s free bases allowed and runs allowed (both on a per-game basis) was 0.41. That turned out to be the weakest relationship in the eleven seasons. The chart below shows the correlation coefficient results for each season:
Data from FanGraphs
Over the whole dataset – 330 data points each for free bases allowed and runs allowed per game – the correlation came out to be 0.65. That’s a pretty strong signal that teams that allow fewer runs tend to give away fewer free bases.
Let’s revisit the team-by-team chart shown in the previous section with this finding in mind:
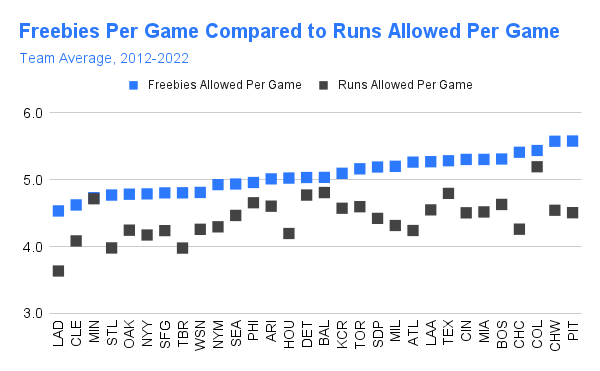
Data from FanGraphs
Like before, this chart is sorted by free bases allowed per game, from fewest to most. The Dodgers were #1 in the fewest free bases allowed and they were also #1 in preventing runs since 2012. Eight of the top ten teams in preventing runs are also top ten in terms of the fewest free bases given up. The general trend of the black data points tracks up and to the right, just like the blue points. This is consistent with what we’ve seen over the past decade. Teams like the Dodgers, Guardians, Cardinals, Yankees, and Rays have consistently been among the best at run prevention and they have also been among the best at limiting the free bases they give away.
Freebies and Winning
Next, I wanted to understand the relationship between free bases allowed and winning. I repeated the same exercise as above, this time comparing team-level free bases allowed per game to the team winning percentages within each season. Here are the correlation coefficients for each season:
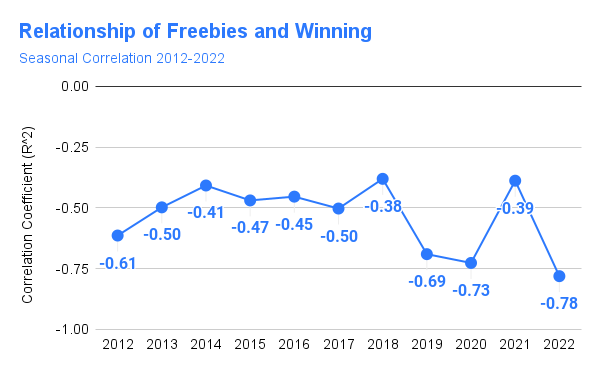
Data from FanGraphs
This time the relationship is negative. Teams that have allowed more free bases have tended to win less and teams that have allowed fewer free bases have tended to win more. Like before, the relationship is fairly strong, ranging from -0.38 to -0.79 across the eleven seasons included. On the overall, eleven-season data set, the correlation coefficient came out as -0.52.
Here’s the team-by-team plot, which pretty clearly shows that negative relationship:
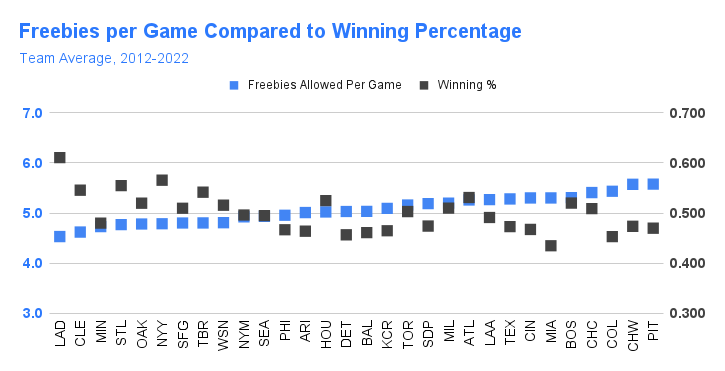
Data from FanGraphs
In total, teams that have had winning records in a season have allowed an average of 775 total free bases in full seasons or about 4.80 per game overall. Teams that have had losing records have allowed an average of 857 free bases in full seasons or about 5.34 per game. Seven of the top ten teams in winning percentage since 2012 are also top ten in terms of the fewest free bases given up. Since the 2012 season, teams that had better than the seasonal league average free bases allowed rates won at a .532 clip, compared to a .468 winning percentage by teams with worse than the seasonal league average.
I pulled out a subset of only the teams that had advanced to the playoffs over the past eleven seasons and analyzed their free bases allowed. Unsurprisingly, given the findings above, playoff teams have allowed fewer free bases per game (4.80) than non-playoff teams (5.20). Of teams that qualified for the playoffs, 73.7% were better than the seasonal league average, including all twelve of the 2022 playoff qualifiers. Of teams that have advanced to the World Series, 80% of them have been better than the league average.
Is Limiting Freebies A Skill?
Since the data above seems to indicate that being able to limit giving away free bases is desirable, the next question is if this is a repeatable skill. Does the data indicate if organizations can reliably limit the free bases they give away over time?
To test that, I turned to an analysis technique that compares team free bases allowed in one year to the next year, looking for a relationship. If teams are able to reliably limit free bases, we’d expect there to be a positive relationship year over year that holds up over time. If it’s a real skill, teams that are good at this in one season ought to be good at it the next, in part because they will often have a large fraction of the same players year to year.
I built a data set that paired each team’s 2012 free bases allowed per game with their 2013 number, 2013 with 2014, and so on. This gave me 300 pairs of seasons to assess. Here’s the scatter plot of those pairs:
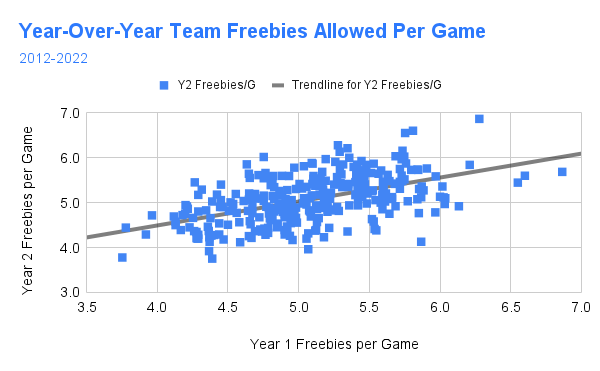
Data from FanGraphs
You can see from the best fit line that there is a clear positive relationship year over year. The R^2 of this data is 0.52, which suggests there is some degree of ability for this to be sustained over time.
Recap
To summarize the findings above in one place:
- Major League teams allow an average of 5.06 free bases per game
- Team free bases allowed are positively correlated with their runs allowed (R^2 = 0.65)
- Since 2012, eight of the top ten teams in fewest runs allowed are also top ten in terms of fewest free bases allowed
- Team free bases allowed is negatively correlated with their winning percentage (R^2 = -0.52)
- Teams with winning records have allowed an average of 4.80 free bases per game. Teams with losing records have allowed an average of 5.34 free bases per game
- Among teams to qualify for the playoffs since 2012, nearly 74% have been better than the league average at limited free bases allowed in that season
- There is a positive relationship (R^2 = 0.52) in free bases allowed per game from one season to the next, indicating that limiting free bases may be a repeatable skill
All of these findings make sense, intuitively. Of course, teams that have given up fewer free bases have tended to give up fewer runs. Of course, teams that have given up fewer free bases have tended to win more games. Of course, teams that give up fewer free bases tend to make the playoffs more. Those things all pass the smell test and track with our most basic understanding of the game.
Limiting free bases allowed is not just an old adage passed down from wise old coaches. It bears out in the data. Maybe all those amateur baseball coaches are on to something after all!
Feature image by Michael Packard (@CollectingPack on Twitter)
Interesting study but leaves a lot to be desired. Of course allowing “free bases” is bad but the real question is are some less bad than others. An error or balk for instance has no positive value in the gameplay and eliminating them can only be good for your team. Walks and hit by pitches may not be so bad as they are a byproduct of pitching agressively. A better study would be looking at the effects of each “free base” on outcomes to determine which ones really need to be minimized and which are just part of an overall strategy
Thanks for reading. You’ll get no argument from me that the conclusions seem obvious, but I was not able to find any previous studies that showed it through the data, so I wanted to start there. While walks, HBPs, and now sometimes even balks can be “strategic,” the overwhelming majority of them are not purposeful and only serve to damage the pitching team’s chances. It would be interesting to explore. Thanks for sharing some ideas for possible follow on work.
At the beginning, you make sure to say you make no claims for causation. I think it would improve your post if you made the point very clear again at the end, perhaps in terms like this: “nothing in this analysis suggests that free bases makes any contribution to a team’s performance in runs, wins, or playoffs.”
For me, the real question lurking behind the post (especially in the “amateur coaching” framing) is the causational one: is “fewer free bases” a nice but ultimately insignificant byproduct of a good team, or is it a strategic aim that can itself contribute to a team’s success? I’d be interested to see you take a stab at that question!