


In 2021, Michael Brantley and Patrick Wisdom might have taken the two most different paths to success possible.
Brantley’s approach is all about making contact as often as possible. Brantley turned his PAs into batted balls 82.1% of the time, 4th best among players with at least the 340 PAs required to qualify for Baseball Savant’s percentiles. Wisdom, on the other hand, was one of just two players to produce a batted ball in fewer than half of his PAs. Differences in their quality of contact, though, meant that the pair recorded near-identical wOBA numbers for the year at .347 and .346, respectively.
So, they made for the easiest possible litmus test for how we talk about hitting the ball hard. So, I posed an “easy” question:
https://twitter.com/chase_rate/status/1467700867864408064?s=20
Because I’ve been making noise about this for a while now (I started talking about why HardHit% is misleading about pitching in late 2020 and expanded on why it’s unhelpful to compare splits-based stats earlier this year — both rely heavily on Tableau visuals that WordPress no longer supports, but you can find them here), I’ll admit that my Twitter followers don’t make for a representative sample of people who talk about baseball. But given this chasm in approach, it’s not all that hard to land at the same conclusion that I’ve been arguing: because the difference in their quantity of contact is far larger than their gap in HardHit%, Brantley actually hits the ball hard more often.
This wouldn’t be a problem if HardHit% wasn’t itself worth thinking about. The finding that exit velocity doesn’t meaningfully impact average results until 95 mph is helpful in setting a bar for how hard a player needs to be able to consistently hit the ball to make an impact. And, because hard-hit batted balls happen fairly frequently, stats based on this data are likely to stabilize far faster than those that incorporate launch angle such as barrels or xwOBA.
But after several years of HardHit% and other contact-splits stats having a large and perhaps unjustified role in how we’ve been assessing and talking about players, we don’t need to just replace one number with another — we need to take the time to correct the record and who does and doesn’t consistently hit for power.
Why shouldn’t I use HardHit% as a “tools” stat?
It’s tempting to think of a player’s tools as video-game style ratings that capture skill in simple, digestible numbers. If you can gather enough data on a player that you can discover their real-life ratings and accurately predict how productive they’ll be. HardHit% fits neatly into this view: If you reduce hitting outcomes to something like multiplying someone’s hit tool by their power tool, then a good HardHit% should mean that a player has a lot of raw power. A young player with a good HardHit%, then, might be just a simple tweak in approach away from a breakout.
But, keeping with this video-game metaphor, you’ll know that any time there’s more to it than that if you’ve ever actually played MLB The Show or games built like it. That game allows you at least five choices for each pitch — a standard swing, a power swing, a contact swing, and a bunt, as well as not swinging at all — and depending on how often you use each of them (and setting aside how good you are at using them), the exact same player could deliver wildly different results.
This “breaks” HardHit% in a pretty way. Over the course of 100 PAs, you could recklessly power-swing your digital Babe Ruth to 50 strikeouts, 25 total rolled-over groundballs and flyouts under 95 mph, and 25 laser beams over 95 mph. That would make for a 50% HardHit%, but a pretty terrible overall line. Swapping out that power swing for a contact swing in two-strike counts might allow you to trade 20 strikeouts for 15 bloopers and 5 hard-hit balls, which would lower your hypothetical HardHit% from 50% to roughly 43% while markedly improving your results.
In real life, we can easily find countless examples of choices that players make that distort how effectively HardHit% measures their power potential:
- How often do they swing, both inside and outside of the zone? Players that are overly selective (see: Cavan Biggio) can end up with fantastic contact stats because they’re only swinging at their ideal pitches. Just swinging more would mean swinging at less-hittable offerings.
- Are they planning to sit on one pitch, or to read and react? Players that wait for fastballs are an extension of the last bullet, but those that guess fastball without waiting (see: Mitch Garver) are going to have great results when they’re right, but they’re generally not going to make contact at all when they’re not.
- How do they change their approach depending on the situation? The fake Babe Ruth example from above might be exaggerated, but players do choke up with two strikes, swing for the fences in hitters’ counts, and even alter their approach entirely depending on who’s on base. Trevor Hooth’s piece on Triston Casas is a great read that demonstrates exactly how some evaluators are already making these contextual adjustments.
- How many hittable pitches are they seeing? Either because of reputation, habits, or lack of lineup protection, not everyone sees the same quality of pitches. We’ve discussed how this affects Mike Trout for years, and this year Shohei Ohtani carried on the legacy of Angels players not seeing much worth swinging at — his zone% was fourth-lowest among qualifiers. Meanwhile, his teammate David Fletcher had the highest zone% in the league. It’s not just players’ choices that affect their outcomes — the choices that their opponents make also matter!
There’s a good reason that most players who just improve their approach to get the most out of their power never actually do that. It’s probably not worth our time to consider what Aristides Aquino could be if he cut his strikeout rate — if his incredible power numbers from his magical first month in the majors were because he was guessing fastball correctly at an unsustainable rate, then there’s just not a reasonable pathway forward for improved approach without his contact numbers getting a little bit worse.
This isn’t to say that we can’t use Statcast data to hint at what players’ tools are. The ongoing discussion into how to best use max exit velocity as a marker for a batter’s raw power potential is, to me, one of the better examples of how smart we can be with data — I’d recommend Alex Chamberlain’s article on it last year, not the least because it does a great job of linking to all the other great work that’s also worth checking in on. It also tracks neatly with what we’d expect: an exceptionally high maximum can’t be ignored, and middling results can only be accepted for a little while before we start to cast our doubts.
What makes it smart, though, is that it’s being used to answer a question that it undoubtedly is built to answer. It’s much, much harder for a player’s other skills to impact the relationship between max exit velocity and a player’s raw power — we can treat them as one and the same without being wrong in some easy-to-overlook way. And HardHit% fails as a “tools” stat for exactly that reason: making good choices and having other skills can make you look worse at it.
What does a fix look like?
The issue at hand is that there’s a tradeoff between how often a player makes contact and how good that contact is. The graph below charts how Statcast qualifiers — that’s 2.1 PA per team game, or about 340 PA in 2021 — traded between HardHit% and BBE%, the percent of PAs that ended in a batted ball event. WordPress is having issues hosting Tableau interactives, but you can explore where players fall on this graph here.
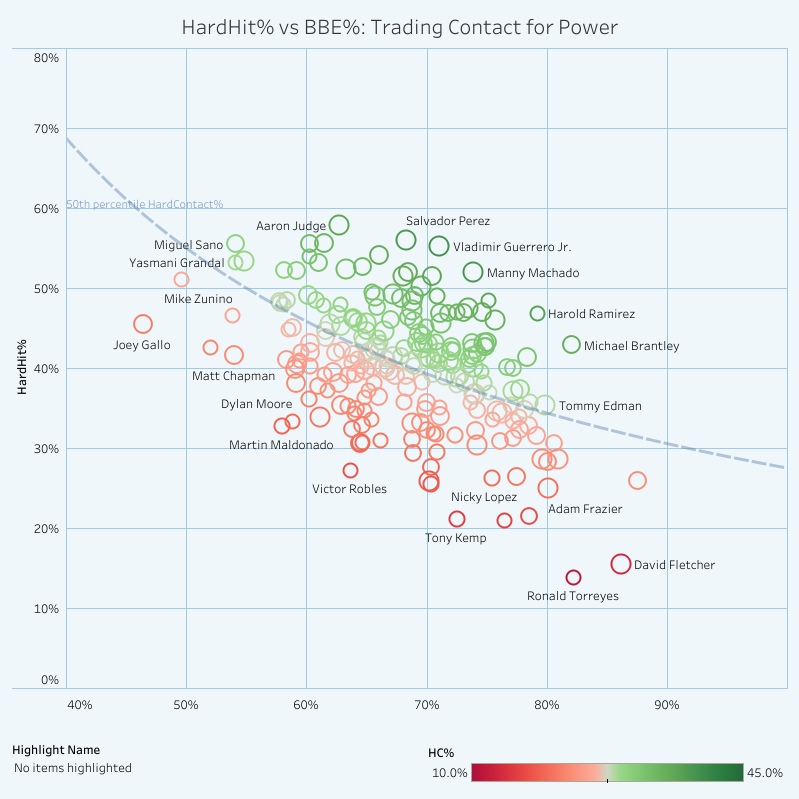
When you multiply these two axes — HardHit per BBE times BBE per PA — you end up with HardHit per PA. This is the fix that I’ve advocated, and for good reason: it tells us how often a player hits the ball hard. And, as you can see, there are multiple pathways to consistently producing hard contact.
I’ve referred to this stat as HardHit/PA for a while because I wanted to make sure people who were unfamiliar understood exactly what it represented. The problem I’ve come to have with that, though, it’s a little bit clunky and almost feels like it’s the weird-splits version of “traditional” HardHit%. So, because our default for any fair comparison should be per-PA, I’d like to propose HardContact% as the proper name for this stat.
This change works especially well because we can separate a player’s total PAs into four categories: strikeouts, walks, HBPs, and contact. We also have K% and BB%, and HBP% follows pretty naturally. HardContact% and SoftContact% would add in to complete a pie chart, allowing something like this:
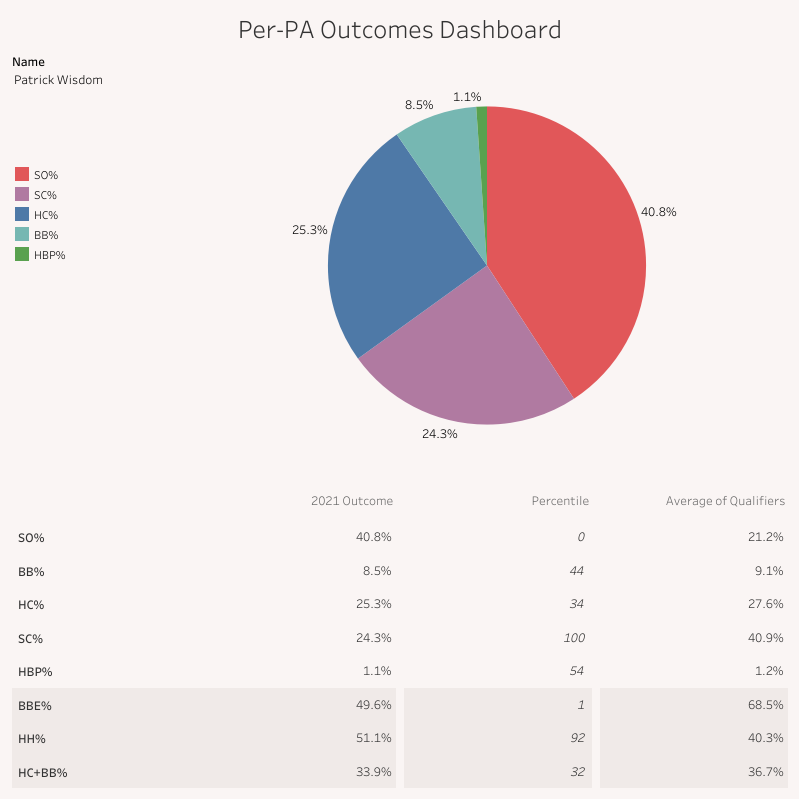
Patrick Wisdom makes for a fun example with this because he’s just so far outside of the norm, but the same rules apply no matter what. Despite an elite HardHit%, his HardContact% is just a middling 25.3%, which is only in the 34th percentile. However, his approach leads to the lowest qualifying SoftContact% at 24.3%. It’s definitely the case that a low SoftContact% needs the context of strikeouts to tell the full story — in his case, they combine to be 65.3% of his PAs, which is not great!
Let’s compare that to the chart we can create for his counterpart from earlier in the piece, Michael Brantley:

Brantley’s bat-to-ball skills are clearly leading to a huge number of balls in play, and because a large chunk of that is hard contact, he’s turning far fewer of his PAs into results that are likely to get him out. SoftContact% might quietly be the most interesting result of the originally EV-to-wOBA relationship that spurred HardHit% in the first place, and Brantley is a great player to apply it to. Sure, he doesn’t hit a ton of home runs. But does he hit the ball hard enough to yield positive results often enough for him to be a positive contributor to his team? Absolutely.
There are some shortcomings of this approach. As I mentioned before, not all hard contact is created equal, so Brantley’s HardContact% slice isn’t yielding results of the same value as those from Wisdom’s slice. But on the whole, these aren’t anything we haven’t already known. I’d be interested in drawing a like somewhere above 95 mph and sorting between soft, medium, and hard contact, but I avoid putting barrels on here because those include launch angle as a portion f their formula and I’d like to avoid that for this exercise.
Since I first started talking about this issue last November, though, the objection to this fix I’ve heard hasn’t been about differences between 96 mph and 116 mph — instead, it’s always something like isn’t this unfair to players who walk a lot?
So, let’s take a quick look at what this chart looks like for someone who walks like nobody’s business: Yasmani Grandal.
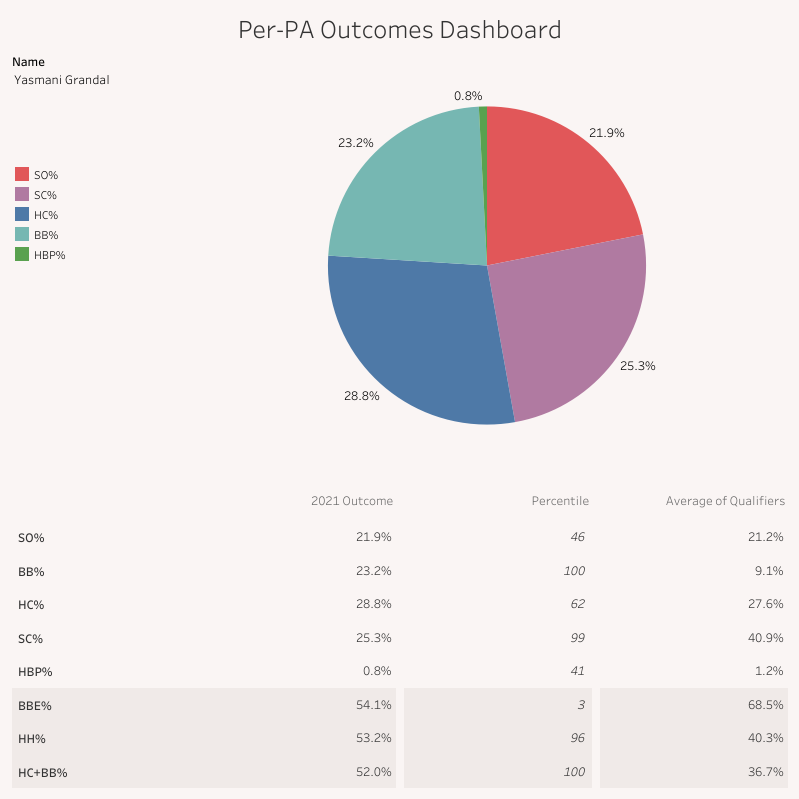
Grandal has an elite HardHit% of 53.2%, good for the 96th percentile. He swings and misses a decent amount, but it’s his choice to just not swing at all that sets him apart from most players. The result? Last year, he walked an obscene 23.2% of the time, and all that not swinging really cut into his HardContact%. So: is it unfair to that he slips down the percentile leaderboard?
No. Not at even a little bit.
The problem that I’ve identified with HardHit% is that it’s excluding important information from the denominator, making it a fundamentally unfair comparison — it punishes groundouts without punishing strikeouts, both of which are ways to not hit the ball hard! The reality, though, is that players who walk a lot are doing so at the expense of chances to make hard contact, and it would be unfair to ignore that information as well.
This is part of the reason that I typically take a hard line against using HardHit/AB (with some caveats and carveouts for those of y’all using it to predict batting average for fantasy, I guess) and HardHit/Swing (Baseball Savant provides this on one out-of-the-way leaderboard, but not on player pages, which reads to me as an acknowledgement of how useless it is). Further, the fact that we’re still implicitly fighting the “is it okay to just ignore walks” battle nearly two decades since Moneyball was published is, quite frankly, pretty disappointing. Batters have the power to be selective, and that choice is valid way to get one base just as much as singles are. Grandal shouldn’t be high on a list of people who frequently hit the ball hard because, relatively speaking, that’s not something he does!
But, let’s say that you wanted to capture walks and hard contact together. Well, because HardContact% and BB% are on the same scale, we can just add them. And that math to this makes a shocking amount of sense: the 2021 wOBA formula assigns walks a value of .692, while the average hard-hit batted ball had a wOBA of .625, making them roughly 90% as valuable. We rely on far less precise numbers very, very often, so I’d have no qualms with pairing them together as a “how often did a player finish a PA with a mostly-good result” measurement.
And, as it turns out, Grandal’s 52% HC+BB% was second only to Juan Soto’s. So, no, I’m not worried about HardContact% underrating him — that’s only a problem if you use it to answer a question it’s not designed to answer.
What changes most?
If the problem here is how HardHit% has warped our perception of who’s good, bad, and mediocre, then the first place worth looking at is who moves the farthest in percentile ranks when we adjust. First, to look at who we’ve been underrating, here are the players who move up the leaderboard by 20 percentiles or more:
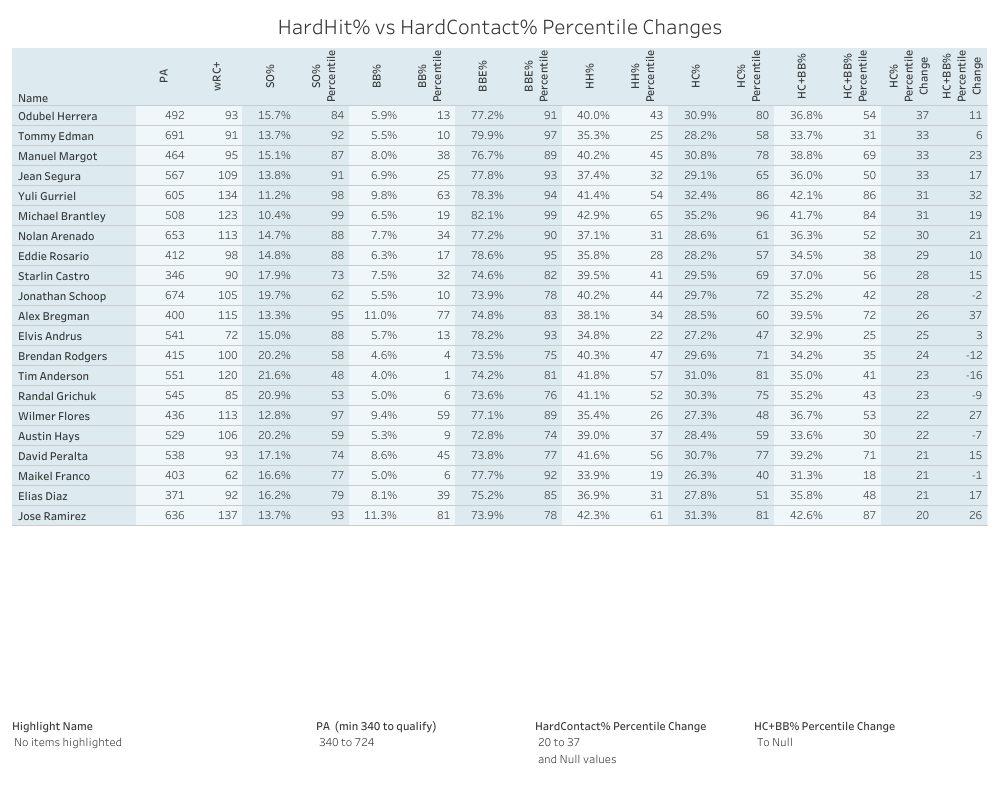
There sure is an archetype here, isn’t there? Odúbel Herrera being the highest on this list is a convenient (if unexpected) result because he checks all of the boxes that others toward the top of this list might:
- A strikeout rate in the top 20%
- A walk rate in the bottom 20%
- A HardHit% percentile between 25% and 50%
Low strikeouts are obvious, and low walks make sense for the same reason: to end up at the top of this list, it’s important to maximize quantity of contact. A near-but-below-average HardHit% is the last piece required to max out on this particular leaderboard: any higher and they don’t have much room to climb in the percentile ranks (or in our opinions of them), and any lower and there’s just nothing that rescaling can do to make them look better. More on that in a moment.
We’ve talked about Brantley, and he showed up as a top-right outlier on the graph we examined earlier. But it’s Nolan Arenado that I’m most interested in on this chart. Arenado has put together the first half of a Hall of Fame career on the back of undeniable defense and contact skills, but his actual power outputs haven’t matched what Baseball Savant’s contact metrics have shown. His batting average might have been inflated by Coors Field, but his power numbers are the result of an elite ability to turn his power into pulled fly balls. Re-scaling HardHit% to HardContact% still doesn’t capture this, and it is important to take note of the shortcomings of using these blunt instruments. But our fixation with contact-only stats such as HardHit% and Barrel% has certainly helped to advance the perception that Arenado has maybe been lucky to play half his games in Denver rather than a skilled player who’s uniquely good at maximizing his considerable skills.
On the other end, the players who fall down the ranks the most are pretty much exactly who you’d expect, but not all for the same reasons.

Joey Gallo hit the ball so infrequently last year that he didn’t even have to be exceptional when he did in order to crater down the leaderboards. He and Wisdom were the lone qualifiers to finish the season with a BBE% below 50%. At this point, I imagine that most people who are going to encounter HardHit% are going to know that Gallo isn’t making much contact, and I’m not terribly concerned that he’s being overrated.
But it’s incredibly important to draw a distinction between the two in terms of what this list should tell us about them — and if you peek over to the final column of this chart, you’ll see exactly why. Gallo might not be making a ton of contact, hard or otherwise, but his gigantic walk rate means that it’s probably inappropriate to say that he’s selling out for power. In fact, Gallo only marginally slips down the list when we move from HardHit% to a combined HardContact+Walk%. This is true for many of the other elite players on this list: Brandon Belt, Yasmani Grandal, Bryce Harper, Brandon Lowe, and Shohei Ohtani all managed to put up wRC+ numbers abve 130 thanks in large part to big walk rates. Wisdom, though, is a great example of what it looks like to sell out — he’s joined by several others who fall even farther when we compare against HC%+BB%: Javier Báez , Bobby Dalbec, Adam Duvall, and Jackie Bradley Jr. are on this list despite not spending many of their PAs walking to first.
Finally, though, let’s take a moment to examine who shouldn’t change much at all in our estimation. Below are the players who moved by fewer than two percentiles.
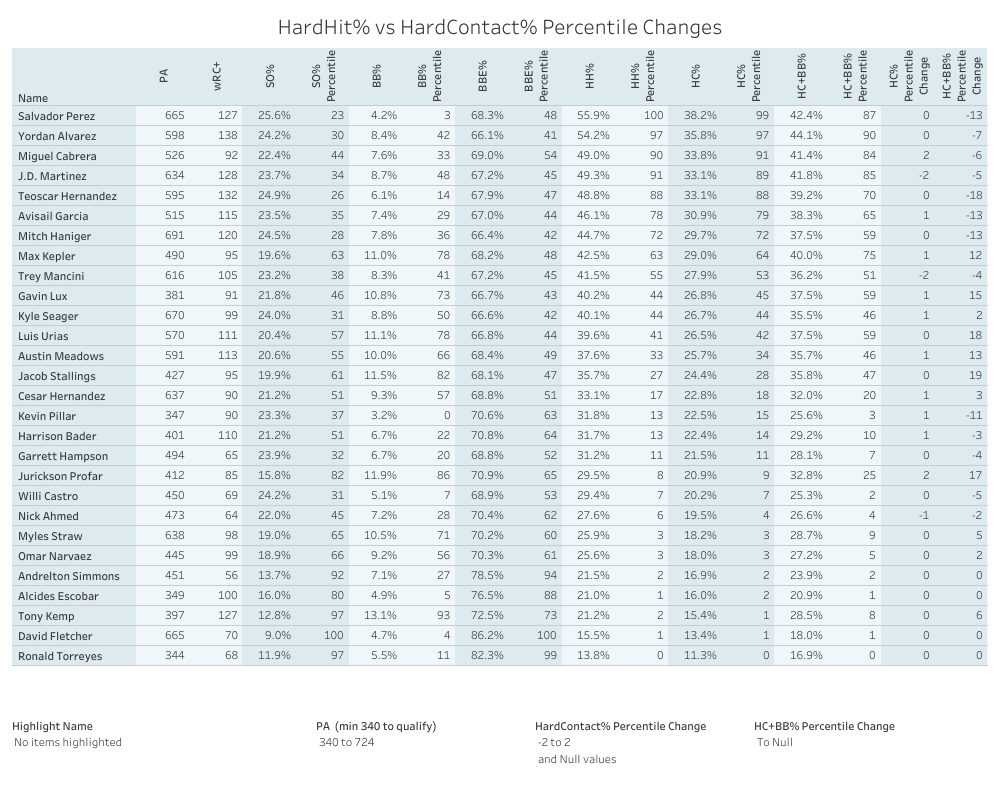
There are a few different archetypes represented here, and I think that Salvador Perez is the most interesting of the “good” players here. Perez is well known now for his exceptionally aggressive approach, but the net results of what he did was a BBE% right near league average. Combine that with his near-league-leading HardHit%, and the result is a HardContact% that only Vladimir Guerrero Jr. and Manny Machado were able to beat. Perez is a great example of how the limits of the pro/con style discussions that we often have can lead us to undeservedly undercut players who take lesser-used paths to success — Perez still put up an 87% percentile HC+BB%, meaning that his approach was far from all-or-nothing.
On the other end of things, we have a slew of players who were at the bottom of the HardHit% leaderboard. They’re still at the HardContact% leaderboard despite putting the ball into play all the time. Why is that? Because volume can’t save a lifeless bat. David Fletcher’s strategy to just pray that his weak contact misses an infielder just isn’t all that effective.
Takeaways
The idea of separating all contact into two buckets is an extremely blunt approach. It’s never been a surprise that these stats can miss things. But the issues at hand with what I see as a mistranslation of the word how often are entirely separate from the differences between a 96 mph fly ball that dies in the outfield and a 120 mph rocket that never lands.
Want to know how often a player hits the ball “hard?” HardContact% is built to answer that question. Anything else that swaps out “greater than 95 mph” with another definition but keeps PA as the denominator — a DynamicHardContact% would be easy to make by multiplying dHH% by BBE%. Statcast already provides a leaderboard for Barrels/PA, and that’s been the go-to version of “barrel rate” for a lot of analysts for a long time for the same reasons.
What you do with an answer to that question is another matter. I like it as a measure of consistency that strips away other noise for small samples, but because hitter numbers become stable in less than half a season, the answer might just be descriptive. But it’s worth knowing those limits and acting within them either way.
I encourage you to play around with the leaderboards I’ve made and to ask your own questions based on this data. I’m happy to open this can of worms, but people with more technical expertise might be able to make more of it than I have:
- You can find the pie chart tool for individual batters here.
- You can find the interactive power/contact tradeoff chart here.
- You can find the full leaderboard for players’ percentile changes here.
What I think this exercise can prove about data is much the same as what it can prove about hitters: the choices we make are just as important as the raw tools we have.
Go make some good choices.
Graphic by Michael Packard (@designsbypack)
Very interesting article. I wish I were smart enough to run with this more and turn it into something more. I really liked what you did though and figured I would come here and let you know it was much appreciated.