


In what’s become a regular occurrence, a teenage sensation has set the baseball industry ablaze. A year ago, we witnessed history as prodigies Ronald Acuña Jr. and Juan Soto, only 19 and 20 years old, respectively, at the time, dueled down the stretch for the National League’s top rookie. At the start of Spring Training, Blue Jays phenom Vladimir Guerrero Jr. (who probably came out of the womb as a fully grown man) made headlines with relentless media attention in anticipation for his big league debut. However, a different former big leaguer’s son, a zestful 20-year-old athletic shortstop bursting with boundless potential, has been the one electrifying the league and helping to manufacture jaw-dropping highlights all season long.
In a somewhat unanticipated move, the San Diego Padres decided to include Fernando Tatis Jr. on their 2019 Opening Day roster, despite the fact that he had never even played AAA baseball. There was little doubt that Tatis Jr.’s skill-set could eventually make him a perennial All-Star, but there was skepticism over whether his 451 plate appearances at the AA level had provided sufficient seasoning in the widely acclaimed prospect’s development.
As the Padres broke camp in late-March, Tatis Jr. immediately made his stamp on the club, showcasing a constantly-running motor with plays like this one below (he was initially ruled out, but it was overturned after a replay review).
https://gfycat.com/shinyfancybarasingha
He has justified the front office’s aggressive assignment with an unbelievable .416 wOBA and 162 wRC+ in the first half, slotting him 5th in all of baseball in both metrics, among players with 150 or more plate appearances in 2019. Tatis Jr. has been a huge factor in the Padres’ resurgence as a postseason contender, as the team currently sits just two games back in the National League Wild Card race. In the process, Tatis Jr. has emerged as the crown jewel in the team’s rebuilding effort that’s finally beginning to bear its fruits in the majors.
Exclusive Company
Tatis Jr. has been every bit as advertised in the first half of 2019, performing like a superstar in all facets of his game. He has posted an impressive 3.0 FanGraphs WAR (fWAR) thus far in 2019, despite missing a significant 34 games due to a left hamstring injury suffered in late-April. On the surface, Tatis Jr.’s offensive numbers provide strong merit to his status as one of the games’ best offensive players, as exhibited by the chart I created below.
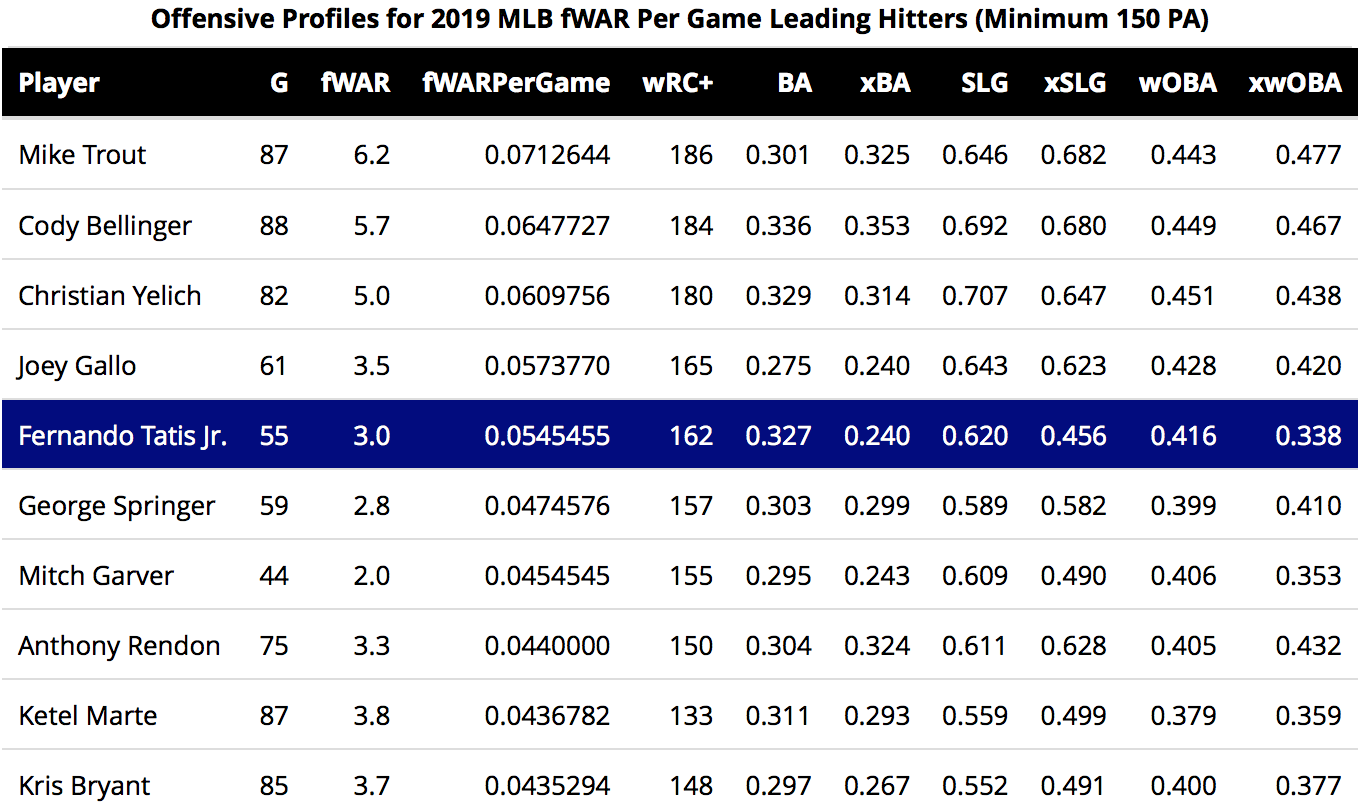
It doesn’t matter which way you slice the cake: Tatis Jr. has been nothing short of excellent in his first sampling in the majors. Looking at the caliber of the players sandwiching his placement in all the metrics above, it’s immediately clear that Tatis Jr.’s first-half exploits have enshrined him among some pretty exclusive company. Can we really expect this 20-year-old prodigy to continue providing the Padres with offensive production at a rate that would warrant MVP consideration in any year where Christian Yelich and Cody Bellinger didn’t have a wRC+ north of 180? It’s time to talk about that dreaded word players hate talking about, the one that you should probably check the surrounding scene to ensure yourself that Yelich (subscription required) isn’t within earshot before speaking: regression.
Historical Caution
Upon beginning to dig into some of the underlying statistics that have enabled Tatis Jr.’s breakout, there are some metrics that serve as clear omens of looming regression for the rookie sensation; his .419 first-half Batting Average on Balls in Play (BABIP) ranks only behind Bryan Reynolds (.426 this season), Aaron Judge (.426 in ‘17), David Wright (.426 in ‘09), Ben Gamel (.422 in ‘17), and Chris Colabello (.421 in ‘15) since 2009, among hitters with 200 or more plate appearances.
How did the four players mentioned above from previous seasons fare the remainder of those seasons? Unsurprisingly, they collectively regressed mightily in the second half of their respective seasons, with an average second-half BABIP roughly 100 points lower. Does this in isolation mean Tatis Jr. is likely to see his offensive output plummet? No, not by any means. However, a grand total of zero hitters have been able to sustain BABIPs even approaching .400, and taking Tatis Jr.’s pedestrian batted ball metrics into account, it’s no secret that this metric will eventually stabilize around a lower number.
Unfortunately for Tatis Jr, the question at stake isn’t if he will regress, it’s by how much should his offensive production be expected to fall.
Digging further into the numbers, the sustainability of his output looks even bleaker after examining Baseball Savant’s “Expected Metrics”, which theorize that good fortune has aided the shortstop to outperform the anticipated outcomes of his batted balls on all fronts. Tatis currently sports just a .240 xBA, compared to his impressive .327 actual batting average, with his expected power numbers diminished as well, with a 456 xSLG, compared to his hulking .620 actual SLG, and lastly, an ordinary .338 xwOBA, compared to his terrific .421 actual wOBA.
In addition, his unfavorably high 28.6 % strikeout rate creates an additional layer to the narrative and is another blow to the sustainability of his numbers. Since 2000, only eight players who have appeared in at least 100 games have been able to finish the season with a batting average north of .285, while striking out in at least 27 % of their plate appearances. Only Carlos Gonzalez (.302) in 2013 has managed to eclipse the .300 threshold. Sure, Tatis Jr. posted stellar BABIPs throughout his ascension to the majors, but it consistently sat between .340 and .370, a far cry from his .419 mark that he currently has. Based on Tatis Jr.’s batted balls in 2019, he has a substantially less impressive, yet still above-average .315 xBABIP, yielding any incredibly large residual (4.11 Standard Deviations above the mean) for the differential between what has actually occurred and what the metrics predicted would happen based on the balls in play.
Ominous Pessimism from Statcast’s Models
For those unfamiliar with Baseball Savant’s Expected (or X)-Metrics, they seek to extract a player’s truly deserved performance based on the exit velocities, launch angles, and location of every batted ball struck into play by each hitter, and have been proven to deliver both precise and accurate results if given a sufficiently large sampling. However, when the player currently leading the league in balls hit into play (Marcus Semien) has a sample size of just 321, this leaves too much room for hitters’ actual numbers to vary significantly from their expected results. In order to eliminate this arbitrary variance in the short-run from Statcast’s models for expected Batting Average (xBA), Slugging Percentage (xSLG), and Weighted On-Base Average (xwOBA) on the micro-level, a hitter would likely require a sample size of a few full seasons.
In essence, these X-Metrics serve as long-run levels that a hitter’s numbers will ultimately regress towards as they accumulate a larger sample size. While these metrics don’t predict future results, they are highly effective for trying to validate past performance. Although players can see their offensive abilities legitimately improve or deteriorate throughout time, the best predictor of future performance is past performance.
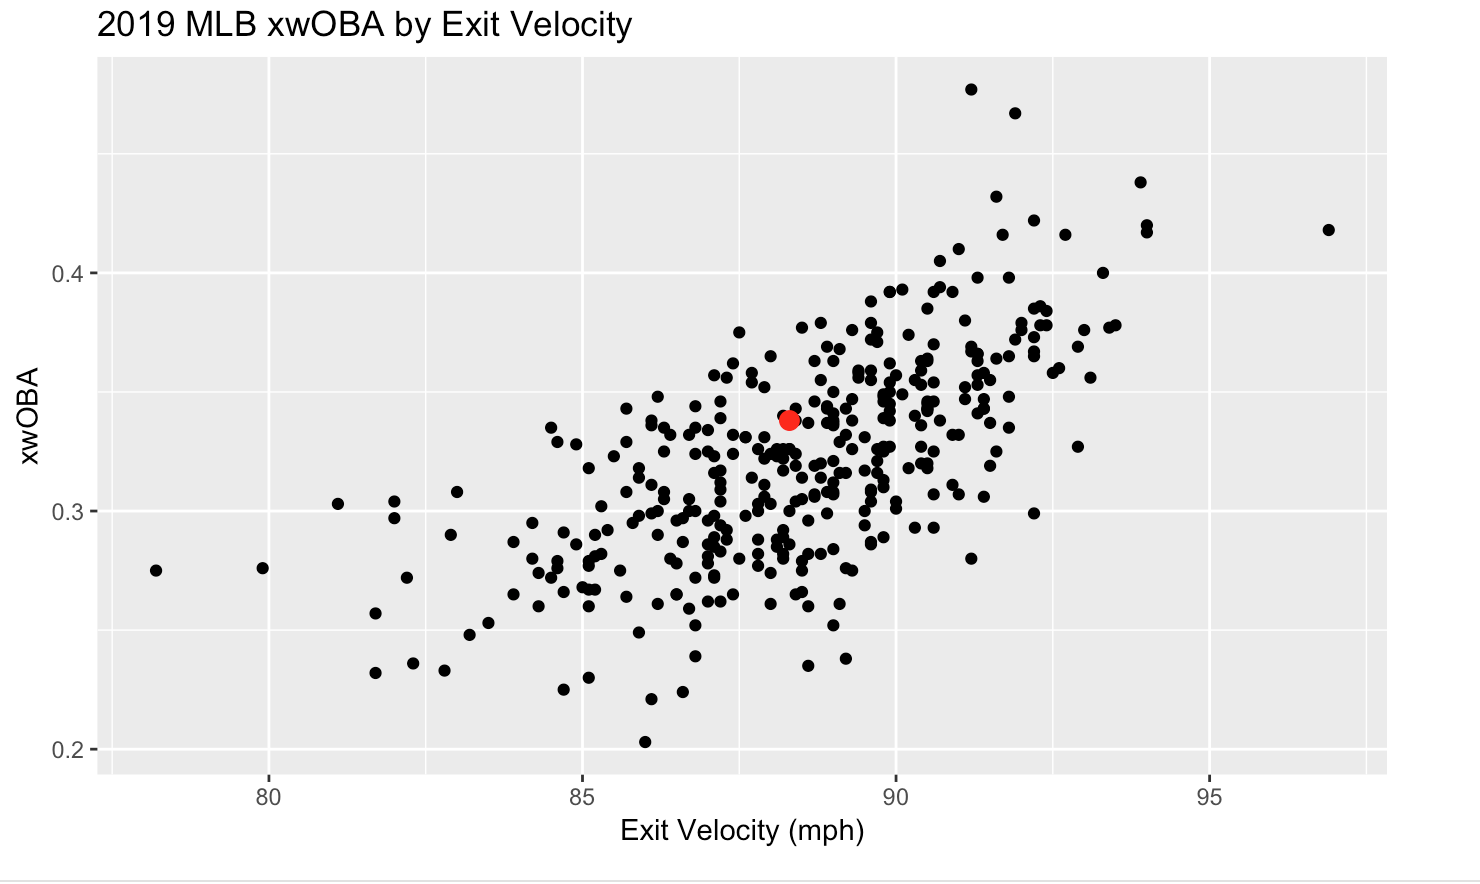
In 2019 Fernando Tatis Jr. has been seemingly immune to the Statcast models’ expectations on all fronts thus far, but this performance lacks sustainability. Statcast’s expected metrics have an underlying trend that confirms the obvious: the harder the ball is hit, on average, the higher the expected xwOBA. This is shown graphically in the scatter plot below of xwOBA based on Exit Velocity; you might be wondering about the distinct red point situated near the center of the plot in a highly concentrated region of points. This roughly middling point represents Tatis Jr. (45th percentile in Exit Velocity and 65th percentile in xwOBA), and his xwOBA would place his performance amongst the actual wOBAs of the likes of Paul DeJong, Andrew Benintendi, and Joey Votto; we’re talking about an expected drop-off from being an MVP-level offensive performer to being a firmly above-average regular if he were to continue to post a similar batted ball profile and regress to the level of his xwOBA in the long-run. That is, assuming that the models have completely accounted for Tatis Jr.’s true offensive skill-set.
As legendary British statistician George E.P. Box once said, “all models are wrong, but some are useful.” Upon encountering this drastic discrepancy between on-field outcome and peripheral predictions, I immediately wondered if there could be some underlying factor that went unaccounted for in the constructing of these models that could propel Tatis Jr. to continue to “over-achieve”. Any random Average Joe could point their finger and attribute the entire situation to luck, but there could be more to the narrative. With such large residuals for all the metrics in a sample size of over 140 balls in play, it appeared feasible that other factors could have been aiding Tatis Jr, besides the obvious possibility of good fortune.
Hot Wheels, Beat That
Looking deeper into the numbers, Tatis Jr. has seen an abnormal percentage of batted balls typically deemed outs turn into singles, with just a .493 xBA on these types of hits. One variable that certainly carries weight on the outputs of all the X-Metrics, yet isn’t actually accounted for in their computations, is speed, which is a crucial component of Tatis Jr.’s game. Immediately, the absence of speed from the models sticks out as something that could be a driving force behind the magnitude of the residuals.
Of Tatis Jr.’s 40 singles this season, 11 of them have been of the infield variety. Statcast’s metrics assume that Tatis Jr. and Jesus Aguilar have the same probability of reaching first on a chopper to third, which is obviously inconsistent with reality. Speed puts pressure on the defense, and while many of the batted balls resulting in these types of hits might not possess the ideal launch angle or exit velocity, Tatis Jr. will continue to sporadically accumulate these hits as long as he has the wheels to rival Benny “The Jet” Rodriguez. These types of hits are going to have a sustainably positive residual until the models are able to account for the incredibly complex entity that is speed.
There are various avenues to go down when evaluating the impact of speed on offensive performance; there are three main metrics that are valid candidates to account for this impact: sprint speed, home plate to first base times, and FanGraphs’ BsR metric. When analyzed together, these statistics should paint the full picture of a player’s speed/baserunning skill-set. Each of the three has its benefits and shortcomings, but looking at the relationship between the X-Metrics and all three should help to determine of understanding of speed’s role in impacting offensive performance.
In the case of Fernando Tatis Jr, the fact that the difference between his actual and estimated Batting Average, Slugging Percentage, and Weighted On-Base Average are all so overwhelmingly positive means two things: both his ability to hit and drive the baseball have been overstated by his on-field offensive performance.
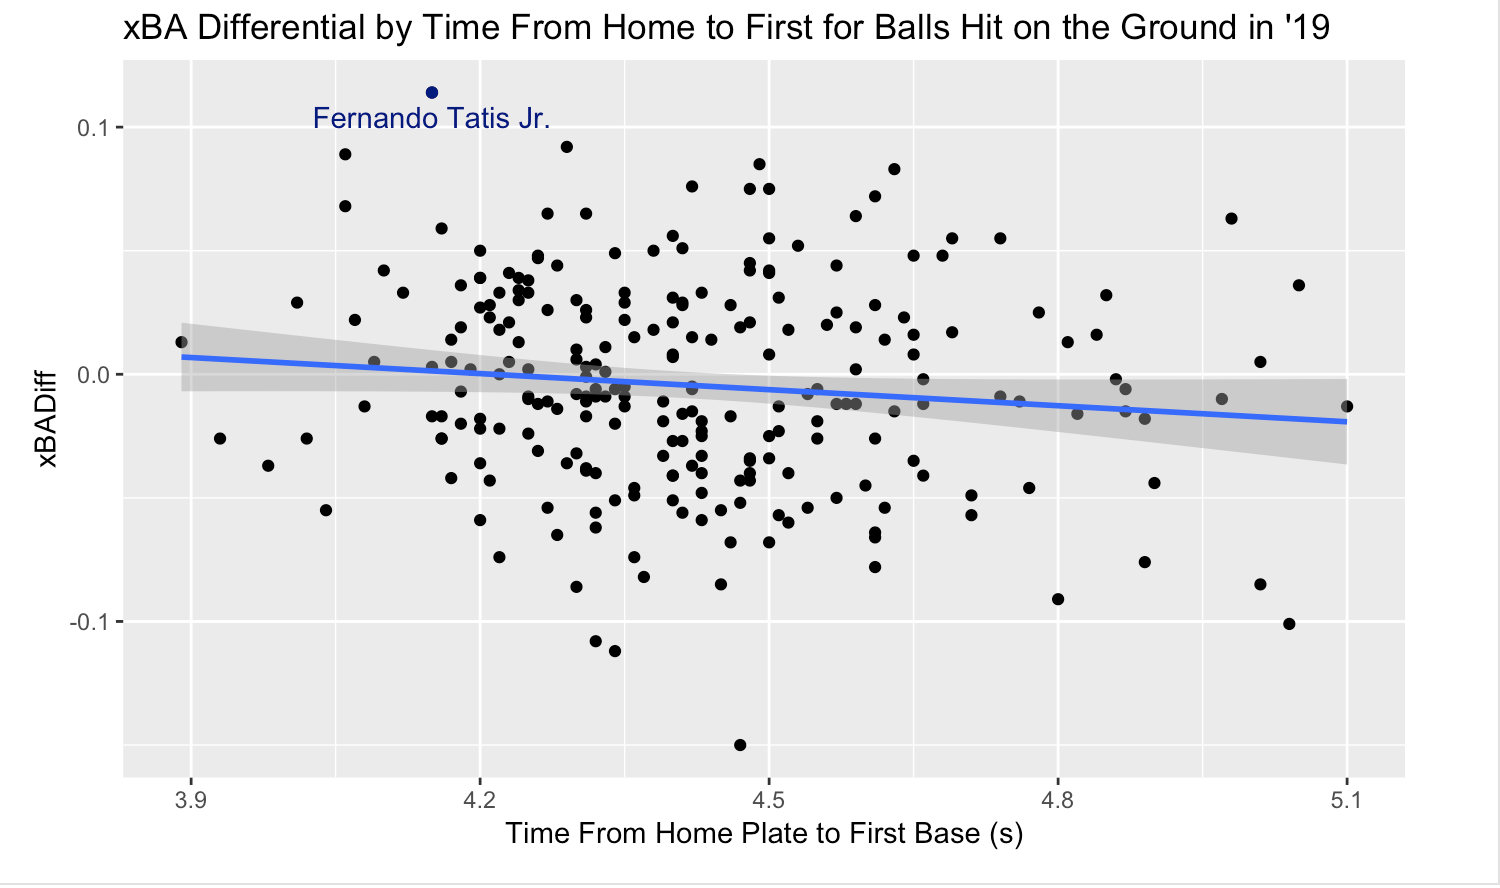
In order to get a sense of the sway that speed could have in these areas, we can begin by looking at the scatterplot below, showing the difference between BA and xBA on ground balls versus the speed of the runner. In this case, the time it takes for the runner to run from home plate to first base is the optimal metric to use because we are only looking to see if the batter reached first base safely, so any extra bases taken are irrelevant to the batting average component. This plot shows that while there is a significant amount of variance, with many positive and negative residuals for batting average difference throughout the plot that indicate there’s likely a low correlation coefficient between the two variables, as a player’s time from home to first decreases, on average there will be an observed increase in the difference between their actual and expected batting averages. This slightly negative relationship can be observed from the line of best fit.
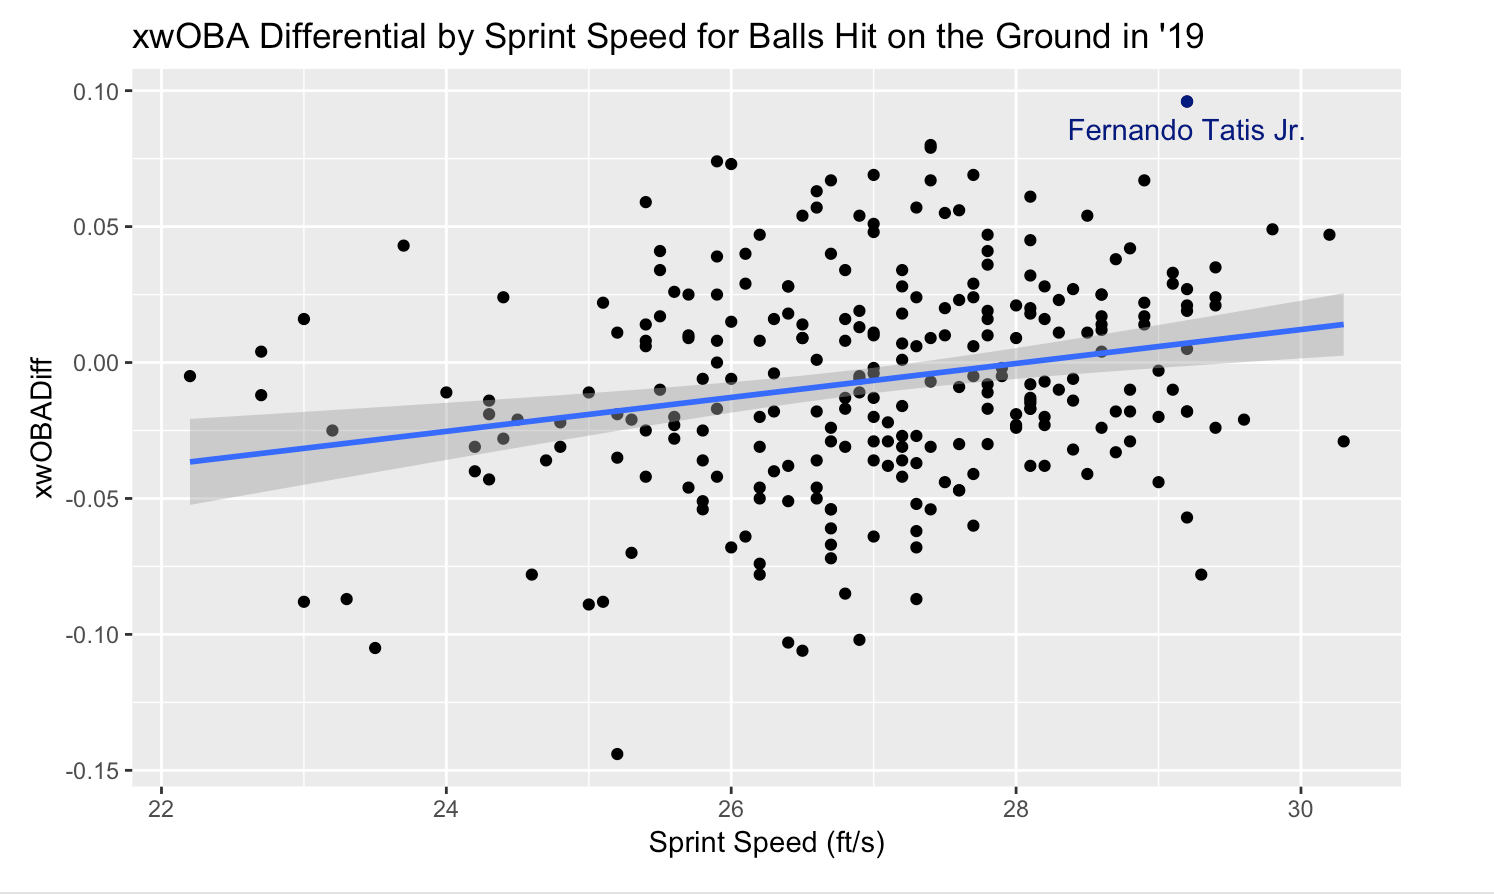
In terms of sprint speed, the burgeoning star ranks in the 96th percentile, among players with a minimum of 10 opportunities on the basepaths, which I believed could help account for some of the differentials across the board. Without elaboration, the term sprint speed leaves too much ambiguity; what this metric essentially measures is the speed of the player at the peak of the acceleration. While it seems most logical to deploy this metric as the best evaluator of speed, it fails to account for the time that it takes for a player to reach acceleration when looking at xBA and doesn’t account for baserunning aggressiveness and instincts, or efficiency at rounding bases for xwOBA.
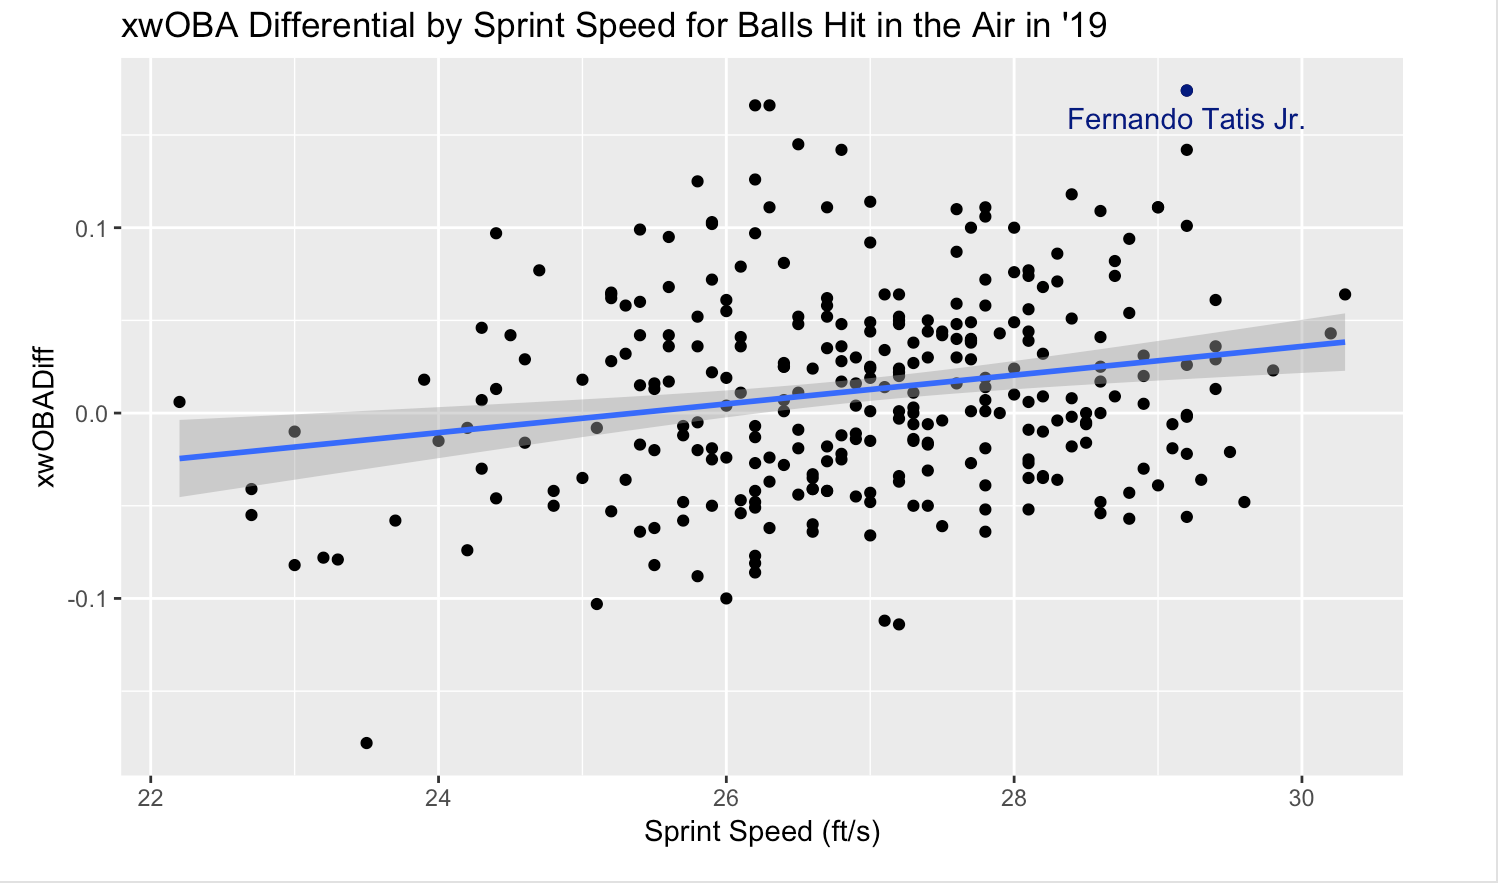
Looking at the impact of sprint speed versus the difference between xwOBA and wOBA for both ground balls and balls hit in the air (line drives, fly balls, and popups) yields further interesting developments; once again, there’s a large number of points with both positive and negative residuals, but a general trendline that exhibits a positive relationship between sprint speed and xwOBA Differential for all balls put into play. This signifies that on average, as sprint speed increases, this will result in a larger positive difference between a batter’s wOBA and xwOBA, or in other words, it will enable them to take more additional bases on hits than anticipated by the model.
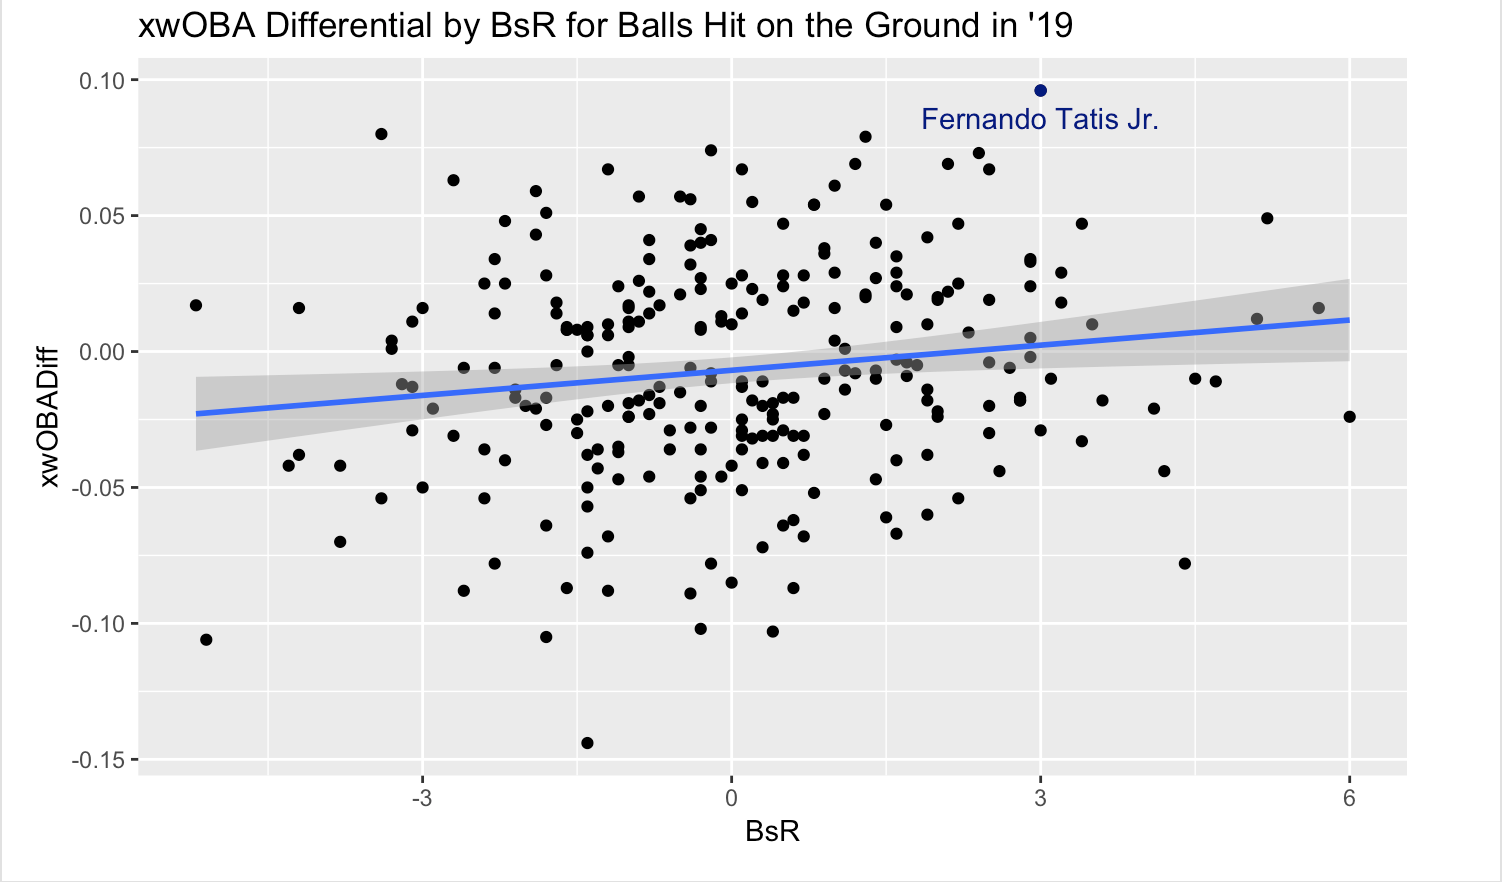
Lastly, to account for the ability of hitters to run the bases, we can take a look at the FanGraphs Baserunning Runs (BsR) metric. Back in May 2017, FanGraphs’ Craig Edwards had some incredible findings regarding the relationship between BsR and xwOBA Differential. While the BsR metric contains some redundant information that has already been analyzed within the sprint speed variable (speed is an integral component to baserunning value), it also possesses unique perspectives on the ability of a player to utilize their speed. Some players might be particularly skilled at choosing the right time to challenge a defender’s arm by trying for the extra base, or poor at rounding bases. It’s true that this metric is an estimate for baserunning abilities in its entirety, so elements like baserunning ability will be irrelevant to wOBA, but this is the only metric that accounts for instincts and decision-making on the basepaths.
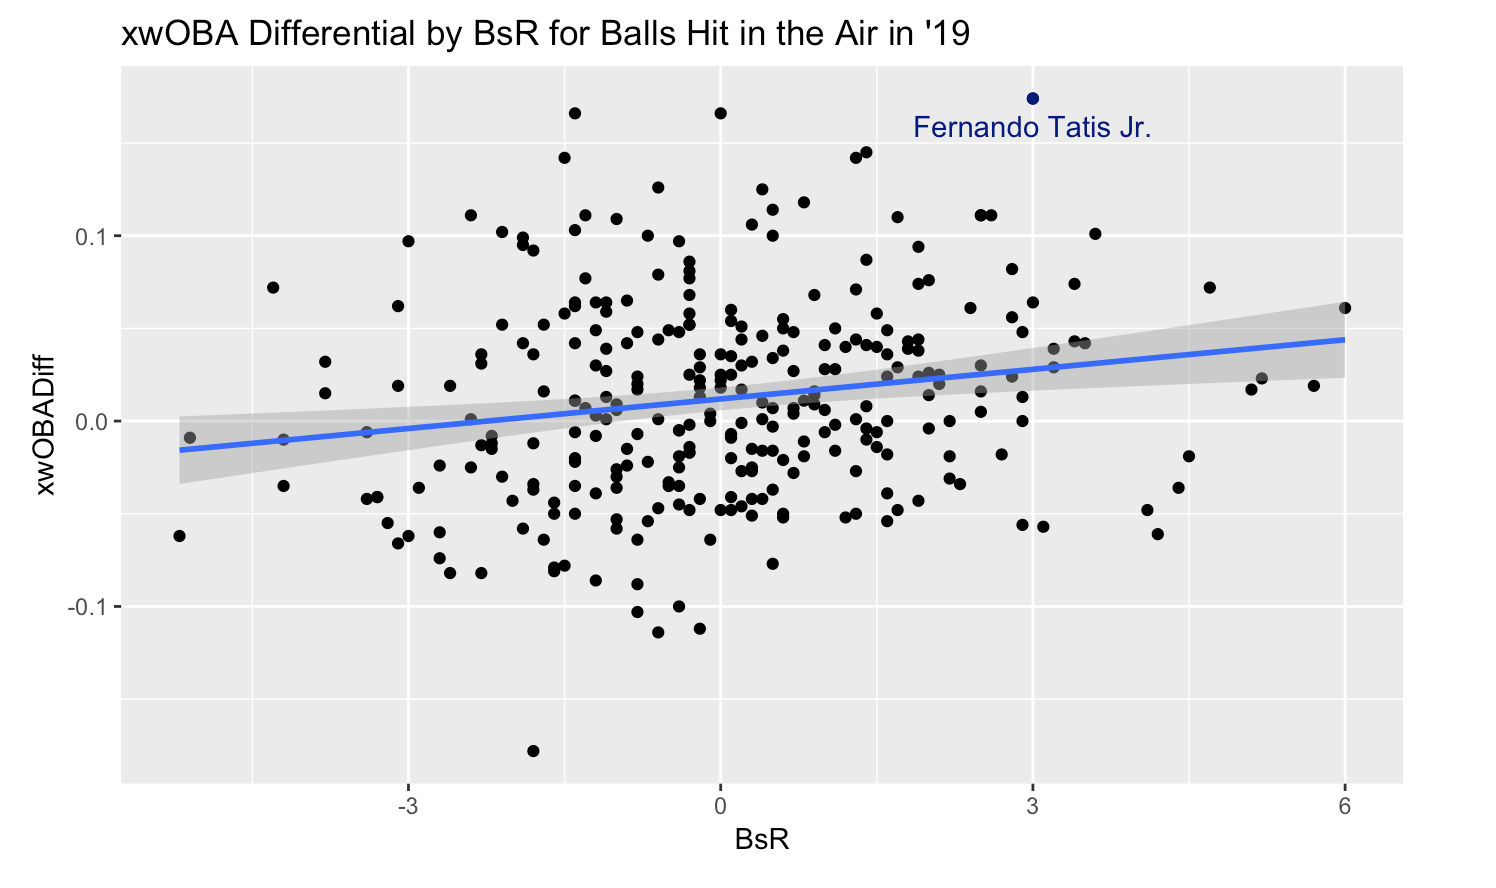
The scatterplots below exhibit the relationships between BsR and the difference between wOBA and xwOBA for both ground balls and fly balls. According to this metric, Tatis is a premier baserunner, at 3.0 baserunning runs (94th Percentile). Once again, there appears to be a slightly positive relationship between these two variables. While the correlation coefficient is far more favorable for the relationship between sprint speed and the xwOBA differential, this relationship is still statistically significant, because it has a P-value below 0.05, meaning we can reject the null hypothesis that there is no relationship between Baserunning Runs and xwOBA Differential. Ultimately, it appears conclusive that speed does play a role in the residuals of the Statcast models, which is relevant to the evaluation of Fernando Tatis Jr. going forward. While he certainly had some good luck on his side in the first half, these findings would indicate that once you factor in the value added from his speed, Tatis Jr. wasn’t nearly as fortunate as his X-Metrics would indicate.
Fernando Tatis Jr. has been a force to be reckoned with in the Padres lineup this season and while his historically high BABIP is bound to regress significantly, his speed should continue to enable him to outperform the models’ expectations for his offensive output. Tatis Jr. possesses a rare skill-set in that he has the potential to bring immense value to the Padres in all facets of the game. While he might be an MVP-caliber offensive player eventually, for now, we should temper the expectations for the 20-year-old stud and anticipate for him to perform as a significantly above-average regular offensively for the rest of the season.
(Photo by Brian Rothmuller/Icon Sportswire)
Great writeup! With all that being said can personally predict a slash line for Tatis Jr. in the second half?
Without getting too deep into the math, I would predict that the likely range of his slash would be in the ballpark of .255-.280/.320-.345/.485-.510 if he replicates his batted ball profile in the second-half.
I don’t think that xStats bring anything substantial to the conversation. All you need it that BABIP. xStat models are insanely crude. I’ll take the real rates over those. It is easy to understand how real outcomes can be misleading, but I don’t think people understand how poor those xModels are – they are way worse. Last I checked, they don’t even differentiate between left and right handed hitters and they likely don’t care about the defensive alignment – that is a lot of reality going ignored. I think the best way to understand how poor those models are is to watch a gamefeed along with a real broadcast. I have seen balls 10 rows deep in the stands that have 80% hit probability lol.
On that tag play, the only reason he made it is that the 2B just stood there looking dumb for a while – that was just a stupid decision and he got lucky. It will interesting to see how bold he is after he gets his hand caught in the cookie jar a few times. When you run into a silly out at home those tend to stick with you. Remember Baez shenanigans from last year which have don’t appear to be sustainable.I am not aware of Sprint Speed ever proving to be insightful. One of the clearest things on the field has always been who can run – I image you could just use SB as a proxy that would probably be about as insightful in terms of speed on performance.
Lastly, I am not buying SD as a contender. I am buying the NL West as maybe the worst division in baseball. There are sellers in that division that are also near that WC birth. It is like the NL East from last year where everyone is close just because they are all so bad outside of LAD. They undeniably have a few nice pieces, but they are a very flawed team in that they stink at making contact and their rotation is trash. They are a long ways from contending – they could luck into a WC birth but that isn’t contending.
Statcast’s models incorporate batted ball quality, which is an essential variable that isn’t present when evaluating BABIP. Should we expect Aaron Judge to have the same BABIP as Edwin Encarnacion? No, because the likelihood of Judge’s batted balls turning into hits is higher. Why is that? Due to the fact that he hits the ball harder, which is exactly what these metrics are accounting for. If a statistic didn’t have any weaknesses or limitations, we would just use it for everything, and these statistics are quite effective for evaluating offensive performance due to the reasons stated above, despite some limitations they have.
Sprint speed is clearly insightful, as shown in the examples from the article. Stolen bases are a factor of many elements that are irrelevant to this subject matter (raw number of opportunities to steal bases, percentage of times on first or second with a baserunner occupying the base in front of them, the ability of a baserunner to read a pitcher, the quickness of the pitcher to home plate, the pitch thrown when the baserunner stole, the catcher’s arm strength, the situation of the game, the time it takes for a baserunner to accelerate once they start moving, length of lead off of the base, etc.). Therefore, using stolen bases to help evaluate the impact of a player’s speed on their batting average, slugging percentage, and wOBA seems ridiculous when sprint speed is a metric that has the only relevant information possibly contained within stolen bases (how fast the player can run) without any of the noise. As stated in the article, the ideal metric to use in this situation would be one that accounts for the time that it takes a player to reach their peak speed after the ball is hit, how fast their peak speed is, and their efficiency in carving the bases and instinctual aggressiveness at trying to take extra bases. These components are all partially or entirely accounted for by the combination of the home plate to first base times, sprint speed, and BsR.
Lastly, I merely stated the Padres current position in the standings: within striking distance to be in a playoff position. I don’t understand how a team could make the playoffs, but be “a long ways from contending.”