


For all the niche analysis the fantasy community puts out every year about how good players could be, it doesn’t immediately translate into actual draft day rankings. If you play in a league based on categories rather than points, knowing how far to move a player up your draft board if you expect them to hit five additional home runs isn’t instantly clear — and the problem is only worse if you’re projecting a pitcher’s WHIP to drop .05 points.
Tools exist for this, but they have their limitations. The FanGraphs Auction calculator is probably the most useful, but it’s limited by the settings it offers. There’s just no way to use this tool to get a clear picture of Yordan Alvarez’s value in my 10-team mixed league that requires a designated hitter. And while it has some keeper functionality, I’ve found it hard to manage. Regardless, being forced into using the projections that Steamer, ZiPS and other services provide limits my choices should I disagree with them on Zac Gallen’s ERA and WHIP, or Mitch Garver’s playing time.
Whether your problem comes from weird league settings or your weird opinions about players, building your own rankings can be a good solution. All that’s needed is a functional understanding of the basics of Microsoft Excel and a few hours of your time. Your end goal is to be able to find not just how valuable a player is, but to find how much adding an extra home run, stolen base or save is to a player. In practice, this means calculating what the average player in your draft pool earns, and using the standard deviations from that pool to find the marginal value of each additional stat accrued.
This process is tedious and as prone to errors and mistakes as you are. I will do my best to make my instructions clear; do your best to check your work as you go to make sure you get something useful out of it.
Step 1: Build Your Data Set
However you wish to start, you’ll need to develop a data set.
If you’re starting from scratch, FanGraphs houses projections on its site, where they can be downloaded as .csv documents and opened in Excel, or used by more sophisticated modeling programs and languages. Even if you plan on changing these heavily, they are a good starting point to edit from. They do not, however, include positions, so you’ll have to add those in yourself. Some tips on organizing this data effectively:
- Download each position individually and place them in separate sheets. I also suggest that you completely separate pitchers and hitters into different books.
- Add in two columns on each of these sheets for primary and secondary positional eligibility. Fill in the first column of each with its position (1B for the first base group, SS for shortstops, and so on).
- From these sheets, copy and paste all the players you project to receive major league at-bats into one master sheet. Make sure to add the hardest-to-replace positions first — this makes combining multi-eligible players easier. I usually go C > 2B > SS > OF > 3B > 1B > DH.
- After filtering and freezing your top row, use the “duplicate values” conditional formatting function to highlight the names of players who show up twice. Combine any players who show up at multiple positions, and make sure to differentiate between players with the same name. If you created your master list by positional value, the top entry should be the position you keep, and the second should be the less valuable position. In practice, this will look like finding the two highlighted rows of George Springer on your “all” list, pasting DH into his secondary position column, and then deleting the DH row.
- Delete any columns for statistics that won’t affect your league scoring. This might mean keeping home runs and stolen bases, but also the components for batting average, hits and at-bats.
- Leave one blank column next to any counting stats, and two next to any rate stats. You’ll fill these in later.
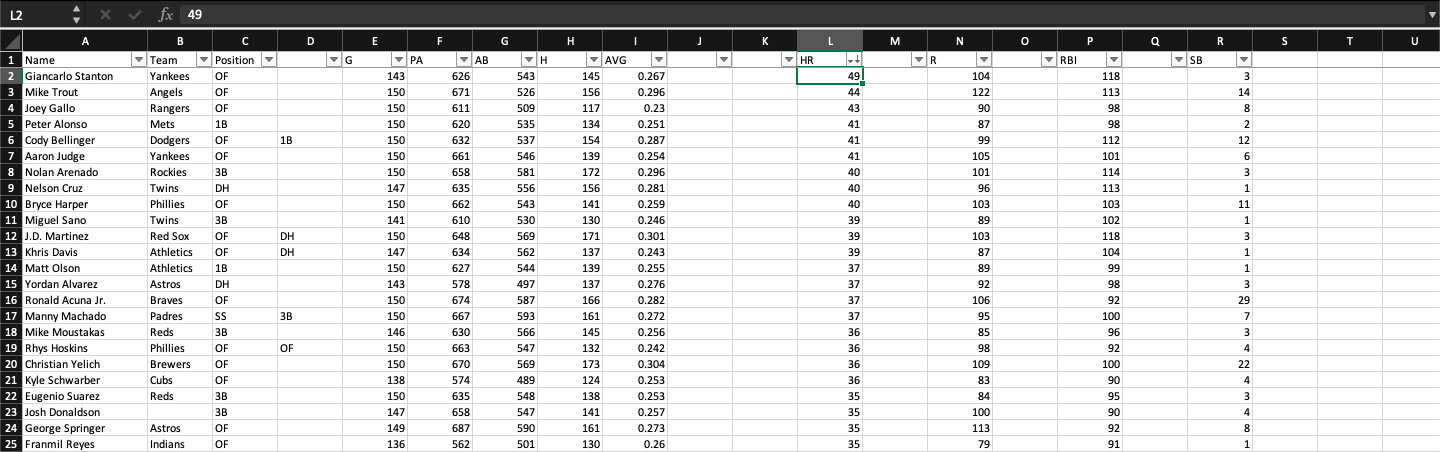
When finished, your master sheet should look something like this:
Step 2: Draft Your First Group of “Starters”
The end goal is to use averages and standard deviations to rank your drafted players. But, chances are, you won’t know who those are, which means you don’t know whose stats to average. You can do this by using a counting stat to rank your players and then drafting the top players by that metric into a separate sheet. Again, here are some tips for doing this effectively:
- Get around not knowing your draft pool by choosing a counting stat you think will correlate with your final rankings and using it to order your players: I usually choose home runs for hitters, strikeouts for starting pitchers, and saves for relievers. Sort by your chosen statistic, then sort by position. This should give you ad hoc positional rankings.
- Duplicate your master list and rename it “POOL 1.” Next to it, open a new sheet and title it “DRAFT 1” and copy your topline to that page.
- For each position, cut and paste the number of starters your league allows from POOL to DRAFT, then delete the rows they came from. For example, if your 12-team league only has three outfielders, cut and paste the top 36 outfielders and place them on your TEST page, and then right-click those highlighted rows to delete them to move the rest of the list up.
- If your league has a utility spot, you should be able to re-sort the entire list once you’ve transferred every other position over, and the remaining players should be your top utility options in order, usually starting with the top designated hitters.
- If your league has a middle infielder, corner infielder, or similar position, there will be an additional step before filling the utility spot, but after pulling the first round of infielders. You’ll need to combine only the second base and shortstop eligible players in one place; I like to make a “SCRATCH WORK” sheet where I do this, placing players who make the cut on my DRAFT page and sending the remaining players back to my POOL page so they can be considered for utility spots.
When finished, your DRAFT page should be all the players who made the cut for a starting spot. Your POOL page should be everyone who didn’t. For a Yahoo standard league, which is what I will be modeling, that means one each at catcher, first base, second base, shortstop and third base, three outfielders, and two utility players. For a 12-team league, that’s a total of 120 hitters. As for pitchers, their eight starting spots won’t necessarily fill your innings requirement, so I’m working with two relievers, two starting pitchers, and seven utility pitchers. Don’t worry about the remaining bench spots for now, since those players won’t be playing full time.
Step 3: Find League Average Stats
Now that you have drafted, you will be finding the league averages and standard deviations for each category. Before you can do that, though, you have to translate your rate stats into something that can be counted. I’ll give batting average as an example.
A player’s batting average value depends on how many at-bats they receive, so the actual value they receive is best expressed as hits above average, or how many more hits they earned than the average drafted player over their number of at-bats. First, to find the league-wide batting average, sum the total number of hits in your league and divide that by the sum of the at-bats. We’ll then calculate hits above average in that first blank column to the right of batting average. The following formulas will do that work for all the standard league rate stats; you can use the same concept to find similar ones for OBP, SLG, SIERA or K/9:
- Hits Above Average: (hits) – (at-bats) x (league batting average)
- Walks plus Hits Below Average: (league WHIP) x (innings pitched) – (walks + hits)
- Earned Runs Below Average: (league ERA/9) x (innings pitched) – (earned runs)
Once you’ve done this, use Excel’s standard deviation function for all your counting stats and adjusted rate stats. Standard deviations work here for a reason: The number that comes out is how many home runs, stolen bases, or strikeouts it takes to produce one unit of value. Here’s what the bottom of my sheet looks like:
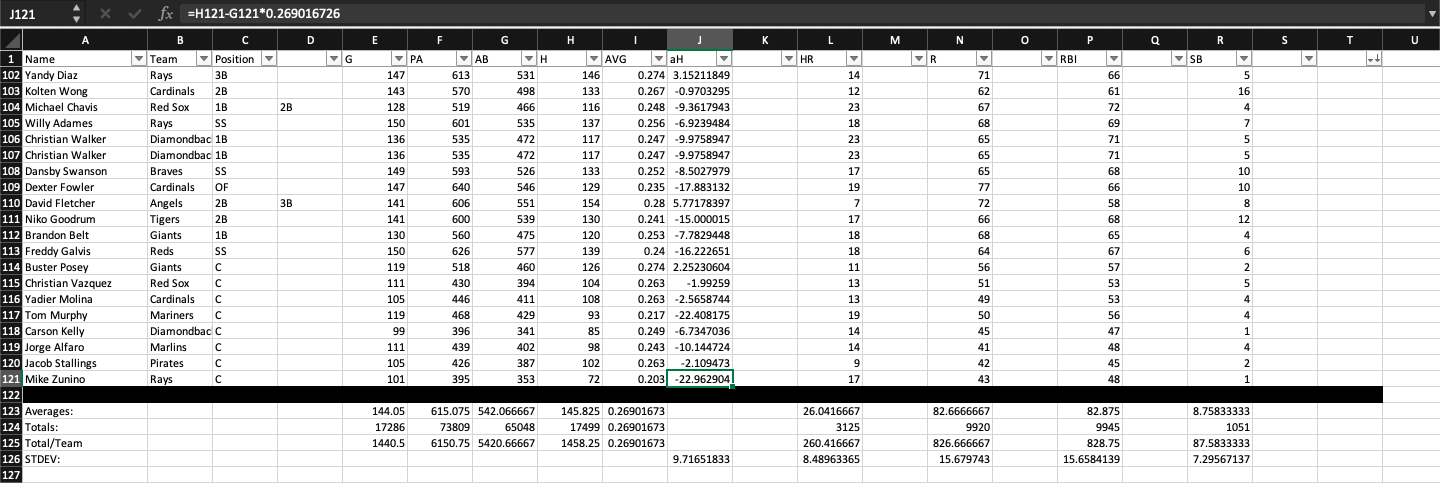
Everything below the black bar on this page is built by formulas tabulating my league totals and averages. Later, when I repeat this process, I can copy everything below it to my DRAFT 2 sheet to simplify this step greatly.
Step 4: Find Players’ Category Values
Now that you have your standard deviations, you can use them to find the amount of value a player earned per category. This just means finding the difference between what a player earns and the draft’s average and dividing that by the category’s standard deviation.
For rate stats such as batting average, half the work has already been done for you; just fill in the blank column next to hits above average with (hits above average) / (standard deviation for hits above average). As for counting stats, you will first have to subtract the league average from the player total before dividing the difference by the standard deviation. For home runs, that is (home runs – league average) / (standard deviation for home runs).
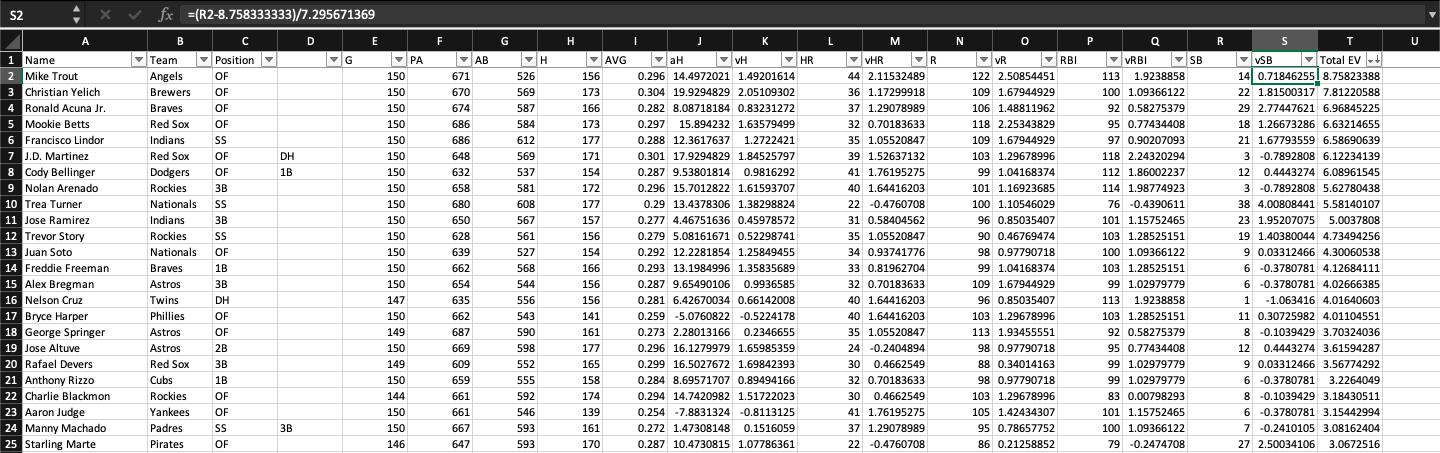
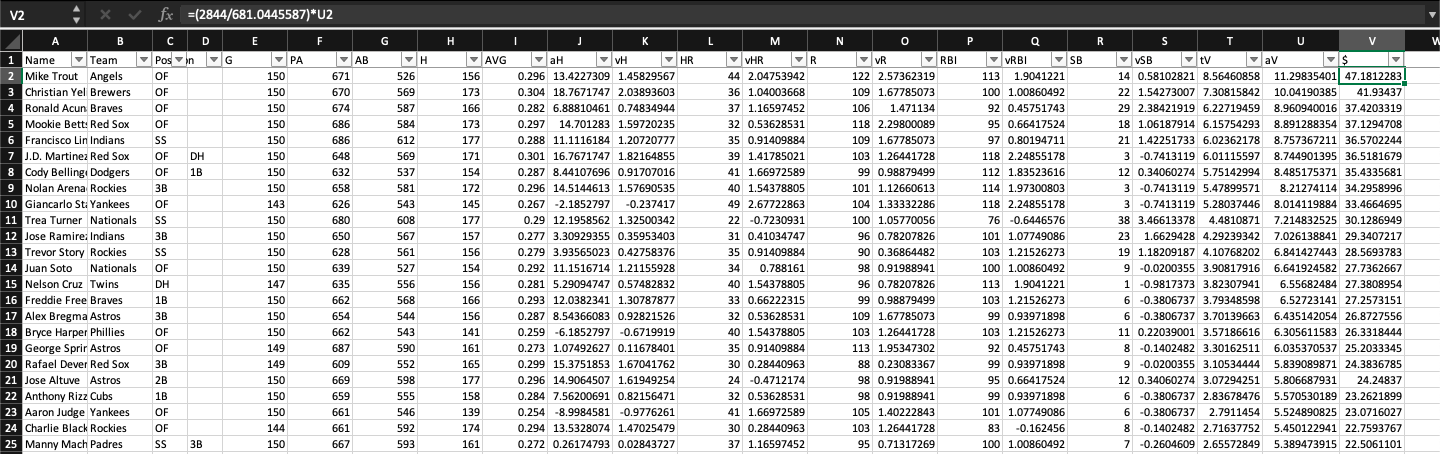
As the last step, make sure to total a player’s earned value. When you sort by this number, you should get back your league’s earned value rankings. For my standard Yahoo 12-team league, that finished product is below.
Step 5: Repeat
This first batch of stats is almost always slightly wrong, which means you’ll have to repeat the process multiple times. Making things easier, though, is having all the formulas written: A lot can be copied and pasted.
Start by duplicating your master list and adding all of the formulas you created on your DRAFT sheet. When you sort this sheet, you should be back where you were when you sorted your league by home runs or strikeouts. You can start over at step 2, but with the benefit of copying all the formulas that find your league averages and totals. Just make sure to apply the new league batting average or ERA to your adjusted rate stats.
Repeat until this process returns the same values twice in a row. This is typically around five iterations, though pitchers tend to take longer.
Step 6: Positional Adjustments
Once you’ve returned the same value twice in a row, you’ll have a raw ranking of the player earned values. But as you probably know, not all positions are created equal. Most drafted catchers will likely be very far below league average, and roughly half of hitters overall will be positive.
To correct for eligibility and keep things easy to read, we’ll push the values up so the last player drafted at each position has an adjusted value of zero. If the last OF returns an earned value of -3.554, you should add 3.554 to all of the outfielders. For hitters, these will vary, but for pitchers, expect the adjustment to be the same for both relievers and starters as long as you have a flex “pitcher” position. You can choose to artificially devalue relievers in saves leagues because of the high chance that projections fail, but I’ll leave that to you.
If you have players at middle infield, corner infield, utility or flex positions, you’ll be working with the last shortstop drafted overall, not necessarily the 12th shortstop off the board. But in leagues with more than one utility player, it’s entirely possible that players eligible to play at every position other than catcher are drafted as utility players. In this case, using the last utility player for all non-catcher batting positions will work just as well as calculating individual positions, if not better. As a hard rule, though, the last player drafted should have an adjusted value of zero. Make sure that holds true.
In practice, I create an additional column with this calculation to the right of my earned value list. I apply it to both my last DRAFT and last LEAGUE sheet, so that I have both a list of everyone who would be drafted, and how far away the rest of the league is.
Below are my final draft rankings for a Yahoo standard 12-team league, with auction values.
Step 7 (Optional): Generate Dollar Values
The list you have at this point should work on draft day for most snake drafts. But to use it in auction settings, you can divide the number of dollars available for bidding by the adjusted value up for sale.
This process is fairly simple:
- Total the amount of money you can bid. If you have a $260 budget, as does the rest of your 12-team league, then there should be $3,120 dollars spent. Subtracting out a $1 minimum bid for each of your 23 picks leaves $2,844 to actually play with.
- Add up the number of units of value up for auction by totaling the adjusted value column on your final DRAFT page for both batters and pitchers. If you generated 425 units for batters and 225 for pitchers, that gives you a total of 650 units of value.
- Divide the dollars by the value units. In this example, that’s $4.375 per unit.
- Add the $1 minimum bid for each player. Here, a 10-unit Christian Yelich is worth $44.75 on draft day.
Usually, the traditional 70/30 or 65/35 split comes from batters having far more units of value than pitchers; if your findings show that your league is undervaluing pitching, draft accordingly! If you are unsure or only want to find values for batters, you can always take 65% or so of your league’s budget and divide that just by the 425 units batters created.
A word of warning: While positional adjustments affect rankings in an obvious way by pushing up catchers, they also have a less obvious impact on dollar values. Should you choose to pin that $1 amount to a bench or waiver-wire player, you will greatly increase the total number of value units available league-wide. Giving 230 players just one additional unit during the positional adjustment means there will be 880 units to buy instead of 650. With your $2,844 total budget split more ways, each unit is suddenly worth $3.231, and Yelich’s value deflates from $44.75 to $33.31.
Creating Punt Draft Lists
There are two common and fatal misconceptions about punting that doom teams on draft day. Let me clear them up.
- Punting a category does not mean trying to be bad at it. You are ignoring it.
- You are not reaching to draft players who fit your punt build. Your goal is to get better value by not paying for the category you aren’t interested in.
With these two thoughts in mind, you should be able to use the strategies laid out above to come up with punt-build draft lists and auction values. You should still calculate league averages, positional replacements and dollars per value unit the same. The only difference is that you should also calculate how much players are worth when excluding your punted category.
These are best utilized along with accurate ADP values, whether “P” is for “pick” or “price.” Your goal should be to buy the right players at their normal price. You can still reach mildly at times, but you should still pay less than how valuable that player is to you. If Joey Gallo is worth $14 to the rest of the league and $24 to you in your punt build, paying $16 to get him isn’t terrible. But buying him at $24 is, as is spending a draft pick worth about $24. You’re not closing to winning your league if your dollars aren’t buying you more units of value, and your league mates will also be far more likely to catch onto your strategy and work to bid you up when you nominate Rhys Hoskins.
Chances are, you’ll end up bad at your punted category, but if done successfully — especially in head-to-head formats without an overall component — you should be able to spend your remaining dollars more efficiently. By taking an L in batting average, you could have more units of value than your competitors dispersed into your other nine categories.
How To Factor in Keepers
If you play in a league with keepers, especially a keeper auction league, finding the appropriate price to pay for players is more than tricky; it requires a lot of patience and some information you might not have until just before your draft kicks off. Even if your league mates are being extra secretive about their keeper lists, you can do most of the preparation early and execute your draft fairly easily. You will, however, need access to the keeper prices for each player in your league, whether that’s in terms of dollars or rounds.
You can start by comparing the expected prices calculated above with your league’s keeper prices to determine which players should be kept. If a player is 75th in value according to your rankings and can be kept with the 175th pick, expect them to be gone. The same goes for auction prices — $30 players with $10 keeper prices are going to be kept.
Once you’ve done this, you should have a good picture of the players who should be available on draft day. In snake drafts, your value may end here — if you find that many of the top players will not be available because they are being kept at low prices, maybe consider keeping players for higher draft picks if a better option will not obviously be available. It’s possible the 60th overall player should be kept with the 50th overall pick if you expect the other options available to you with that spot will be worse.
But in auction drafts, the real benefit is that you’ll now be able to calculate both how many remaining dollars are unspent and how many units of value are left on the board. Once you’ve done this, you should be able to calculate new prices for the remaining players using our method above, which could be considerably higher. If half of the draft’s 650 units have already been bought for just $1,000, then the remaining $1,844 to buy 325 units will go quickly. A 10-unit Yelich’s projected price would be $57.73: An increase of $13! Make sure to reassess your keeper picks with this in mind — in a league with a lot of keepers below their expected price, a borderline player will also be worth keeping.
Other Uses and Things Worth Considering
Rather than trying to complicate things for yourself, it is worth remembering that any projections — either created by you or a computer – will likely be wrong. You can think about this in terms of significant figures — just like it’s not worth obsessing over millimeters when your ruler only measures inches, it’s not worth obsessing over the exact projected batting average your Excel sheet computes. You are far more likely to win your league — and enjoy it in the process — if you can find the players that projections are missing on rather than by buying all of the players whose ADP are slightly below where you project them. That’s the guiding ethos behind a site like Pitcher List: We can outsmart systems like Steamer by finding players primed for a breakout, and outsmart the people we play against by selling high on supposed breakouts who look unsustainable.
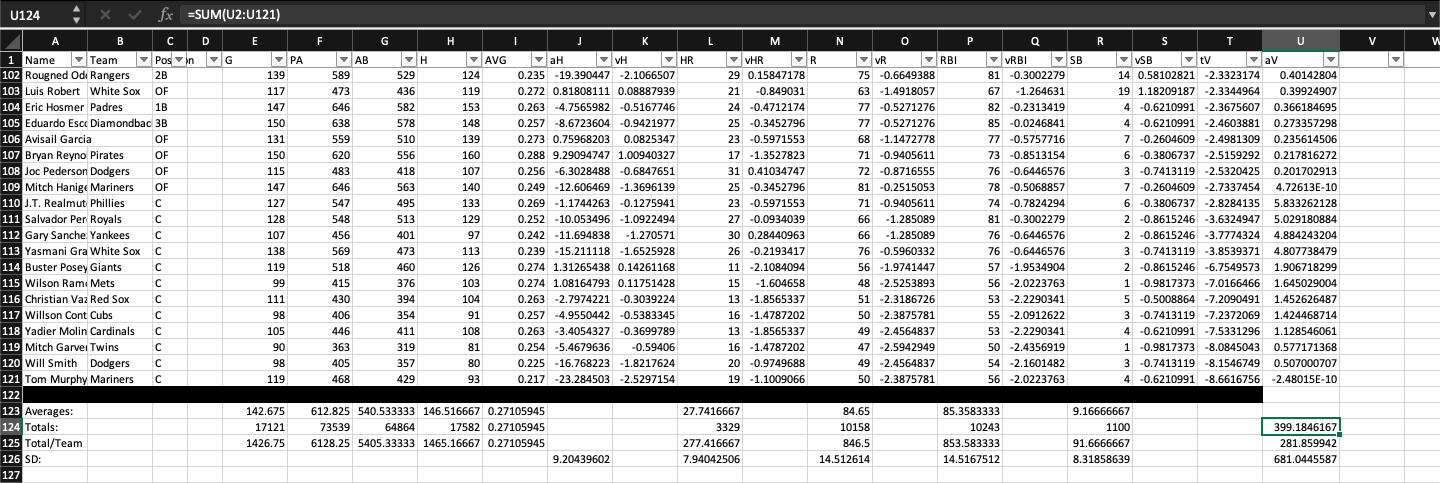
That said, those misses are unlikely to be so great that the category averages you generate will also be wrong. As a result, you can probably still use them to build your own ad hoc player value calculator. I make one in a new Excel tab using the same formulas used elsewhere, repeated with blank category columns so I can type in my own. I’ve reproduced what I use for mine below.
First, my hitting values:
| Mean | Marginal Value | Player Value | |
|---|---|---|---|
| Home Runs | 27.74 | 7.94 | (HR – 27.74) / 7.94 |
| Runs | 84.65 | 14.51 | (R – 84.65) / 14.51 |
| RBI | 85.36 | 14.52 | (RBI – 85.36) / 14.52 |
| Stolen Bases | 9.17 | 8.32 | (SB – 9.17) / 8.32 |
| Batting Average | 0.27106 | 9.2 (hits above average) | (H – 0.27106 x AB) / 9.2 |
And my pitching values:
| Mean | Marginal Value | Player Value | |
|---|---|---|---|
| Wins | 8.14 | 4.36 | (W – 8.14) / 4.3 |
| Saves | 7.73 | 12.73 | (SV – 7.73) / 12.73 |
| Strikeouts | 142.92 | 63.37 | (SO – 142.92) / 63.37 |
| ERA | 3.8317 | 5.31 (earned runs below average) | (IP x 3.8317⁄9 – ER) / 5.31 |
| WHIP | 1.2198 | 11.28 (walks + hits below average) | (1.2198 x IP – (W+H)) / 11.28 |
As for positional adjustments, I err on the side of simplicity, adding 2.61 for pitchers, 8.66 for catchers, and 2.73 for all other batters. I then turn these earned values into estimated auction values by multiplying by 4.18 and then adding $1.
There are some places where this model breaks. For players with lower games-started totals, such as Howie Kendrick, Joc Pederson or Jo Adell, those numbers are not created equal. If Adell does not make the Opening Day roster, misses about a month before he is called up, and then bats for you regularly, you will lose some at-bat opportunities by virtue of being down a bench spot, but you’ll likely have a fill-in player for him while he’s in the minors. Come May 1, his value will rise significantly. This may mean he’s far more valuable in leagues with playoffs than in roto leagues, where games in April count just as much as in September.
You should also be careful not to stick too close to these values if your draft goes haywire. If the prices for elite base stealers or closers are way above what you’ve projected, that means you should be able to acquire players who are elite at other skills for cheaper. Also note that if one or two players in your league are vacuuming up as many niche-category players as possible, it will take far fewer saves to be second best, and you should be content to buy fewer. Your rankings won’t be able to dynamically reflect these scenarios, but you could take an approach similar to the punt draft section to guide you on how to move forward.
This exercise takes far less time than you may anticipate and can reap you significant rewards, especially if you find coverage of your league’s specific settings to be lacking. Just be sure to take your time, check your work, and take your own findings with a grain of salt. You aren’t operating a tool as powerful as the FanGraphs Auction calculator — but you’ll be getting some insights that using tools like that alone can’t give you.
Featured image By Justin Paradis (@FreshMeatComm on Twitter)
I’m trying to find MLB statistical averages by position (C, F, S, etc. SP, RP) such as BA, RBI, wRC+, era, whip, etc. for the 2019 season. Is there one location that has them all? I would appreciate an email response if you have a moment. Thanks.
It’s about time someone posted an article detailing the number crunching. You need an archive of this sort of how to. From this one, I particularly like the use of mock drafts to establish value. I have used ADP for that purpose.
“This first batch of stats is almost always slightly wrong, which means you’ll have to repeat the process multiple times.” What exactly do you mean by the first batch of stats is always wrong?
How do you go about integrating hitting rankings with pitching? My pitcher values come out higher than that of the hitters, G Cole at 12.6 to R Acuna at 9.09